Estimated zip code population in 2022: 27,186 Zip code population in 2010: 27,294 Zip code population in 2000: 26,552
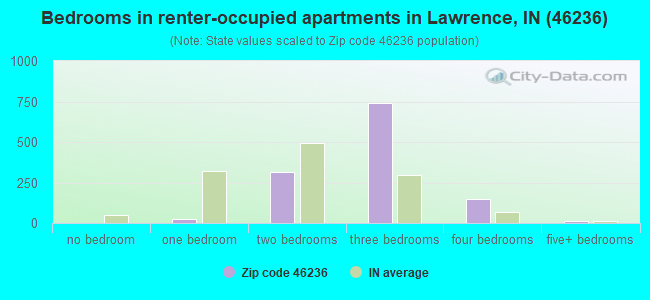
Houses and condos: 10,455 Renter-occupied apartments: 1,254
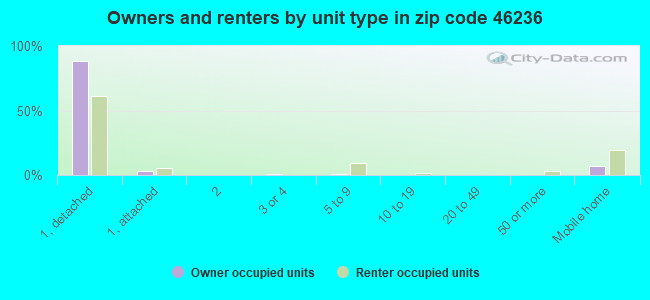
% of renters here:
12%
State:
29%
March 2022 cost of living index in zip code 46236: 89.6 (less than average, U.S. average is 100)
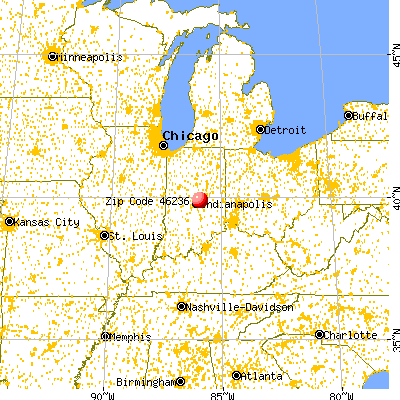
Land area: 10.5 sq. mi. Water area: 1.5 sq. mi.
Population density: 2,585 people per square mile
(average).
OSM Map
General Map
Google Map
MSN Map
OSM Map
General Map
Google Map
MSN Map
OSM Map
General Map
Google Map
MSN Map
OSM Map
General Map
Google Map
MSN Map
Please wait while loading the map...
Real estate property taxes paid for housing units in 2022:
This zip code:
0.9% ($2,537)
Indiana:
0.7% ($1,467)
Median real estate property taxes paid for housing units with mortgages in 2022: $2,571 (0.9%) Median real estate property taxes paid for housing units with no mortgage in 2022: $2,526 (0.9%)
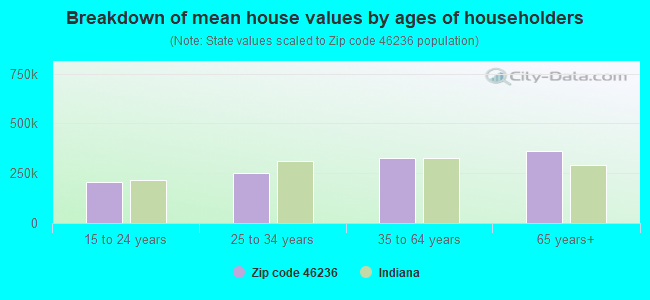
Estimated median house/condo value in 2022: $294,749
46236:
$294,749
Indiana:
$208,700
Median resident age:
This zip code:
38.8 years
Indiana median age:
38.2 years
Average household size:
This zip code:
2.6 people
Indiana:
2.4 people
Averages for the 2020 tax year for zip code 46236, filed in 2021:
Average Adjusted Gross Income (AGI) in 2020: $105,326 (Individual Income Tax Returns)
Here:
$105,326
State:
$64,978
Salary/wage: $80,837 (reported on 83.8% of returns)
Here:
$80,837
State:
$55,245
(% of AGI for various income ranges: 1110.5% for AGIs below $25k, 3647.4% for AGIs $25k-50k, 6508.3% for AGIs $50k-75k, 9756.1% for AGIs $75k-100k, 18586.8% for AGIs $100k-200k, 87289.2% for AGIs over 200k)
Taxable interest for individuals: $1,752 (reported on 32.8% of returns)
This zip code:
$1,752
Indiana:
$1,351
(% of AGI for various income ranges: 10.2% for AGIs below $25k, 15.8% for AGIs $25k-50k, 32.4% for AGIs $50k-75k, 48.7% for AGIs $75k-100k, 111.7% for AGIs $100k-200k, 1178.5% for AGIs over 200k)
Ordinary dividends: $8,143 (reported on 23.7% of returns)
Here:
$8,143
State:
$5,827
(% of AGI for various income ranges: 26.5% for AGIs below $25k, 45.2% for AGIs $25k-50k, 102.9% for AGIs $50k-75k, 111.8% for AGIs $75k-100k, 371.6% for AGIs $100k-200k, 4227.7% for AGIs over 200k)
Net capital gain/loss in AGI: +$29,763 (reported on 21.6% of returns)
Here:
+$29,763
State:
+$17,730
(% of AGI for various income ranges: 16.7% for AGIs below $25k, 61.6% for AGIs $25k-50k, 78.6% for AGIs $50k-75k, 129.3% for AGIs $75k-100k, 477.6% for AGIs $100k-200k, 19731.3% for AGIs over 200k)
Profit/loss from business: +$17,069 (reported on 17.5% of returns)
Here:
+$17,069
State:
+$12,144
(% of AGI for various income ranges: 119.4% for AGIs below $25k, 202.2% for AGIs $25k-50k, 234.1% for AGIs $50k-75k, 283.0% for AGIs $75k-100k, 652.0% for AGIs $100k-200k, 4405.9% for AGIs over 200k)
Taxable individual retirement arrangement distribution: $24,667 (reported on 10.7% of returns)
46236:
$24,667
Indiana:
$18,302
(% of AGI for various income ranges: 56.6% for AGIs below $25k, 112.2% for AGIs $25k-50k, 223.0% for AGIs $50k-75k, 353.8% for AGIs $75k-100k, 889.0% for AGIs $100k-200k, 2967.9% for AGIs over 200k)
Self-employed (Keogh) retirement plans: $26,433 (reported on 1.1% of returns)
46236:
$26,433
Indiana:
$27,160
(% of AGI for various income ranges: 40.0% for AGIs $100k-200k, 854.6% for AGIs over 200k)
Total itemized deductions: $38,158 (reported on 13.3% of returns)
Here:
$38,158
State:
$35,601
(% of AGI for various income ranges: 77.4% for AGIs below $25k, 144.2% for AGIs $25k-50k, 353.1% for AGIs $50k-75k, 573.8% for AGIs $75k-100k, 1142.0% for AGIs $100k-200k, 9287.7% for AGIs over 200k)
Charity contributions: $18,876 (reported on 11.3% of returns)
Here:
$18,876
State:
$15,596
(% of AGI for various income ranges: 6.4% for AGIs below $25k, 18.5% for AGIs $25k-50k, 58.2% for AGIs $50k-75k, 120.3% for AGIs $75k-100k, 340.1% for AGIs $100k-200k, 5504.6% for AGIs over 200k)
Taxes paid: $8,013 (reported on 13.3% of returns)
46236:
$8,013
State:
$7,542
(% of AGI for various income ranges: 8.7% for AGIs below $25k, 26.2% for AGIs $25k-50k, 80.4% for AGIs $50k-75k, 151.1% for AGIs $75k-100k, 347.2% for AGIs $100k-200k, 1465.1% for AGIs over 200k)
Earned income credit: $2,157 (reported on 9.8% of returns)
Here:
$2,157
State:
$2,298
(% of AGI for various income ranges: 68.6% for AGIs below $25k, 54.0% for AGIs $25k-50k, 0.9% for AGIs $50k-75k)
Percentage of individuals using paid preparers for their 2020 taxes: 92.1%
Here:
92%
State:
94%
(% for various income ranges: 90.1% for AGIs below $25k, 93.1% for AGIs $25k-50k, 92.6% for AGIs $50k-75k, 93.0% for AGIs $75k-100k, 92.5% for AGIs $100k-200k, 92.7% for AGIs over 200k)
Averages for the 2012 tax year for zip code 46236, filed in 2013:
Average Adjusted Gross Income (AGI) in 2012: $85,054 (Individual Income Tax Returns)
Here:
$85,054
State:
$52,932
Salary/wage: $69,650 (reported on 86.8% of returns)
Here:
$69,650
State:
$45,173
(% of AGI for various income ranges: 74.8% for AGIs below $25k, 79.9% for AGIs $25k-50k, 79.1% for AGIs $50k-75k, 80.7% for AGIs $75k-100k, 80.9% for AGIs $100k-200k, 56.3% for AGIs over 200k)
Taxable interest for individuals: $2,374 (reported on 35.8% of returns)
This zip code:
$2,374
Indiana:
$1,311
(% of AGI for various income ranges: 0.9% for AGIs below $25k, 0.6% for AGIs $25k-50k, 0.5% for AGIs $50k-75k, 0.6% for AGIs $75k-100k, 0.4% for AGIs $100k-200k, 1.8% for AGIs over 200k)
Ordinary dividends: $5,812 (reported on 25.1% of returns)
Here:
$5,812
State:
$4,690
(% of AGI for various income ranges: 2.1% for AGIs below $25k, 1.3% for AGIs $25k-50k, 1.1% for AGIs $50k-75k, 1.2% for AGIs $75k-100k, 1.3% for AGIs $100k-200k, 2.4% for AGIs over 200k)
Net capital gain/loss in AGI: +$11,589 (reported on 20.4% of returns)
Here:
+$11,589
State:
+$10,406
(% of AGI for various income ranges: 0.1% for AGIs $25k-50k, 0.2% for AGIs $50k-75k, 0.4% for AGIs $75k-100k, 0.9% for AGIs $100k-200k, 6.5% for AGIs over 200k)
Profit/loss from business: +$16,782 (reported on 16.9% of returns)
Here:
+$16,782
State:
+$11,105
(% of AGI for various income ranges: 8.8% for AGIs below $25k, 4.2% for AGIs $25k-50k, 2.3% for AGIs $50k-75k, 2.7% for AGIs $75k-100k, 2.7% for AGIs $100k-200k, 3.6% for AGIs over 200k)
Taxable individual retirement arrangement distribution: $19,283 (reported on 10.5% of returns)
46236:
$19,283
Indiana:
$13,841
(% of AGI for various income ranges: 3.1% for AGIs below $25k, 2.4% for AGIs $25k-50k, 2.8% for AGIs $50k-75k, 2.6% for AGIs $75k-100k, 2.8% for AGIs $100k-200k, 1.8% for AGIs over 200k)
Self-employment retirement plans: $24,535 (reported on 1.3% of returns)
46236:
$24,535
Indiana:
$21,482
(% of AGI for various income ranges: 0.2% for AGIs $25k-50k, 0.2% for AGIs $100k-200k, 0.8% for AGIs over 200k)
Total itemized deductions: $25,255 (18% of AGI, reported on 48.0% of returns)
Here:
$25,255
State:
$20,913
Here:
17.5% of AGI
State:
18.2% of AGI
(% of AGI for various income ranges: 12.6% for AGIs below $25k, 13.5% for AGIs $25k-50k, 15.6% for AGIs $50k-75k, 15.9% for AGIs $75k-100k, 15.9% for AGIs $100k-200k, 12.4% for AGIs over 200k)
Charity contributions: $4,905 (reported on 41.1% of returns)
Here:
$4,905
State:
$4,697
(% of AGI for various income ranges: 0.9% for AGIs below $25k, 1.5% for AGIs $25k-50k, 2.1% for AGIs $50k-75k, 2.4% for AGIs $75k-100k, 2.6% for AGIs $100k-200k, 2.6% for AGIs over 200k)
Taxes paid: $10,093 (reported on 47.8% of returns)
46236:
$10,093
State:
$7,456
(% of AGI for various income ranges: 2.1% for AGIs below $25k, 3.1% for AGIs $25k-50k, 4.7% for AGIs $50k-75k, 5.4% for AGIs $75k-100k, 6.4% for AGIs $100k-200k, 6.4% for AGIs over 200k)
Earned income credit: $2,140 (reported on 10.8% of returns)
Here:
$2,140
State:
$2,265
(% of AGI for various income ranges: 5.1% for AGIs below $25k, 0.9% for AGIs $25k-50k)
Percentage of individuals using paid preparers for their 2012 taxes: 44.8%
Here:
45%
State:
53%
(% for various income ranges: 41.6% for AGIs below $25k, 41.6% for AGIs $25k-50k, 43.4% for AGIs $50k-75k, 45.5% for AGIs $75k-100k, 44.4% for AGIs $100k-200k, 70.7% for AGIs over 200k)
Averages for the 2004 tax year for zip code 46236, filed in 2005:
Average Adjusted Gross Income (AGI) in 2004: $77,609 (Individual Income Tax Returns)
Here:
$77,609
State:
$44,790
Salary/wage: $65,956 (reported on 88.7% of returns)
Here:
$65,956
State:
$39,615
(% of AGI for various income ranges: 378.5% for AGIs below $10k, 74.9% for AGIs $10k-25k, 84.7% for AGIs $25k-50k, 86.3% for AGIs $50k-75k, 88.3% for AGIs $75k-100k, 67.6% for AGIs over 100k)
Taxable interest for individuals: $1,933 (reported on 51.3% of returns)
This zip code:
$1,933
Indiana:
$1,535
(% of AGI for various income ranges: 12.5% for AGIs below $10k, 2.2% for AGIs $10k-25k, 1.0% for AGIs $25k-50k, 0.7% for AGIs $50k-75k, 0.6% for AGIs $75k-100k, 1.5% for AGIs over 100k)
Taxable dividends: $3,552 (reported on 32.4% of returns)
Here:
$3,552
State:
$2,998
(% of AGI for various income ranges: 19.8% for AGIs below $10k, 2.3% for AGIs $10k-25k, 1.0% for AGIs $25k-50k, 0.9% for AGIs $50k-75k, 0.7% for AGIs $75k-100k, 1.7% for AGIs over 100k)
Net capital gain/loss: +$16,369 (reported on 26.7% of returns)
Here:
+$16,369
State:
+$8,619
(% of AGI for various income ranges: 10.5% for AGIs below $10k, 2.0% for AGIs $10k-25k, 0.3% for AGIs $25k-50k, 0.8% for AGIs $50k-75k, 0.8% for AGIs $75k-100k, 8.7% for AGIs over 100k)
Profit/loss from business: +$16,995 (reported on 16.0% of returns)
Here:
+$16,995
State:
+$10,071
(% of AGI for various income ranges: -14.3% for AGIs below $10k, 6.7% for AGIs $10k-25k, 3.7% for AGIs $25k-50k, 2.6% for AGIs $50k-75k, 2.6% for AGIs $75k-100k, 3.8% for AGIs over 100k)
IRA payment deduction: $3,019 (reported on 2.6% of returns)
46236:
$3,019
Indiana:
$2,840
(% of AGI for various income ranges: 0.2% for AGIs $10k-25k, 0.2% for AGIs $25k-50k, 0.1% for AGIs $50k-75k, 0.1% for AGIs $75k-100k, 0.1% for AGIs over 100k)
Self-employed pension: $18,190 (reported on 1.9% of returns)
Here:
$18,190
Indiana:
$15,305
(% of AGI for various income ranges: 0.1% for AGIs $25k-50k, 0.1% for AGIs $50k-75k, 0.1% for AGIs $75k-100k, 0.6% for AGIs over 100k)
Total itemized deductions: $21,984 (18% of AGI, reported on 56.6% of returns)
Here:
$21,984
State:
$17,065
Here:
18.3% of AGI
State:
19.5% of AGI
(% of AGI for various income ranges: 57.9% for AGIs below $10k, 14.9% for AGIs $10k-25k, 17.4% for AGIs $25k-50k, 20.1% for AGIs $50k-75k, 18.9% for AGIs $75k-100k, 14.2% for AGIs over 100k)
Charity contributions deductions: $3,957 (3% of AGI, reported on 50.6% of returns)
Here:
$3,957
State:
$3,550
Here:
3.1% of AGI
State:
3.8% of AGI
(% of AGI for various income ranges: 2.5% for AGIs below $10k, 1.2% for AGIs $10k-25k, 1.9% for AGIs $25k-50k, 2.7% for AGIs $50k-75k, 2.4% for AGIs $75k-100k, 2.8% for AGIs over 100k)
Total tax: $14,746 (reported on 81.2% of returns)
46236:
$14,746
State:
$6,914
(% of AGI for various income ranges: 9.4% for AGIs below $10k, 4.6% for AGIs $10k-25k, 7.2% for AGIs $25k-50k, 8.9% for AGIs $50k-75k, 10.0% for AGIs $75k-100k, 19.8% for AGIs over 100k)
Earned income credit: $1,674 (reported on 7.0% of returns)
Here:
$1,674
State:
$1,685
Percentage of individuals using paid preparers for their 2004 taxes: 47.6%
Here:
48%
State:
59%
(% for various income ranges: 40.2% for AGIs below $10k, 49.0% for AGIs $10k-25k, 46.5% for AGIs $25k-50k, 47.0% for AGIs $50k-75k, 44.1% for AGIs $75k-100k, 56.3% for AGIs over 100k)
Likely homosexual households (counted as self-reported same-sex unmarried-partner households)
Lesbian couples: 0.0% of all households
Gay men: 0.2% of all households
Household received Food Stamps/SNAP in the past 12 months: 522 Household did not receive Food Stamps/SNAP in the past 12 months: 9,768
Women who had a birth in the past 12 months: 245 (255 now married, 8 unmarried) Women who did not have a birth in the past 12 months: 5,722 (2,501 now married, 3,221 unmarried)
Housing units in zip code 46236 with a mortgage: 6,323 (628 second mortgage, 33 home equity loan, 547 both second mortgage and home equity loan) Houses without a mortgage: 237
Median monthly owner costs for units with a mortgage: $1,611 Median monthly owner costs for units without a mortgage: $627
Residents with income below the poverty level in 2022:
This zip code:
8.1%
Whole state:
12.6%
Residents with income below 50% of the poverty level in 2022:
This zip code:
2.0%
Whole state:
6.3%
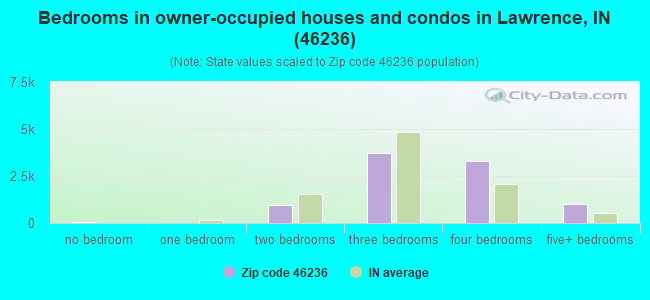
Median number of rooms in houses and condos:
Here:
7.6
State:
6.6
Median number of rooms in apartments:
Here:
4.9
State:
4.3
Notable locations in this zip code not listed on our city pages
Notable locations in zip code 46236: Indian Lake Country Club (A), Old Oakland Golf Course (B), Camp Elm (C), Lawrence Township Fire Department Station 334 (D). Display/hide their locations on the map
Streams, rivers, and creeks: Woodbury Branch (A), India Branch (B), Dry Branch (C), North Fork Fall Creek (D), Mock Creek (E), Middle Fork Fall Creek (F). Display/hide their locations on the map
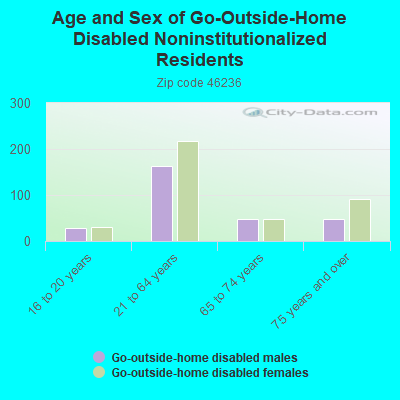
In group quarters: 129 (-1 institutionalized population)
Size of family households: 3,637 2-persons, 1,277 3-persons, 1,410 4-persons, 706 5-persons, 74 6-persons, 156 7-or-more-persons
Size of nonfamily households: 2,109 1-person, 621 2-persons, 280 3-persons
4,592 married couples with children.
1,321 single-parent households (284 men, 1,037 women).
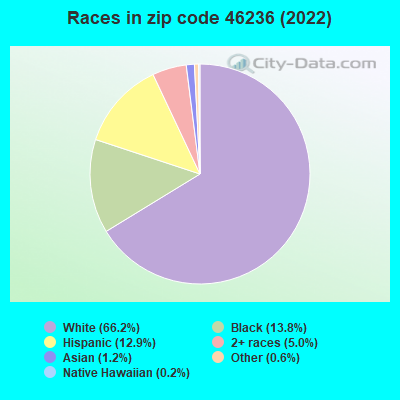
87.0% of residents of 46236 zip code speak English at home.
10.3% of residents speak Spanish at home (45% very well, 43% well, 13% not well).
2.0% of residents speak other Indo-European language at home (88% very well, 12% well).
0.6% of residents speak Asian or Pacific Island language at home (35% very well, 36% well, 29% not well).
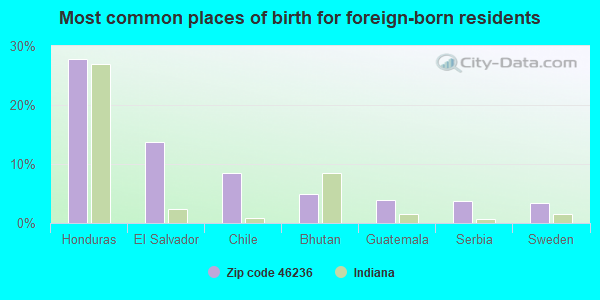
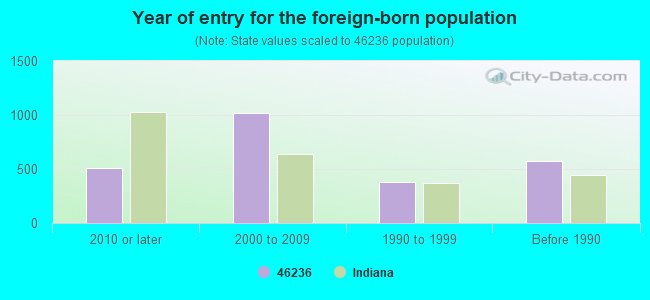
Foreign born population: 1,990 (7.3%) (56.7% of them are naturalized citizens)
Major facilities with environmental interests located in this zip code:
BABCOCK & WILCOX ERI OPER (10930 E 39TH ST in INDIANAPOLIS, IN)
STATE MASTER (Indiana facility tracking) - CRTK-123, EPCRA, VRP-6961011, VOLUNTARY CLEAN UP PROGRAM HAZARDOUS WASTE BIENNIAL REPORTER (Resource Conservation and Recovery Act (tracking hazardous waste)) (Resource Conservation and Recovery Act (tracking hazardous waste)) TRI REPORTER (Tracking of toxic chemicals releasing facilities) Business SIC classification: ORDNANCE AND ACCESSORIES Organizations: MCDERMOTT INC (CONTACT/OWNER)
Alternative names: BABCOCK AND WILCOX ERI DIVISON, BABCOCK & WILCOX, ERI OPS.
BFI INFECTIOUS WASTE TRANSFER SITE (10000 E 56TH ST in INDIANAPOLIS, IN)
STATE MASTER (Indiana facility tracking) - LUST-199204520, LEAKING STORAGE TANK, UST-16244, UNDERGROUND STORAGE TANK PROGRAM, CRTK-6405, EPCRA (Resource Conservation and Recovery Act (tracking hazardous waste)) Organizations: BROWNING FERRIS IND (CONTACT/OWNER)
Alternative names: BROWNING FERRIS INDUSTRIES
ALLER METALS (10601 E 59TH ST in INDIANAPOLIS, IN)
STATE MASTER (Indiana facility tracking) - LUST-199407506, LEAKING STORAGE TANK, UST-9050, UNDERGROUND STORAGE TANK PROGRAM (Resource Conservation and Recovery Act (tracking hazardous waste)) Organizations: FERGUSON STEEL (CONTACT/OWNER)
BONDED SERVICE STATION (9997 E 38TH ST in INDIANAPOLIS, IN)
STATE MASTER (Indiana facility tracking) - CRTK-5598, EPCRA, LUST-199111549, LEAKING STORAGE TANK, UST-2406, UNDERGROUND STORAGE TANK PROGRAM (Resource Conservation and Recovery Act (tracking hazardous waste)) Organizations: SPEEDWAY SUPERAMERICA LLC (CONTACT/OWNER)
Alternative names: BONDED 1208
PIKE EXPRESS AMOCO (9001 PENDLETON PIKE in INDIANAPOLIS, IN)
STATE MASTER (Indiana facility tracking) - CRTK-7607, EPCRA, LUST-198911534, LEAKING STORAGE TANK, SPILL-199102086, RELEASE ASSESSMENT, UST-1070, UNDERGROUND STORAGE TANK PROGRAM Conditionally Exempt Small Quantity Generators, less than 100 kg/month of hazardous waste (Resource Conservation and Recovery Act (tracking hazardous waste)) - notification Organizations: AMOCO OIL CO (CONTACT/OWNER)
Alternative names: AMOCO PIKE EXPRESS 547
AMY BEVERLAND ELEMENTARY (11650 FOX RD in INDIANAPOLIS, IN)
(National Center for Education Statistics) - STATE ID-5287 Organizations: M S D LAWRENCE TOWNSHIP (SCHOOL DISTRICT)
GREATER NORTHEAST BAPTIST CHURCH (9809 E 42ND ST in INDIANAPOLIS, IN)
(Integrated Compliance Information System) - ICIS-05-2000-0471, FORMAL ENFORCEMENT ACTION STATE MASTER (Indiana facility tracking) Business SIC classification: RELIGIOUS ORGANIZATIONS
OAKLANDON ELEMENTARY SCHOOL (6702 OAKLANDON RD in INDIANAPOLIS, IN)
(National Center for Education Statistics) - STATE ID-5296 Organizations: M S D LAWRENCE TOWNSHIP (SCHOOL DISTRICT)
COMPO CAST (10640 E 59TH ST in INDIANAPOLIS, IN)
STATE MASTER (Indiana facility tracking) (Resource Conservation and Recovery Act (tracking hazardous waste))
PETRO SPECIALISTS (4327 DOWNES DR in INDIANAPOLIS, IN)
STATE MASTER (Indiana facility tracking) (Resource Conservation and Recovery Act (tracking hazardous waste)) Organizations: BAIRD JEFFREY D (CONTACT/OWNER)
MSD LAWRENCE TWP (5850 THUNDERBIRD RD in INDIANAPOLIS, IN)
STATE MASTER (Indiana facility tracking) Conditionally Exempt Small Quantity Generators, less than 100 kg/month of hazardous waste (Resource Conservation and Recovery Act (tracking hazardous waste)) Organizations: NOT PROVIDED (CONTACT/OWNER)
OAKLANDON LAWN & GARDEN (6451 OAKLANDON RD in INDIANAPOLIS, IN)
STATE MASTER (Indiana facility tracking) Conditionally Exempt Small Quantity Generators, less than 100 kg/month of hazardous waste (Resource Conservation and Recovery Act (tracking hazardous waste)) Organizations: SCOTT SCHENCK (CONTACT/OWNER)
BP FACILITY #13051 (11019 PENDLETON PIKE in INDIANAPOLIS, IN)
Conditionally Exempt Small Quantity Generators, less than 100 kg/month of hazardous waste (Resource Conservation and Recovery Act (tracking hazardous waste)) Organizations: BP PRODUCTS NORTH AMERICA (CONTACT/OPERATOR)
Housing units lacking complete plumbing facilities: 0.7% Housing units lacking complete kitchen facilities: 0.5%
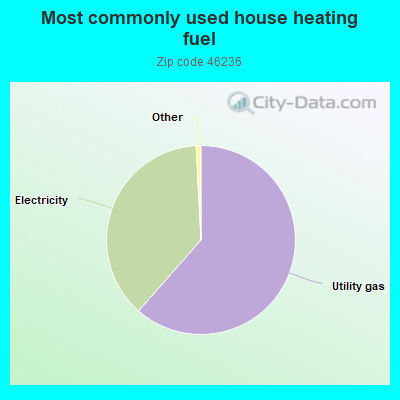
61.5%Utility gas
37.7%Electricity
Population in 1990: 31,475.
Place of birth for U.S.-born residents:
This state: 17,128
Northeast: 1,057
Midwest: 3,347
South: 2,564
West: 556
46% of the 46236 zip code residents lived in the same house 5 years ago. Out of people who lived in different houses, 65% lived in this county. Out of people who lived in different counties, 50% lived in Indiana.
94% of the 46236 zip code residents lived in the same house 1 year ago. Out of people who lived in different houses, 45% moved from this county. Out of people who lived in different houses, 50% moved from different county within same state. Out of people who lived in different houses, 7% moved from different state. Out of people who lived in different houses, 3% moved from abroad.
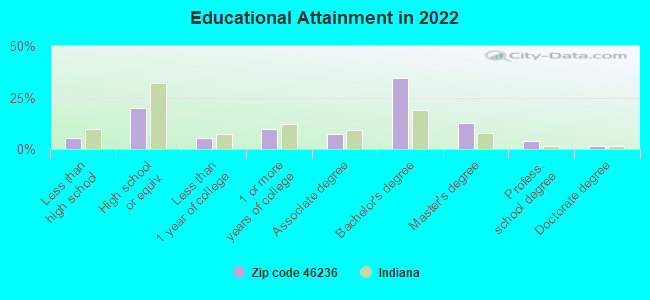
Private vs. public school enrollment:
Students in private schools in grades 1 to 8 (elementary and middle school): 973
Here:
33.3%
Indiana:
14.9%
Students in private schools in grades 9 to 12 (high school): 218
Here:
14.5%
Indiana:
11.4%
Students in private undergraduate colleges: 184
Here:
20.1%
Indiana:
22.3%
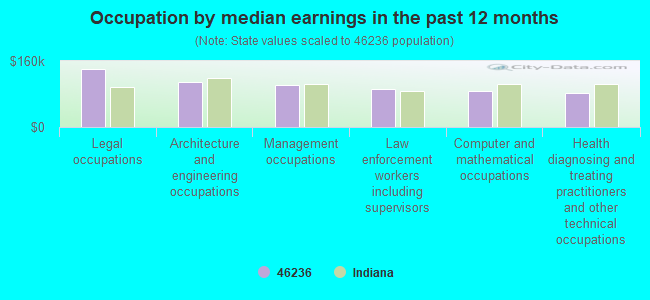
Occupation by median earnings in the past 12 months ($)
141,782Legal occupations
109,732Architecture and engineering occupations
102,414Management occupations
90,965Law enforcement workers including supervisors
87,582Computer and mathematical occupations
82,810Health diagnosing and treating practitioners and other technical occupations
Companies with federal contracts located in this zip code:
CANDENT TECHNOLOGIES INCORPORA (11925 EAST 65TH STREET in INDIANAPOLIS, IN; small business) : $844,323 in 6 contractsfrom 2003 to 2006
Contracts for Other Research and Development -- Engineering Development (R&D), Defense Aircraft -- Applied Research and Exploratory Development (R&D) by Army Signed by year:2000: $0; 2001: $0; 2002: $0; 2003: $68,538; 2004: $399,824; 2005: $298,342; 2006: $77,619.
Biggest contracts:
$351,553 with Army for Other Research and Development -- Engineering Development (R&D). Signed on 2004-11-09. Completion date: 2006-07-09.
$202,148, same as above.Signed on 2005-11-22. Completion date: 2006-07-09.
$96,194, same as above.Signed on 2005-12-21. Completion date: 2006-07-09.
$77,619, same as above.Signed on 2006-01-27. Completion date: 2006-07-09.
M & R ENTERPRISES, INCORPORATE (8359 GLEN HIGHLANDS DR in INDIANAPOLIS, IN; small business) : $490,209 in 10 contractsfrom 2001 to 2006
Contracts for Custodial Janitorial Services, Food Services, Gas Services by Army, Air Force Signed by year:2000: $0; 2001: $34,071; 2002: $99,083; 2003: $37,533; 2004: $234,855; 2005: $0; 2006: $84,667.
Biggest contracts:
$120,900 with Army for Custodial Janitorial Services. Signed on 2004-10-20. Completion date: 2004-09-30.
$113,955 with Air Force for Food Services. Signed on 2004-02-26. Completion date: 2004-09-30.
$99,083 with Army for Custodial Janitorial Services. Signed on 2002-10-25. Completion date: 2003-09-30.
$84,667, same as above.Signed on 2006-02-01. Completion date: 2006-09-30.
NATIONAL BUILDERS CONSTRUCTION (12145 BEARSDALE DR in INDIANAPOLIS, IN; small business) : $186,930 in 12 contractsfrom 2003 to 2006
Contracts for Maintenance, Repair or Alteration of Real Property -- Highways, Roads, Streets, Bridges, and Railways (includes resurfacing), Maintenance, Repair or Alteration of Real Property -- Recreation Facilities (Non-Building), Building Components, Prefabricated, Construction of Structures and Facilities -- Other Non-Building Facilities, and moreby Forest Service, Navy, Air Force, Army, and others Signed by year:2000: $0; 2001: $0; 2002: $0; 2003: $75,000; 2004: $101,930; 2005: $0; 2006: $10,000.
Biggest contracts:
$70,925 with Forest Service for Maintenance, Repair or Alteration of Real Property -- Highways, Roads, Streets, Bridges, and Railways (includes resurfacing). Signed on 2006-05-27. Completion date: 2006-07-10.
$65,600 with Navy for Maintenance, Repair or Alteration of Real Property -- Recreation Facilities (Non-Building). Signed on 2004-02-27. Completion date: 2005-02-28.
$42,000 with Air Force for Building Components, Prefabricated. Signed on 2003-12-08. Completion date: 2004-03-30.
$33,000 with Air Force for Construction of Structures and Facilities -- Other Non-Building Facilities. Taking place in MD. Signed on 2003-09-04. Completion date: 2003-09-29.
Top industries in this zip code by the number of employees in 2005:
2003 - 2018 National Fire Incident Reporting System (NFIRS) incidents
Based on the data from the years 2003 - 2018 the average number of fire incidents per year is 62. The highest number of reported fires - 120 took place in 2005, and the least - 0 in 2014. The data has a declining trend.
When looking into fire subcategories, the most reports belonged to: Structure Fires (67.9%), and Outside Fires (20.0%).
Fire incident types reported to NFIRS in Zip Code 46236


 Nearest zip codes: 46256, 46216, 46235, 46055, 46037, 46038.


 Based on the data from the years 2003 - 2018 the average number of fire incidents per year is 62. The highest number of reported fires - 120 took place in 2005, and the least - 0 in 2014. The data has a declining trend.
 When looking into fire subcategories, the most reports belonged to: Structure Fires (67.9%), and Outside Fires (20.0%).