Estimated zip code population in 2022: 17,868 Zip code population in 2010: 13,859 Zip code population in 2000: 8,279
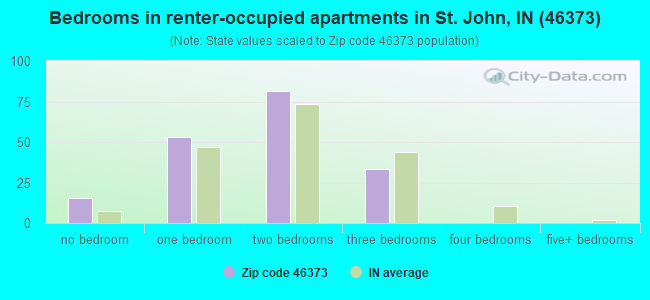
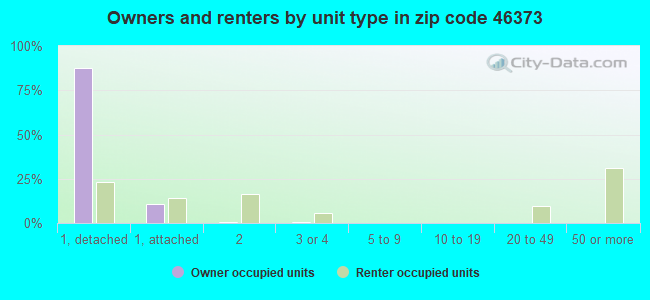
Houses and condos: 6,607 Renter-occupied apartments: 182
% of renters here:
3%
State:
29%
March 2022 cost of living index in zip code 46373: 94.5 (less than average, U.S. average is 100)
Land area: 10.1 sq. mi. Water area: 0.1 sq. mi.
Population density: 1,768 people per square mile
(low).
OSM Map
General Map
Google Map
MSN Map
OSM Map
General Map
Google Map
MSN Map
OSM Map
General Map
Google Map
MSN Map
OSM Map
General Map
Google Map
MSN Map
Please wait while loading the map...
Real estate property taxes paid for housing units in 2022:
This zip code:
0.9% ($3,513)
Indiana:
0.7% ($1,467)
Median real estate property taxes paid for housing units with mortgages in 2022: $3,761 (0.9%) Median real estate property taxes paid for housing units with no mortgage in 2022: $3,234 (1.0%)
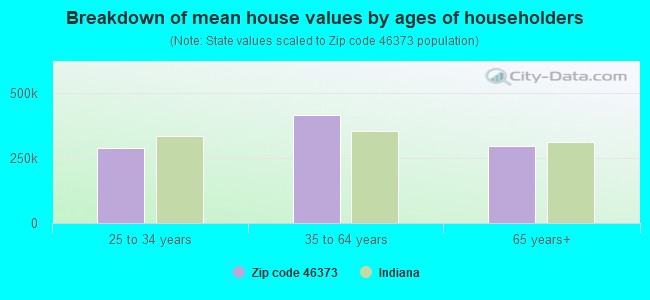
Estimated median house/condo value in 2022: $399,781
46373:
$399,781
Indiana:
$208,700
According to our research of Indiana and other state lists, there was 1 registered sex offender living in 46373 zip code as of April 15, 2024. The ratio of all residents to sex offenders in zip code 46373 is 15,061 to 1. The ratio of registered sex offenders to all residents in this zip code is much lower than the state average.
Median resident age:
This zip code:
45.8 years
Indiana median age:
38.2 years
Average household size:
This zip code:
2.7 people
Indiana:
2.4 people
Averages for the 2020 tax year for zip code 46373, filed in 2021:
Average Adjusted Gross Income (AGI) in 2020: $113,080 (Individual Income Tax Returns)
Here:
$113,080
State:
$64,978
Salary/wage: $94,745 (reported on 78.9% of returns)
Here:
$94,745
State:
$55,245
(% of AGI for various income ranges: 1045.8% for AGIs below $25k, 3081.9% for AGIs $25k-50k, 5541.2% for AGIs $50k-75k, 8389.3% for AGIs $75k-100k, 16186.6% for AGIs $100k-200k, 63351.2% for AGIs over 200k)
Taxable interest for individuals: $1,814 (reported on 43.9% of returns)
This zip code:
$1,814
Indiana:
$1,351
(% of AGI for various income ranges: 32.4% for AGIs below $25k, 52.7% for AGIs $25k-50k, 107.4% for AGIs $50k-75k, 95.9% for AGIs $75k-100k, 120.2% for AGIs $100k-200k, 680.5% for AGIs over 200k)
Ordinary dividends: $5,013 (reported on 33.9% of returns)
Here:
$5,013
State:
$5,827
(% of AGI for various income ranges: 56.5% for AGIs below $25k, 106.9% for AGIs $25k-50k, 187.0% for AGIs $50k-75k, 214.1% for AGIs $75k-100k, 203.4% for AGIs $100k-200k, 1779.3% for AGIs over 200k)
Net capital gain/loss in AGI: +$21,168 (reported on 30.2% of returns)
Here:
+$21,168
State:
+$17,730
(% of AGI for various income ranges: 39.8% for AGIs below $25k, 63.6% for AGIs $25k-50k, 108.2% for AGIs $50k-75k, 163.8% for AGIs $75k-100k, 482.0% for AGIs $100k-200k, 11257.9% for AGIs over 200k)
Profit/loss from business: +$17,575 (reported on 13.4% of returns)
Here:
+$17,575
State:
+$12,144
(% of AGI for various income ranges: 60.4% for AGIs below $25k, 202.2% for AGIs $25k-50k, 200.5% for AGIs $50k-75k, 361.2% for AGIs $75k-100k, 348.8% for AGIs $100k-200k, 2133.8% for AGIs over 200k)
Taxable individual retirement arrangement distribution: $25,688 (reported on 15.1% of returns)
46373:
$25,688
Indiana:
$18,302
(% of AGI for various income ranges: 105.3% for AGIs below $25k, 248.1% for AGIs $25k-50k, 461.9% for AGIs $50k-75k, 589.7% for AGIs $75k-100k, 852.3% for AGIs $100k-200k, 2342.4% for AGIs over 200k)
Self-employed (Keogh) retirement plans: $20,814 (reported on 0.8% of returns)
46373:
$20,814
Indiana:
$27,160
(% of AGI for various income ranges: 25.4% for AGIs $100k-200k, 242.9% for AGIs over 200k)
Total itemized deductions: $33,836 (reported on 15.5% of returns)
Here:
$33,836
State:
$35,601
(% of AGI for various income ranges: 116.2% for AGIs below $25k, 183.0% for AGIs $25k-50k, 375.0% for AGIs $50k-75k, 591.4% for AGIs $75k-100k, 961.5% for AGIs $100k-200k, 5089.0% for AGIs over 200k)
Charity contributions: $12,351 (reported on 13.2% of returns)
Here:
$12,351
State:
$15,596
(% of AGI for various income ranges: 5.3% for AGIs below $25k, 23.7% for AGIs $25k-50k, 41.5% for AGIs $50k-75k, 86.4% for AGIs $75k-100k, 222.0% for AGIs $100k-200k, 2365.5% for AGIs over 200k)
Taxes paid: $8,824 (reported on 15.5% of returns)
46373:
$8,824
State:
$7,542
(% of AGI for various income ranges: 16.1% for AGIs below $25k, 37.0% for AGIs $25k-50k, 111.8% for AGIs $50k-75k, 199.9% for AGIs $75k-100k, 313.4% for AGIs $100k-200k, 1041.0% for AGIs over 200k)
Earned income credit: $1,648 (reported on 4.4% of returns)
Here:
$1,648
State:
$2,298
(% of AGI for various income ranges: 29.1% for AGIs below $25k, 28.0% for AGIs $25k-50k)
Percentage of individuals using paid preparers for their 2020 taxes: 92.9%
Here:
93%
State:
94%
(% for various income ranges: 90.9% for AGIs below $25k, 93.3% for AGIs $25k-50k, 93.3% for AGIs $50k-75k, 94.0% for AGIs $75k-100k, 93.1% for AGIs $100k-200k, 94.6% for AGIs over 200k)
Averages for the 2012 tax year for zip code 46373, filed in 2013:
Average Adjusted Gross Income (AGI) in 2012: $83,616 (Individual Income Tax Returns)
Here:
$83,616
State:
$52,932
Salary/wage: $72,947 (reported on 84.5% of returns)
Here:
$72,947
State:
$45,173
(% of AGI for various income ranges: 71.1% for AGIs below $25k, 66.6% for AGIs $25k-50k, 71.0% for AGIs $50k-75k, 75.9% for AGIs $75k-100k, 83.9% for AGIs $100k-200k, 59.7% for AGIs over 200k)
Taxable interest for individuals: $1,223 (reported on 49.2% of returns)
This zip code:
$1,223
Indiana:
$1,311
(% of AGI for various income ranges: 1.5% for AGIs below $25k, 1.4% for AGIs $25k-50k, 0.8% for AGIs $50k-75k, 0.4% for AGIs $75k-100k, 0.4% for AGIs $100k-200k, 1.0% for AGIs over 200k)
Ordinary dividends: $3,647 (reported on 32.3% of returns)
Here:
$3,647
State:
$4,690
(% of AGI for various income ranges: 2.6% for AGIs below $25k, 2.3% for AGIs $25k-50k, 1.6% for AGIs $50k-75k, 1.1% for AGIs $75k-100k, 0.8% for AGIs $100k-200k, 2.1% for AGIs over 200k)
Net capital gain/loss in AGI: +$6,981 (reported on 21.8% of returns)
Here:
+$6,981
State:
+$10,406
(% of AGI for various income ranges: 0.2% for AGIs $25k-50k, 0.2% for AGIs $50k-75k, 0.4% for AGIs $75k-100k, 0.6% for AGIs $100k-200k, 5.7% for AGIs over 200k)
Profit/loss from business: +$15,767 (reported on 12.1% of returns)
Here:
+$15,767
State:
+$11,105
(% of AGI for various income ranges: 4.1% for AGIs below $25k, 3.5% for AGIs $25k-50k, 2.6% for AGIs $50k-75k, 1.6% for AGIs $75k-100k, 1.6% for AGIs $100k-200k, 3.0% for AGIs over 200k)
Taxable individual retirement arrangement distribution: $18,517 (reported on 14.1% of returns)
46373:
$18,517
Indiana:
$13,841
(% of AGI for various income ranges: 6.3% for AGIs below $25k, 5.0% for AGIs $25k-50k, 4.0% for AGIs $50k-75k, 3.9% for AGIs $75k-100k, 2.7% for AGIs $100k-200k, 2.2% for AGIs over 200k)
Self-employment retirement plans: $23,020 (reported on 0.7% of returns)
46373:
$23,020
Indiana:
$21,482
Total itemized deductions: $23,554 (18% of AGI, reported on 50.5% of returns)
Here:
$23,554
State:
$20,913
Here:
18.2% of AGI
State:
18.2% of AGI
(% of AGI for various income ranges: 13.6% for AGIs below $25k, 14.1% for AGIs $25k-50k, 15.1% for AGIs $50k-75k, 16.5% for AGIs $75k-100k, 14.8% for AGIs $100k-200k, 11.9% for AGIs over 200k)
Charity contributions: $3,985 (reported on 45.3% of returns)
Here:
$3,985
State:
$4,697
(% of AGI for various income ranges: 1.2% for AGIs below $25k, 1.7% for AGIs $25k-50k, 1.7% for AGIs $50k-75k, 2.0% for AGIs $75k-100k, 1.9% for AGIs $100k-200k, 3.0% for AGIs over 200k)
Taxes paid: $9,060 (reported on 50.4% of returns)
46373:
$9,060
State:
$7,456
(% of AGI for various income ranges: 3.0% for AGIs below $25k, 3.9% for AGIs $25k-50k, 5.0% for AGIs $50k-75k, 5.8% for AGIs $75k-100k, 5.9% for AGIs $100k-200k, 5.4% for AGIs over 200k)
Earned income credit: $1,668 (reported on 4.8% of returns)
Here:
$1,668
State:
$2,265
(% of AGI for various income ranges: 1.9% for AGIs below $25k, 0.5% for AGIs $25k-50k)
Percentage of individuals using paid preparers for their 2012 taxes: 61.7%
Here:
62%
State:
53%
(% for various income ranges: 50.2% for AGIs below $25k, 61.5% for AGIs $25k-50k, 66.3% for AGIs $50k-75k, 66.0% for AGIs $75k-100k, 67.0% for AGIs $100k-200k, 75.6% for AGIs over 200k)
Averages for the 2004 tax year for zip code 46373, filed in 2005:
Average Adjusted Gross Income (AGI) in 2004: $67,013 (Individual Income Tax Returns)
Here:
$67,013
State:
$44,790
Salary/wage: $59,760 (reported on 87.2% of returns)
Here:
$59,760
State:
$39,615
(% of AGI for various income ranges: 141.6% for AGIs below $10k, 63.0% for AGIs $10k-25k, 71.6% for AGIs $25k-50k, 81.4% for AGIs $50k-75k, 87.7% for AGIs $75k-100k, 73.4% for AGIs over 100k)
Taxable interest for individuals: $1,245 (reported on 68.6% of returns)
This zip code:
$1,245
Indiana:
$1,535
(% of AGI for various income ranges: 6.5% for AGIs below $10k, 4.0% for AGIs $10k-25k, 2.0% for AGIs $25k-50k, 1.4% for AGIs $50k-75k, 0.7% for AGIs $75k-100k, 1.1% for AGIs over 100k)
Taxable dividends: $1,957 (reported on 36.9% of returns)
Here:
$1,957
State:
$2,998
(% of AGI for various income ranges: 5.0% for AGIs below $10k, 2.6% for AGIs $10k-25k, 2.1% for AGIs $25k-50k, 1.0% for AGIs $50k-75k, 0.5% for AGIs $75k-100k, 1.0% for AGIs over 100k)
Net capital gain/loss: +$5,905 (reported on 27.7% of returns)
Here:
+$5,905
State:
+$8,619
(% of AGI for various income ranges: -4.1% for AGIs below $10k, 0.3% for AGIs $10k-25k, 0.3% for AGIs $25k-50k, 0.6% for AGIs $50k-75k, 0.9% for AGIs $75k-100k, 4.2% for AGIs over 100k)
Profit/loss from business: +$17,092 (reported on 12.5% of returns)
Here:
+$17,092
State:
+$10,071
(% of AGI for various income ranges: 2.9% for AGIs below $10k, 3.9% for AGIs $10k-25k, 3.4% for AGIs $25k-50k, 2.6% for AGIs $50k-75k, 2.5% for AGIs $75k-100k, 3.6% for AGIs over 100k)
IRA payment deduction: $3,292 (reported on 4.7% of returns)
46373:
$3,292
Indiana:
$2,840
(% of AGI for various income ranges: 0.3% for AGIs $10k-25k, 0.4% for AGIs $25k-50k, 0.4% for AGIs $50k-75k, 0.2% for AGIs $75k-100k, 0.2% for AGIs over 100k)
Self-employed pension: $14,000 (reported on 0.9% of returns)
Here:
$14,000
Indiana:
$15,305
Total itemized deductions: $18,693 (18% of AGI, reported on 50.4% of returns)
Here:
$18,693
State:
$17,065
Here:
18.2% of AGI
State:
19.5% of AGI
(% of AGI for various income ranges: 13.7% for AGIs below $10k, 14.3% for AGIs $10k-25k, 13.3% for AGIs $25k-50k, 15.9% for AGIs $50k-75k, 15.0% for AGIs $75k-100k, 13.2% for AGIs over 100k)
Charity contributions deductions: $3,549 (3% of AGI, reported on 47.3% of returns)
Here:
$3,549
State:
$3,550
Here:
3.4% of AGI
State:
3.8% of AGI
(% of AGI for various income ranges: 0.8% for AGIs below $10k, 1.8% for AGIs $10k-25k, 1.9% for AGIs $25k-50k, 2.2% for AGIs $50k-75k, 2.2% for AGIs $75k-100k, 2.9% for AGIs over 100k)
Total tax: $10,816 (reported on 82.7% of returns)
46373:
$10,816
State:
$6,914
(% of AGI for various income ranges: 3.7% for AGIs below $10k, 4.4% for AGIs $10k-25k, 7.8% for AGIs $25k-50k, 8.6% for AGIs $50k-75k, 10.0% for AGIs $75k-100k, 17.7% for AGIs over 100k)
Earned income credit: $1,220 (reported on 3.6% of returns)
Here:
$1,220
State:
$1,685
Percentage of individuals using paid preparers for their 2004 taxes: 60.9%
Here:
61%
State:
59%
(% for various income ranges: 49.5% for AGIs below $10k, 57.6% for AGIs $10k-25k, 61.8% for AGIs $25k-50k, 66.1% for AGIs $50k-75k, 63.0% for AGIs $75k-100k, 67.3% for AGIs over 100k)
Likely homosexual households (counted as self-reported same-sex unmarried-partner households)
Lesbian couples: 0.2% of all households
Gay men: 0.1% of all households
Household received Food Stamps/SNAP in the past 12 months: 34 Household did not receive Food Stamps/SNAP in the past 12 months: 6,608
Women who had a birth in the past 12 months: 124 (123 now married, 9 unmarried) Women who did not have a birth in the past 12 months: 3,497 (1,895 now married, 1,608 unmarried)
Housing units in zip code 46373 with a mortgage: 4,298 (410 second mortgage, 9 home equity loan, 391 both second mortgage and home equity loan) Houses without a mortgage: 446
Median monthly owner costs for units with a mortgage: $2,010 Median monthly owner costs for units without a mortgage: $659
Residents with income below the poverty level in 2022:
This zip code:
2.2%
Whole state:
12.6%
Residents with income below 50% of the poverty level in 2022:
This zip code:
1.2%
Whole state:
6.3%
Median number of rooms in houses and condos:
Here:
6.9
State:
6.6
Median number of rooms in apartments:
Here:
3.5
State:
4.3
Notable locations in this zip code not listed on our city pages
Parks in zip code 46373 include: Prairie West Park (1), Lancer Park (2), Civic Memorial Park (3), James E Larimer Park (4), Timber Lane Park (5), Homestead Acres Park Number 1 (6), Homestead Acres Park Number 2 (7). Display/hide their locations on the map
Tourist attraction (not listed on the city page) : Vallarta My Way (Tours & Charters; 10057 Delmar Street).
In group quarters: 30 (-1 institutionalized population)
Size of family households: 2,364 2-persons, 950 3-persons, 953 4-persons, 905 5-persons, 78 6-persons, 44 7-or-more-persons
Size of nonfamily households: 1,191 1-person, 162 2-persons
2,947 married couples with children.
456 single-parent households (81 men, 375 women).
89.4% of residents of 46373 zip code speak English at home.
4.0% of residents speak Spanish at home (79% very well, 14% well, 7% not well).
5.6% of residents speak other Indo-European language at home (84% very well, 6% well, 8% not well, 2% not at all).
1.0% of residents speak Asian or Pacific Island language at home (80% very well, 20% well).
0.4% of residents speak other language at home (100% very well).
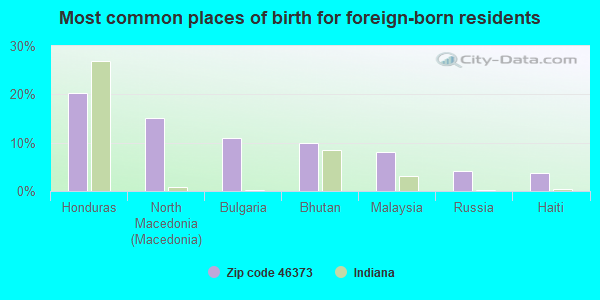
Foreign born population: 1,264 (7.1%) (85.1% of them are naturalized citizens)
This zip code:
7.1%
Whole state:
6.1%
20%Honduras
15%North Macedonia (Macedonia)
11%Bulgaria
10%Bhutan
8%Malaysia
4%Russia
4%Haiti
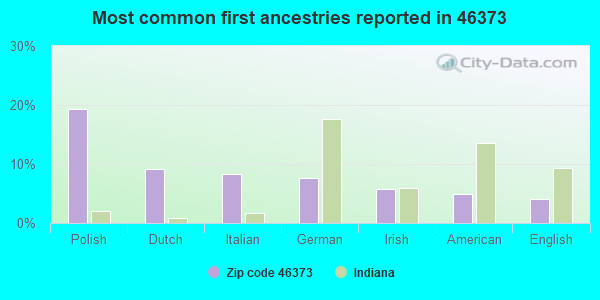
19%Polish
9%Dutch
8%Italian
8%German
6%Irish
5%American
4%English
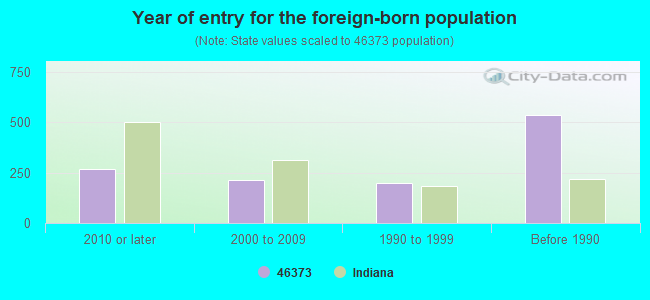
Year of entry for the foreign-born population
2672010 or later
2132000 to 2009
2011990 to 1999
536Before 1990
Facilities with environmental interests located in this zip code:
ANR PIPELINE CO ST JOHNS (10313 WHITE OAK AVE in ST JOHN, IN)
AIR MAJOR (AIRS/AFS) STATE MASTER (Indiana facility tracking) - ACES-OP-08900069, AIR PROGRAM, CRTK-4287, EPCRA, UST-868, UNDERGROUND STORAGE TANK PROGRAM, IN-NPDES-IN0046051, National Pollutant Discharge Elimination System Permit CRITERIA AND HAZARDOUS AIR POLLUTANT INVENTORY (Inventory of air pollution sources) National Pollutant Discharge Elimination System NON-MAJOR (Tracking pollutant discharge elimination systems) - permit Conditionally Exempt Small Quantity Generators, less than 100 kg/month of hazardous waste (Resource Conservation and Recovery Act (tracking hazardous waste)) - notification Business SIC classification: NATURAL GAS TRANSMISSION Organizations: RON L MARSHALL CERT 11525 (CONTACT/OPERATOR)
, COASTAL CORP. ANR PIPELINE CO. (CONTACT/OWNER)
, COASTAL CORP ANR PIPELINE CO (CONTACT/OWNER)
Alternative names: ANR PIPELINE COMPANY, ANR PIPELINE NAT GAS_CO-ST. JOHN STATION
SAINT JOHN AUTO AND HOME CENTER (9571 WICKER AVE in SAINT JOHN, IN)
STATE MASTER (Indiana facility tracking) - LUST-199602500, LEAKING STORAGE TANK, UST-13650, UNDERGROUND STORAGE TANK PROGRAM COMPLIANCE ACTIVITY (Tracking inspections of insecticide, fungicide, and rodenticide, and toxic substances) Alternative names: ST JOHN POOL CENTER
DAVIS ARTHUR E PE (12085 WILDWOOD in SAINT JOHN, IN)
STATE MASTER (Indiana facility tracking) TRANSPORTER (Resource Conservation and Recovery Act (tracking hazardous waste))
PENSKE AUTO CENTER (9550 WICKER in SAINT JOHN, IN)
STATE MASTER (Indiana facility tracking) Conditionally Exempt Small Quantity Generators, less than 100 kg/month of hazardous waste (Resource Conservation and Recovery Act (tracking hazardous waste)) - notification Organizations: PENSKE AUTO CENTER INC (CONTACT/OWNER)
NATIONAL WATER WORKS HDWW 2340 (10830 JOLIET RD in ST JOHN, IN)
Small Quantity Generators, between 100 kg and 1000 kg of hazardous waste/month (Resource Conservation and Recovery Act (tracking hazardous waste)) Organizations: HOME DEPOT USA INC (CONTACT/OPERATOR)
ALSIP NURSERY LEISURE HOME CENTER (10255 WICKER RD in SAINT JOHN, IN)
STATE MASTER (Indiana facility tracking) COMPLIANCE ACTIVITY (Tracking inspections of insecticide, fungicide, and rodenticide, and toxic substances)
Housing units lacking complete plumbing facilities: 0.2% Housing units lacking complete kitchen facilities: 0.2%
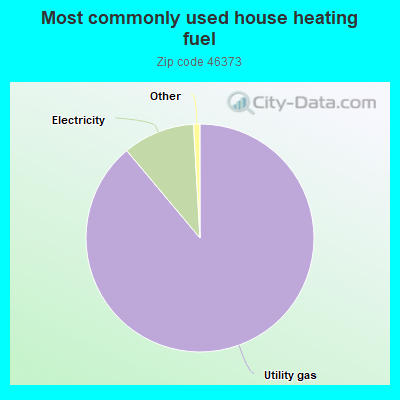
88.9%Utility gas
10.2%Electricity
Population in 1990: 4,786. Population change in the 1990s: +3,493 (+73.0%).
Place of birth for U.S.-born residents:
This state: 8,423
Northeast: 321
Midwest: 7,089
South: 641
West: 195
64% of the 46373 zip code residents lived in the same house 5 years ago. Out of people who lived in different houses, 39% lived in this county. Out of people who lived in different counties, 50% lived in Indiana.
95% of the 46373 zip code residents lived in the same house 1 year ago. Out of people who lived in different houses, 53% moved from this county. Out of people who lived in different houses, 3% moved from different county within same state. Out of people who lived in different houses, 52% moved from different state. Out of people who lived in different houses, 2% moved from abroad.
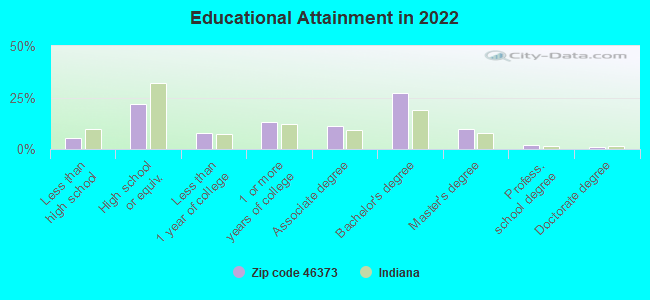
Private vs. public school enrollment:
Students in private schools in grades 1 to 8 (elementary and middle school): 394
Here:
20.5%
Indiana:
14.9%
Students in private schools in grades 9 to 12 (high school): 88
Here:
9.4%
Indiana:
11.4%
Students in private undergraduate colleges: 165
Here:
19.8%
Indiana:
22.3%
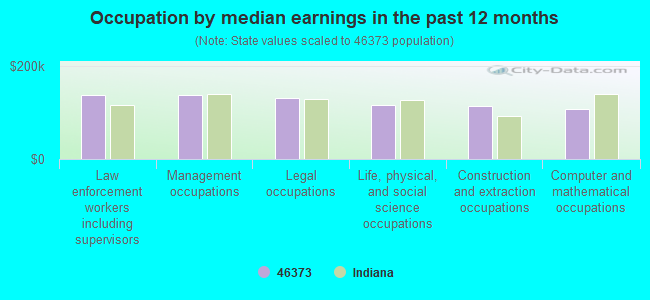
Occupation by median earnings in the past 12 months ($)
137,874Law enforcement workers including supervisors
136,580Management occupations
129,850Legal occupations
116,826Life, physical, and social science occupations
114,037Construction and extraction occupations
108,264Computer and mathematical occupations
Companies with federal contracts located in this zip code:
MIDWEST AEROSPACE LTD (9465 JOLIET ST in SAINT JOHN, IN; small business) : $110,893 in 7 contractsfrom 2004 to 2005
Contracts for Electron Tubes and Associated Hardware, Microcircuits, Electronic, Aircraft Hydraulic, Vacuum, and De-icing System Components, Airframe Structural Components, and moreby Defense Logistics Agency, Navy, Army Signed by year:2000: $0; 2001: $0; 2002: $0; 2003: $0; 2004: $105,510; 2005: $5,383; 2006: $0.
Biggest contracts:
$99,630 with Defense Logistics Agency for Electron Tubes and Associated Hardware. Signed on 2004-02-06. Completion date: 2004-02-06.
$2,940 with Defense Logistics Agency for Microcircuits, Electronic. Signed on 2004-12-13. Completion date: 2005-01-13.
$2,940, same as above.Signed on 2004-12-13. Completion date: 2005-01-13.
$2,420 with Navy for Aircraft Hydraulic, Vacuum, and De-icing System Components. Signed on 2005-04-13. Completion date: 2005-04-20.
Top industries in this zip code by the number of employees in 2005:
Detailed PMIC statistics for the following Tracts:0426.03
, 0426.05
2003 - 2018 National Fire Incident Reporting System (NFIRS) incidents
According to the data from the years 2003 - 2018 the average number of fires per year is 36. The highest number of reported fires - 65 took place in 2010, and the least - 5 in 2014. The data has a dropping trend.
When looking into fire subcategories, the most reports belonged to: Outside Fires (54.3%), and Structure Fires (23.1%).
Fire incident types reported to NFIRS in Zip Code 46373

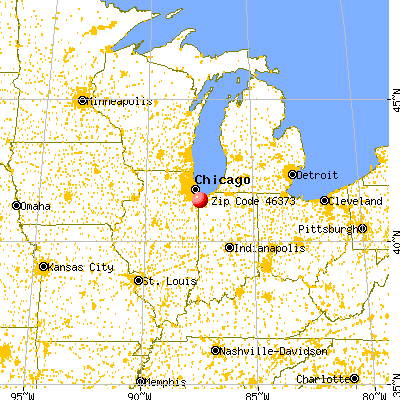


 Nearest zip codes: 46311, 46375, 46303, 46319, 46322, 46321.
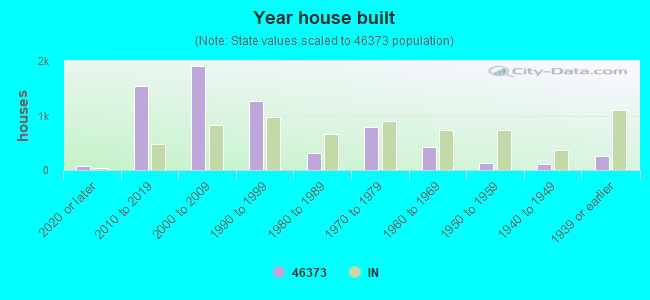


 According to the data from the years 2003 - 2018 the average number of fires per year is 36. The highest number of reported fires - 65 took place in 2010, and the least - 5 in 2014. The data has a dropping trend.
 When looking into fire subcategories, the most reports belonged to: Outside Fires (54.3%), and Structure Fires (23.1%).