Estimated zip code population in 2022: 39,401 Zip code population in 2010: 38,340 Zip code population in 2000: 32,841
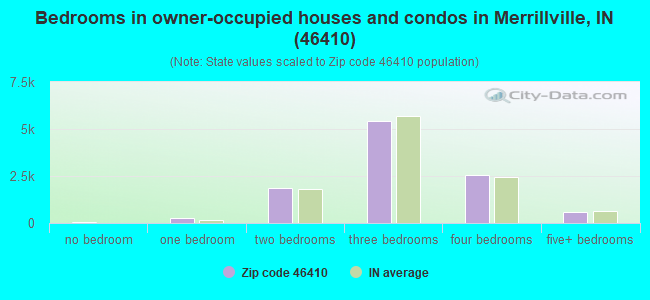
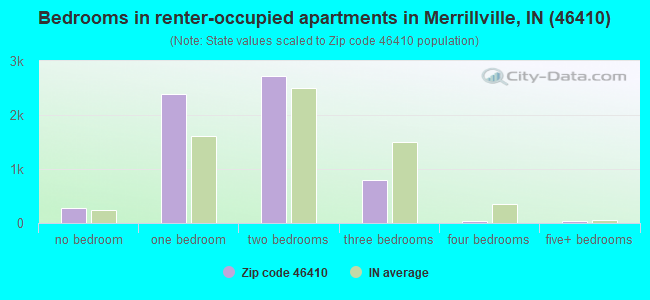
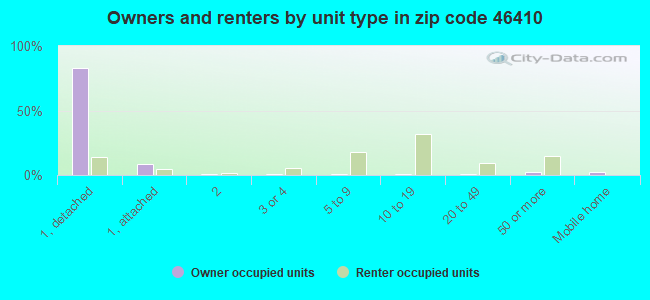
Houses and condos: 17,838 Renter-occupied apartments: 6,229
% of renters here:
37%
State:
29%
March 2022 cost of living index in zip code 46410: 95.7 (near average, U.S. average is 100)
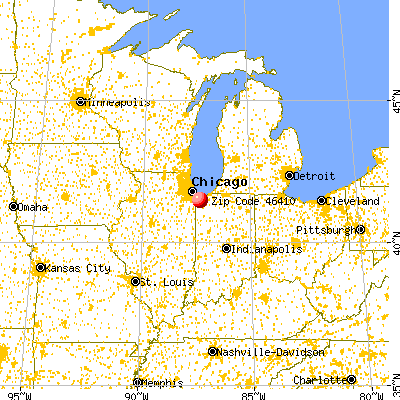
Land area: 29.5 sq. mi. Water area: 0.0 sq. mi.
Population density: 1,335 people per square mile
(low).
OSM Map
General Map
Google Map
MSN Map
OSM Map
General Map
Google Map
MSN Map
OSM Map
General Map
Google Map
MSN Map
OSM Map
General Map
Google Map
MSN Map
Please wait while loading the map...
Real estate property taxes paid for housing units in 2022:
This zip code:
0.9% ($1,768)
Indiana:
0.7% ($1,467)
Median real estate property taxes paid for housing units with mortgages in 2022: $1,810 (0.9%) Median real estate property taxes paid for housing units with no mortgage in 2022: $1,715 (1.0%)
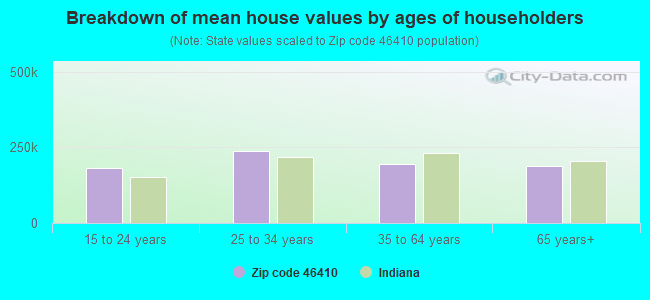
Estimated median house/condo value in 2022: $200,061
46410:
$200,061
Indiana:
$208,700
According to our research of Indiana and other state lists, there were 6 registered sex offenders living in 46410 zip code as of April 24, 2024. The ratio of all residents to sex offenders in zip code 46410 is 6,546 to 1. The ratio of registered sex offenders to all residents in this zip code is much lower than the state average.
Median resident age:
This zip code:
39.2 years
Indiana median age:
38.2 years
Average household size:
This zip code:
2.3 people
Indiana:
2.4 people
Averages for the 2020 tax year for zip code 46410, filed in 2021:
Average Adjusted Gross Income (AGI) in 2020: $48,560 (Individual Income Tax Returns)
Here:
$48,560
State:
$64,978
Salary/wage: $45,319 (reported on 81.8% of returns)
Here:
$45,319
State:
$55,245
(% of AGI for various income ranges: 1079.0% for AGIs below $25k, 3560.0% for AGIs $25k-50k, 6619.1% for AGIs $50k-75k, 9979.5% for AGIs $75k-100k, 16077.6% for AGIs $100k-200k, 80630.0% for AGIs over 200k)
Taxable interest for individuals: $795 (reported on 15.4% of returns)
This zip code:
$795
Indiana:
$1,351
(% of AGI for various income ranges: 7.1% for AGIs below $25k, 8.0% for AGIs $25k-50k, 15.8% for AGIs $50k-75k, 38.0% for AGIs $75k-100k, 38.0% for AGIs $100k-200k, 672.0% for AGIs over 200k)
Ordinary dividends: $3,514 (reported on 7.9% of returns)
Here:
$3,514
State:
$5,827
(% of AGI for various income ranges: 10.2% for AGIs below $25k, 13.5% for AGIs $25k-50k, 32.2% for AGIs $50k-75k, 51.2% for AGIs $75k-100k, 118.8% for AGIs $100k-200k, 2950.0% for AGIs over 200k)
Net capital gain/loss in AGI: +$6,736 (reported on 6.9% of returns)
Here:
+$6,736
State:
+$17,730
(% of AGI for various income ranges: 3.4% for AGIs below $25k, 9.6% for AGIs $25k-50k, 24.5% for AGIs $50k-75k, 43.5% for AGIs $75k-100k, 198.7% for AGIs $100k-200k, 10038.0% for AGIs over 200k)
Profit/loss from business: +$4,483 (reported on 14.2% of returns)
Here:
+$4,483
State:
+$12,144
(% of AGI for various income ranges: 59.1% for AGIs below $25k, 26.8% for AGIs $25k-50k, 38.7% for AGIs $50k-75k, 50.5% for AGIs $75k-100k, 203.6% for AGIs $100k-200k, 8020.0% for AGIs over 200k)
Taxable individual retirement arrangement distribution: $14,348 (reported on 6.2% of returns)
46410:
$14,348
Indiana:
$18,302
(% of AGI for various income ranges: 32.5% for AGIs below $25k, 50.6% for AGIs $25k-50k, 134.2% for AGIs $50k-75k, 214.9% for AGIs $75k-100k, 442.6% for AGIs $100k-200k, 4956.0% for AGIs over 200k)
Total itemized deductions: $27,925 (reported on 6.1% of returns)
Here:
$27,925
State:
$35,601
(% of AGI for various income ranges: 27.3% for AGIs below $25k, 90.1% for AGIs $25k-50k, 327.9% for AGIs $50k-75k, 519.4% for AGIs $75k-100k, 846.2% for AGIs $100k-200k, 7332.0% for AGIs over 200k)
Charity contributions: $10,046 (reported on 4.9% of returns)
Here:
$10,046
State:
$15,596
(% of AGI for various income ranges: 4.1% for AGIs below $25k, 20.5% for AGIs $25k-50k, 86.7% for AGIs $50k-75k, 137.7% for AGIs $75k-100k, 267.8% for AGIs $100k-200k, 3468.0% for AGIs over 200k)
Taxes paid: $6,292 (reported on 6.1% of returns)
46410:
$6,292
State:
$7,542
(% of AGI for various income ranges: 3.2% for AGIs below $25k, 15.0% for AGIs $25k-50k, 66.9% for AGIs $50k-75k, 133.0% for AGIs $75k-100k, 240.5% for AGIs $100k-200k, 1254.0% for AGIs over 200k)
Earned income credit: $2,416 (reported on 20.2% of returns)
Here:
$2,416
State:
$2,298
(% of AGI for various income ranges: 111.3% for AGIs below $25k, 72.4% for AGIs $25k-50k, 0.8% for AGIs $50k-75k)
Percentage of individuals using paid preparers for their 2020 taxes: 92.7%
Here:
93%
State:
94%
(% for various income ranges: 93.1% for AGIs below $25k, 93.1% for AGIs $25k-50k, 92.3% for AGIs $50k-75k, 91.9% for AGIs $75k-100k, 91.4% for AGIs $100k-200k, 94.4% for AGIs over 200k)
Averages for the 2012 tax year for zip code 46410, filed in 2013:
Average Adjusted Gross Income (AGI) in 2012: $44,444 (Individual Income Tax Returns)
Here:
$44,444
State:
$52,932
Salary/wage: $42,788 (reported on 82.9% of returns)
Here:
$42,788
State:
$45,173
(% of AGI for various income ranges: 69.5% for AGIs below $25k, 80.3% for AGIs $25k-50k, 83.2% for AGIs $50k-75k, 84.3% for AGIs $75k-100k, 83.5% for AGIs $100k-200k, 51.3% for AGIs over 200k)
Taxable interest for individuals: $907 (reported on 20.3% of returns)
This zip code:
$907
Indiana:
$1,311
(% of AGI for various income ranges: 0.8% for AGIs below $25k, 0.3% for AGIs $25k-50k, 0.2% for AGIs $50k-75k, 0.2% for AGIs $75k-100k, 0.3% for AGIs $100k-200k, 1.9% for AGIs over 200k)
Ordinary dividends: $2,901 (reported on 10.5% of returns)
Here:
$2,901
State:
$4,690
(% of AGI for various income ranges: 1.0% for AGIs below $25k, 0.6% for AGIs $25k-50k, 0.5% for AGIs $50k-75k, 0.4% for AGIs $75k-100k, 0.5% for AGIs $100k-200k, 3.5% for AGIs over 200k)
Net capital gain/loss in AGI: +$5,342 (reported on 6.8% of returns)
Here:
+$5,342
State:
+$10,406
(% of AGI for various income ranges: 0.1% for AGIs $50k-75k, 0.1% for AGIs $75k-100k, 0.6% for AGIs $100k-200k, 12.9% for AGIs over 200k)
Profit/loss from business: +$7,048 (reported on 12.2% of returns)
Here:
+$7,048
State:
+$11,105
(% of AGI for various income ranges: 7.9% for AGIs below $25k, 1.2% for AGIs $25k-50k, 1.2% for AGIs $50k-75k, 0.7% for AGIs $75k-100k, 1.2% for AGIs $100k-200k, 2.8% for AGIs over 200k)
Taxable individual retirement arrangement distribution: $11,729 (reported on 8.2% of returns)
46410:
$11,729
Indiana:
$13,841
(% of AGI for various income ranges: 2.5% for AGIs below $25k, 1.8% for AGIs $25k-50k, 1.9% for AGIs $50k-75k, 2.2% for AGIs $75k-100k, 2.2% for AGIs $100k-200k, 3.9% for AGIs over 200k)
Total itemized deductions: $17,605 (23% of AGI, reported on 29.0% of returns)
Here:
$17,605
State:
$20,913
Here:
23.1% of AGI
State:
18.2% of AGI
(% of AGI for various income ranges: 7.9% for AGIs below $25k, 10.4% for AGIs $25k-50k, 12.4% for AGIs $50k-75k, 12.5% for AGIs $75k-100k, 12.6% for AGIs $100k-200k, 11.3% for AGIs over 200k)
Charity contributions: $4,163 (reported on 22.8% of returns)
Here:
$4,163
State:
$4,697
(% of AGI for various income ranges: 0.8% for AGIs below $25k, 1.6% for AGIs $25k-50k, 2.2% for AGIs $50k-75k, 2.3% for AGIs $75k-100k, 2.5% for AGIs $100k-200k, 4.5% for AGIs over 200k)
Taxes paid: $4,962 (reported on 28.8% of returns)
46410:
$4,962
State:
$7,456
(% of AGI for various income ranges: 1.4% for AGIs below $25k, 2.3% for AGIs $25k-50k, 3.2% for AGIs $50k-75k, 3.8% for AGIs $75k-100k, 4.2% for AGIs $100k-200k, 4.8% for AGIs over 200k)
Earned income credit: $2,411 (reported on 21.9% of returns)
Here:
$2,411
State:
$2,265
(% of AGI for various income ranges: 8.5% for AGIs below $25k, 1.2% for AGIs $25k-50k)
Percentage of individuals using paid preparers for their 2012 taxes: 53.8%
Here:
54%
State:
53%
(% for various income ranges: 48.4% for AGIs below $25k, 52.5% for AGIs $25k-50k, 58.9% for AGIs $50k-75k, 60.6% for AGIs $75k-100k, 64.7% for AGIs $100k-200k, 81.8% for AGIs over 200k)
Averages for the 2004 tax year for zip code 46410, filed in 2005:
Average Adjusted Gross Income (AGI) in 2004: $41,298 (Individual Income Tax Returns)
Here:
$41,298
State:
$44,790
Salary/wage: $38,406 (reported on 85.5% of returns)
Here:
$38,406
State:
$39,615
(% of AGI for various income ranges: 87.8% for AGIs below $10k, 73.4% for AGIs $10k-25k, 83.7% for AGIs $25k-50k, 86.2% for AGIs $50k-75k, 88.0% for AGIs $75k-100k, 62.5% for AGIs over 100k)
Taxable interest for individuals: $1,383 (reported on 37.7% of returns)
This zip code:
$1,383
Indiana:
$1,535
(% of AGI for various income ranges: 5.4% for AGIs below $10k, 2.2% for AGIs $10k-25k, 1.1% for AGIs $25k-50k, 0.7% for AGIs $50k-75k, 0.5% for AGIs $75k-100k, 1.9% for AGIs over 100k)
Taxable dividends: $1,846 (reported on 16.6% of returns)
Here:
$1,846
State:
$2,998
(% of AGI for various income ranges: 2.9% for AGIs below $10k, 1.3% for AGIs $10k-25k, 0.8% for AGIs $25k-50k, 0.5% for AGIs $50k-75k, 0.3% for AGIs $75k-100k, 0.8% for AGIs over 100k)
Net capital gain/loss: +$2,118 (reported on 11.3% of returns)
Here:
+$2,118
State:
+$8,619
(% of AGI for various income ranges: -0.9% for AGIs below $10k, 0.1% for AGIs $10k-25k, 0.3% for AGIs $25k-50k, 0.3% for AGIs $50k-75k, 0.6% for AGIs $75k-100k, 1.5% for AGIs over 100k)
Profit/loss from business: +$8,755 (reported on 10.0% of returns)
Here:
+$8,755
State:
+$10,071
(% of AGI for various income ranges: 8.6% for AGIs below $10k, 3.7% for AGIs $10k-25k, 1.3% for AGIs $25k-50k, 1.1% for AGIs $50k-75k, 1.0% for AGIs $75k-100k, 3.9% for AGIs over 100k)
IRA payment deduction: $2,640 (reported on 1.6% of returns)
46410:
$2,640
Indiana:
$2,840
(% of AGI for various income ranges: 0.2% for AGIs below $10k, 0.1% for AGIs $10k-25k, 0.1% for AGIs $25k-50k, 0.1% for AGIs $50k-75k, 0.1% for AGIs $75k-100k, 0.1% for AGIs over 100k)
Self-employed pension: $12,897 (reported on 0.2% of returns)
Here:
$12,897
Indiana:
$15,305
Total itemized deductions: $15,301 (23% of AGI, reported on 30.6% of returns)
Here:
$15,301
State:
$17,065
Here:
22.8% of AGI
State:
19.5% of AGI
(% of AGI for various income ranges: 8.3% for AGIs below $10k, 7.7% for AGIs $10k-25k, 11.0% for AGIs $25k-50k, 12.7% for AGIs $50k-75k, 12.7% for AGIs $75k-100k, 11.0% for AGIs over 100k)
Charity contributions deductions: $3,320 (5% of AGI, reported on 26.6% of returns)
Here:
$3,320
State:
$3,550
Here:
4.8% of AGI
State:
3.8% of AGI
(% of AGI for various income ranges: 0.5% for AGIs below $10k, 1.0% for AGIs $10k-25k, 1.9% for AGIs $25k-50k, 2.4% for AGIs $50k-75k, 2.6% for AGIs $75k-100k, 2.3% for AGIs over 100k)
Total tax: $5,342 (reported on 73.1% of returns)
46410:
$5,342
State:
$6,914
(% of AGI for various income ranges: 2.6% for AGIs below $10k, 3.5% for AGIs $10k-25k, 6.6% for AGIs $25k-50k, 9.2% for AGIs $50k-75k, 10.7% for AGIs $75k-100k, 15.0% for AGIs over 100k)
Earned income credit: $1,807 (reported on 16.7% of returns)
Here:
$1,807
State:
$1,685
Percentage of individuals using paid preparers for their 2004 taxes: 60.9%
Here:
61%
State:
59%
(% for various income ranges: 52.4% for AGIs below $10k, 62.4% for AGIs $10k-25k, 61.8% for AGIs $25k-50k, 64.0% for AGIs $50k-75k, 62.9% for AGIs $75k-100k, 68.0% for AGIs over 100k)
Likely homosexual households (counted as self-reported same-sex unmarried-partner households)
Lesbian couples: 0.1% of all households
Gay men: 0.1% of all households
Household received Food Stamps/SNAP in the past 12 months: 2,098 Household did not receive Food Stamps/SNAP in the past 12 months: 14,947
Women who had a birth in the past 12 months: 537 (330 now married, 197 unmarried) Women who did not have a birth in the past 12 months: 8,448 (2,659 now married, 5,771 unmarried)
Housing units in zip code 46410 with a mortgage: 7,685 (571 second mortgage, 21 home equity loan, 391 both second mortgage and home equity loan) Houses without a mortgage: 142
Median monthly owner costs for units with a mortgage: $1,314 Median monthly owner costs for units without a mortgage: $503
Residents with income below the poverty level in 2022:
This zip code:
15.5%
Whole state:
12.6%
Residents with income below 50% of the poverty level in 2022:
This zip code:
6.6%
Whole state:
6.3%
Median number of rooms in houses and condos:
Here:
6.3
State:
6.6
Median number of rooms in apartments:
Here:
3.7
State:
4.3
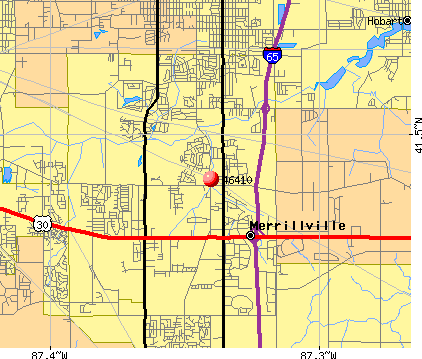
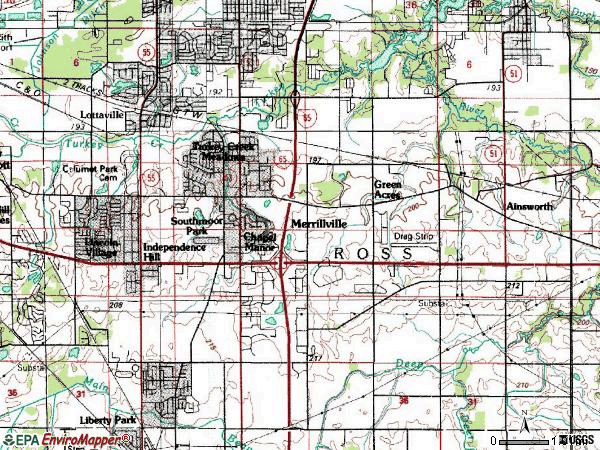
Notable locations in this zip code not listed on our city pages
Notable locations in zip code 46410: Salvatorian Fathers Monastery (A), Broadway Center (B), Turkey Creek Golf Course (C), Innsbrook Country Club (D), Turkey Creek Country Club (E), Ross Township Fire Service Station 5 (F), Southlake Center for Mental Health (G), Ross Township Fire Service Station 1 (H), Hobart Fire Department Station 4 (I), Ross Township Fire Service Station 2 (J), Ross Township Fire Service Station 4 (K). Display/hide their locations on the map
Churches in zip code 46410 include: Saint Stephen Martyr Church (A), Salvatorian Fathers Monastery (B), Descent of the Holy Ghost Church (C), Saint Michaels Byzantine Church (D), Saint Clement Church (E), Saint Elijah Serbian Church (F), Our Lady of Consolation Church (G), Trinity Free Methodist Church (H), Deep River Church of Christ (I). Display/hide their locations on the map
Cemeteries: Chester Cemetery (1), Merrillville Cemetery (2), Calumet Park Cemetery (3), Saints Peter and Paul Cemetery (4). Display/hide their locations on the map
Parks in zip code 46410 include: Oak Ridge Prairie County Park (1), Hidden Lake Park (2), Forest Hill Park (3), Tahoe Park (4), Independence Park (5), Rosenbaum Park (6). Display/hide their locations on the map
4,159 married couples with children.
3,384 single-parent households (790 men, 2,594 women).
87.5% of residents of 46410 zip code speak English at home.
8.3% of residents speak Spanish at home (87% very well, 8% well, 4% not well, 2% not at all).
3.1% of residents speak other Indo-European language at home (82% very well, 6% well, 11% not well).
0.6% of residents speak Asian or Pacific Island language at home (52% very well, 48% well).
1.0% of residents speak other language at home (82% very well, 18% not well).
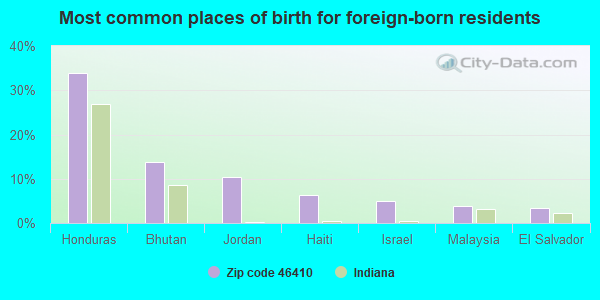
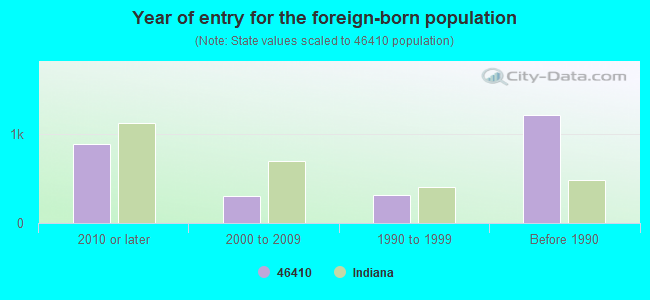
Foreign born population: 2,589 (6.6%) (53.1% of them are naturalized citizens)
Major facilities with environmental interests located in this zip code:
SCHEPEL CADILLAC-HUMMER INC (2929 W LINCOLN HWY in MERRILLVILLE, IN)
AIR MINOR (AIRS/AFS) (Integrated Compliance Information System) - ICIS-05-1994-0308, FORMAL ENFORCEMENT ACTION STATE MASTER (Indiana facility tracking) - CRTK-10047, EPCRA, UST-10512, UNDERGROUND STORAGE TANK PROGRAM Conditionally Exempt Small Quantity Generators, less than 100 kg/month of hazardous waste (Resource Conservation and Recovery Act (tracking hazardous waste)) Business SIC classification: MOTOR VEHICLE DEALERS (NEW AND USED) Organizations: RICHARD SCHEPEL (CONTACT/OPERATOR)
, OLSEN BRUCE L (CONTACT/OWNER)
Alternative names: OLSEN CADILLAC
SCHEPEL BUICK GMC TRUCK (3209 WEST LINCOLN HIGHWAY in MERRILLVILLE, IN)
AIR MINOR (AIRS/AFS) (Integrated Compliance Information System) - ICIS-05-1994-0459, FORMAL ENFORCEMENT ACTION STATE MASTER (Indiana facility tracking) - ACES-OP-08900419, AIR PROGRAM, CRTK-746, EPCRA, UST-524, UNDERGROUND STORAGE TANK PROGRAM Small Quantity Generators, between 100 kg and 1000 kg of hazardous waste/month (Resource Conservation and Recovery Act (tracking hazardous waste)) - notification Business SIC classification: MOTOR VEHICLE DEALERS (NEW AND USED) Organizations: SCHEPEL RICHARD (CONTACT/OWNER)
COSTAL GAS (6101 BROADWAY in MERRILLVILLE, IN)
(Integrated Compliance Information System) - ICIS-05-2003-7008, FORMAL ENFORCEMENT ACTION STATE MASTER (Indiana facility tracking) - CRTK-6702, EPCRA, LUST-199403525, LEAKING STORAGE TANK, UST-9858, UNDERGROUND STORAGE TANK PROGRAM National Pollutant Discharge Elimination System NON-MAJOR (Tracking pollutant discharge elimination systems) - permit Business SIC classification: GASOLINE SERVICE STATIONS Organizations: DAN FASBINDER CERT #17481 (CONTACT/OPERATOR)
, MR JIM ZAYED OWNER (CONTACT/OWNER)
Alternative names: COASTAL SERVICE STATION, COSTAL GAS (JMZ AND SONS INC), JMZ & SONS, INC.
CHECKER (398 W 73RD ST in MERRILLVILLE, IN)
STATE MASTER (Indiana facility tracking) - CRTK-5566, EPCRA, LUST-199109516, LEAKING STORAGE TANK, UST-3522, UNDERGROUND STORAGE TANK PROGRAM National Pollutant Discharge Elimination System NON-MAJOR (Tracking pollutant discharge elimination systems) - permit (Resource Conservation and Recovery Act (tracking hazardous waste)) Business SIC classification: GASOLINE SERVICE STATIONS Organizations: CERTIFIED OPERATOR (CONTACT/OPERATOR)
, MR KEVIN LEPAK (CONTACT/OWNER)
, EMRO MARKETING (CONTACT/OWNER)
Alternative names: EMRO MARKETING 7553, SPEEDWAY STATION #7553
PIERCE MIDDLE SCHOOL (199 E 70TH PLACE in MERRILLVILLE, IN)
(Geographic Names Information System) STATE MASTER (Indiana facility tracking) - UST-12424, UNDERGROUND STORAGE TANK PROGRAM (National Center for Education Statistics) - STATE ID-3811 Organizations: MERRILLVILLE COMMUNITY SCHOOL (SCHOOL DISTRICT)
CENTURY MALL (8203 BROADWAY in MERRILLVILLE, IN)
STATE MASTER (Indiana facility tracking) - LUST-199002545, LEAKING STORAGE TANK, LUST-199006510, LUST-199406529, UST-5904, UNDERGROUND STORAGE TANK PROGRAM (Resource Conservation and Recovery Act (tracking hazardous waste)) Organizations: SIMON DEBARTOLO GROUP LP (CONTACT/OWNER)
, MONTGOMERY WARD CO INC (CONTACT/OWNER)
Alternative names: MONTGOMERY WARD CO, MONTGOMERY WARD AUTO EXPRESS
ADVANCED GRAPHITE INLAND STEEL (3493 E 83RD PL in MERRILLVILLE, IN)
AIR MINOR (AIRS/AFS) STATE MASTER (Indiana facility tracking) - ACES-CP-08900031, AIR PROGRAM, CRTK-19481, EPCRA (Resource Conservation and Recovery Act (tracking hazardous waste)) Business SIC classification: STEEL WORKS, BLAST FURNACES (INCLUDING COKE OVENS), AND ROLLING MILLS Organizations: HALFMAN FRANK AND ROBERT (CONTACT/OWNER)
MR TRANSMISSION (5730 BROADWAY in MERRILLVILLE, IN)
STATE MASTER (Indiana facility tracking) - UST-11132, UNDERGROUND STORAGE TANK PROGRAM (Resource Conservation and Recovery Act (tracking hazardous waste)) Organizations: MAKO JIM (CONTACT/OWNER)
Alternative names: SOUTHLAKE AUTO INC
AMOCO PIPELINE CO (8760 LOUISIANA ST in MERRILLVILLE, IN)
STATE MASTER (Indiana facility tracking) - CRTK-10702, EPCRA, UST-915, UNDERGROUND STORAGE TANK PROGRAM (Resource Conservation and Recovery Act (tracking hazardous waste)) Organizations: AMOCO PIPELINE COMPANY (CONTACT/OWNER)
Alternative names: AMOCO PIPE LINE CHICAGO OPERATING AREA
ANDREAN HIGH SCHOOL (5959 BROADWAY in MERRILLVILLE, IN)
STATE MASTER (Indiana facility tracking) - UST-17649, UNDERGROUND STORAGE TANK PROGRAM, UST-21065, (Resource Conservation and Recovery Act (tracking hazardous waste)) Organizations: PAUL QUANZ (CONTACT/OPERATOR)
, DIOCESE OF GARY (CONTACT/OWNER)
CLASSIC OLDSMOBILE INC (6501 BROADWAY in MERRILLVILLE, IN)
STATE MASTER (Indiana facility tracking) - CRTK-9963, EPCRA, LUST-199301533, LEAKING STORAGE TANK, LUST-199901552, UST-10253, UNDERGROUND STORAGE TANK PROGRAM (Resource Conservation and Recovery Act (tracking hazardous waste)) Organizations: MOSKOWITZ STEVEN L (CONTACT/OWNER)
SHELL OIL CO (721 E LINCOLN HWY E 81ST in MERRILLVILLE, IN)
SHAVER MOTORS INC (1550 E 61ST AVE in MERRILLVILLE, IN)
STATE MASTER (Indiana facility tracking) - UST-375, UNDERGROUND STORAGE TANK PROGRAM, LUST-199003511, LEAKING STORAGE TANK Small Quantity Generators, between 100 kg and 1000 kg of hazardous waste/month (Resource Conservation and Recovery Act (tracking hazardous waste)) - notification Organizations: SHAVER RONALD C (CONTACT/OWNER)
, MIKE ANDERSON CHEVROLET (CONTACT/OWNER)
Housing units lacking complete plumbing facilities: 0.5% Housing units lacking complete kitchen facilities: 1.8%
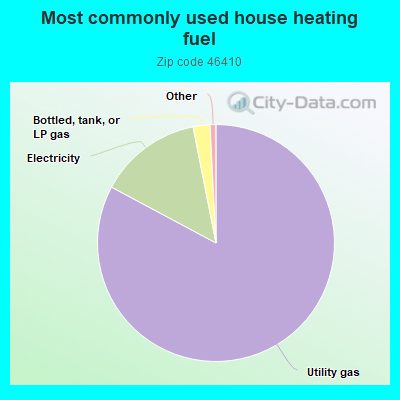
82.9%Utility gas
14.1%Electricity
2.3%Bottled, tank, or LP gas
Population in 1990: 30,765. Population change in the 1990s: +2,076 (+6.7%).
Place of birth for U.S.-born residents:
This state: 21,158
Northeast: 660
Midwest: 10,881
South: 3,267
West: 737
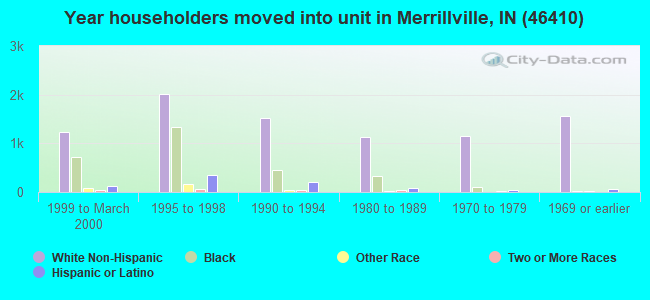
59% of the 46410 zip code residents lived in the same house 5 years ago. Out of people who lived in different houses, 71% lived in this county. Out of people who lived in different counties, 50% lived in Indiana.
90% of the 46410 zip code residents lived in the same house 1 year ago. Out of people who lived in different houses, 68% moved from this county. Out of people who lived in different houses, 5% moved from different county within same state. Out of people who lived in different houses, 22% moved from different state. Out of people who lived in different houses, 5% moved from abroad.
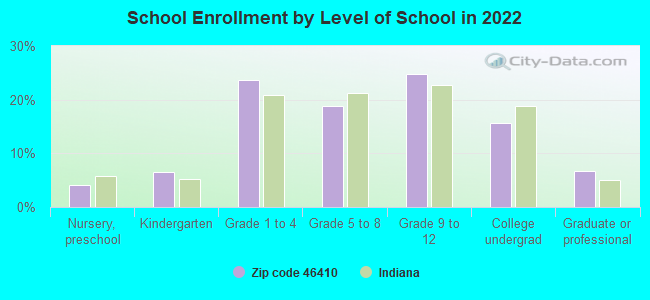
Private vs. public school enrollment:
Students in private schools in grades 1 to 8 (elementary and middle school): 158
Here:
4.3%
Indiana:
14.9%
Students in private schools in grades 9 to 12 (high school): 199
Here:
9.3%
Indiana:
11.4%
Students in private undergraduate colleges: 126
Here:
9.4%
Indiana:
22.3%
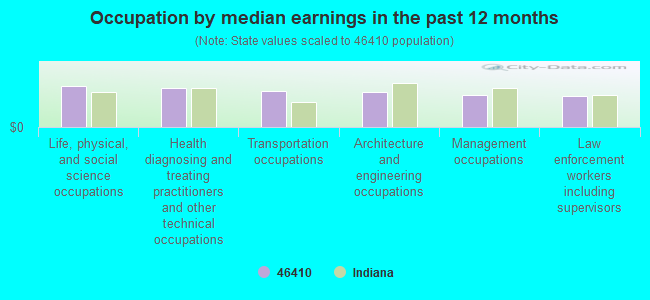
Occupation by median earnings in the past 12 months ($)
96,651Life, physical, and social science occupations
93,593Health diagnosing and treating practitioners and other technical occupations
85,210Transportation occupations
82,463Architecture and engineering occupations
76,324Management occupations
73,171Law enforcement workers including supervisors
Companies with federal contracts located in this zip code (MERRILLVILLE, IN):
CIMCOR, INC (8252 VIRGINIA AVE; small business)
$1,622,240 with Army for ADP Central Processing Unit (CPU, Computer), Analog. Taking place in AZ. Signed on 2004-09-28. Completion date: 2005-09-29.
ALLIANCE GROUP TECHNOLOGIES CO (8252 VIRGINIA ST; small business) : $26,396 in 2 contractsin 2005
$17,275 with Navy for Electrical and Electronic assemblies, Boards, Cards, and Associated Hardware. Signed on 2005-11-14. Completion date: 2005-12-22.
$9,121 with Navy for Electronic Modules. Signed on 2005-05-11. Completion date: 2005-05-20.
WHITECO INDUSTRIES INC (800 E 81ST AVE) : $20,178 in 2 contractsin 2006
$10,089 with Army for Lodging - Hotel/Motel. Signed on 2006-03-24. Completion date: 2006-04-09.
$10,089, same as above.Signed on 2006-05-25. Completion date: 2006-06-03.
KTH SALES, INC (8574 LOUISIANA PLACE; small business) : $5,074 in 2 contractsin 2004
$2,537 with U.S. Army Corps of Engineers - civil program financing only for Miscellaneous Special Industry Machinery. Taking place in MT. Signed on 2004-07-19. Completion date: 2004-08-19.
$2,537 with Army for Miscellaneous Special Industry Machinery. Taking place in MT. Signed on 2004-07-19. Completion date: 2004-08-19.
CORINTHIAN SCHOOLS, INC (707 E 80TH PL STE 200)
$4,500 with Army for Educational Services. Signed on 2005-02-08. Completion date: 2005-01-01.
MERRILLVILLE BEAUTY COLLEGE IN (48 W 67TH PL; small business)
$3,683 with Army for Educational Services. Signed on 2005-07-28. Completion date: 2005-07-01.
Top industries in this zip code by the number of employees in 2005:
2004 - 2018 National Fire Incident Reporting System (NFIRS) incidents
According to the data from the years 2004 - 2018 the average number of fires per year is 131. The highest number of reported fires - 164 took place in 2005, and the least - 30 in 2014. The data has a growing trend.
When looking into fire subcategories, the most reports belonged to: Structure Fires (47.7%), and Outside Fires (28.3%).
Fire incident types reported to NFIRS in Zip Code 46410


 Nearest zip codes: 46409, 46408, 46307, 46342, 46407, 46319.


 According to the data from the years 2004 - 2018 the average number of fires per year is 131. The highest number of reported fires - 164 took place in 2005, and the least - 30 in 2014. The data has a growing trend.
 When looking into fire subcategories, the most reports belonged to: Structure Fires (47.7%), and Outside Fires (28.3%).