Estimated zip code population in 2022: 2,519 Zip code population in 2010: 2,298 Zip code population in 2000: 2,252
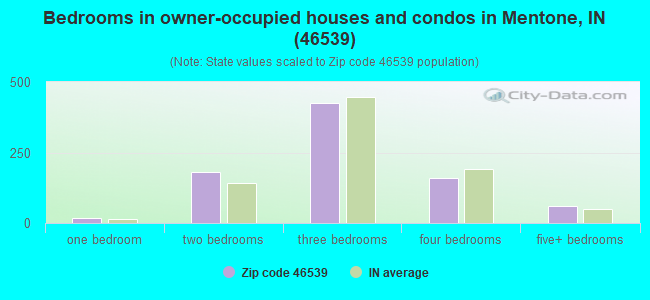
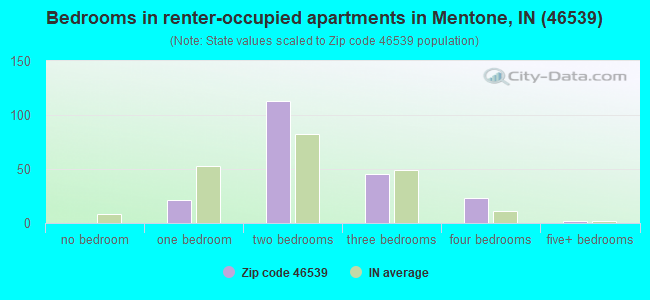
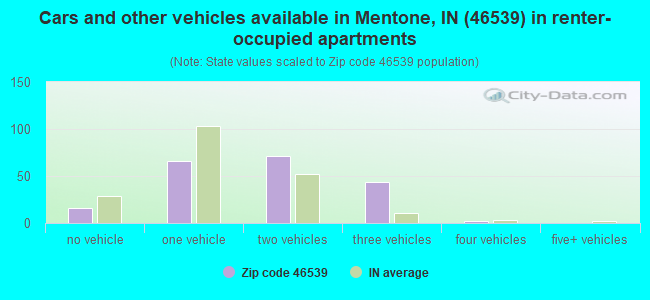
Houses and condos: 1,102 Renter-occupied apartments: 204
% of renters here:
20%
State:
29%
March 2022 cost of living index in zip code 46539: 85.0 (less than average, U.S. average is 100)
Land area: 32.0 sq. mi. Water area: 0.5 sq. mi.
Population density: 79 people per square mile
(very low).
OSM Map
General Map
Google Map
MSN Map
OSM Map
General Map
Google Map
MSN Map
OSM Map
General Map
Google Map
MSN Map
OSM Map
General Map
Google Map
MSN Map
Please wait while loading the map...
Real estate property taxes paid for housing units in 2022:
This zip code:
0.5% ($841)
Indiana:
0.7% ($1,467)
Median real estate property taxes paid for housing units with mortgages in 2022: $759 (0.5%) Median real estate property taxes paid for housing units with no mortgage in 2022: $997 (0.6%)
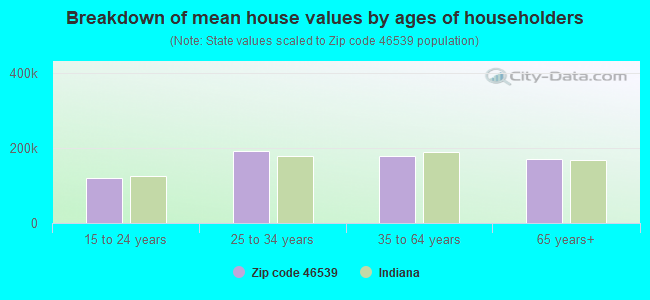
Estimated median house/condo value in 2022: $154,593
46539:
$154,593
Indiana:
$208,700
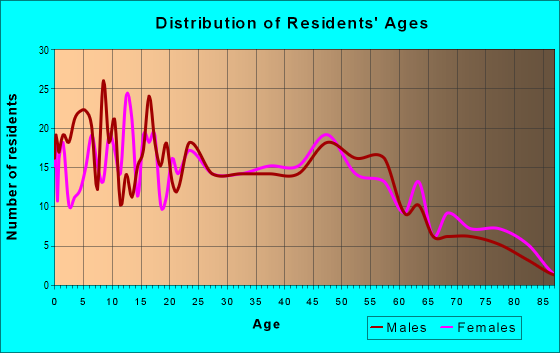
Median resident age:
This zip code:
39.1 years
Indiana median age:
38.2 years
Average household size:
This zip code:
2.4 people
Indiana:
2.4 people
Averages for the 2020 tax year for zip code 46539, filed in 2021:
Average Adjusted Gross Income (AGI) in 2020: $52,350 (Individual Income Tax Returns)
Here:
$52,350
State:
$64,978
Salary/wage: $46,032 (reported on 84.7% of returns)
Here:
$46,032
State:
$55,245
(% of AGI for various income ranges: 1151.7% for AGIs below $25k, 3500.7% for AGIs $25k-50k, 6206.0% for AGIs $50k-75k, 8458.0% for AGIs $75k-100k, 22336.7% for AGIs $100k-200k)
Taxable interest for individuals: $845 (reported on 26.1% of returns)
This zip code:
$845
Indiana:
$1,351
(% of AGI for various income ranges: 14.8% for AGIs below $25k, 24.1% for AGIs $25k-50k, 14.7% for AGIs $50k-75k, 11.0% for AGIs $75k-100k, 188.3% for AGIs $100k-200k)
Ordinary dividends: $3,613 (reported on 13.5% of returns)
Here:
$3,613
State:
$5,827
(% of AGI for various income ranges: 16.1% for AGIs below $25k, 37.8% for AGIs $25k-50k, 162.0% for AGIs $75k-100k, 401.7% for AGIs $100k-200k)
Net capital gain/loss in AGI: +$8,485 (reported on 11.7% of returns)
Here:
+$8,485
State:
+$17,730
(% of AGI for various income ranges: 15.2% for AGIs below $25k, 11.1% for AGIs $25k-50k, 212.0% for AGIs $75k-100k, 1376.7% for AGIs $100k-200k)
Profit/loss from business: +$5,440 (reported on 9.0% of returns)
Here:
+$5,440
State:
+$12,144
(% of AGI for various income ranges: 74.8% for AGIs below $25k, 47.4% for AGIs $25k-50k, 70.0% for AGIs $50k-75k, 139.0% for AGIs $75k-100k)
Taxable individual retirement arrangement distribution: $14,660 (reported on 9.0% of returns)
46539:
$14,660
Indiana:
$18,302
(% of AGI for various income ranges: 73.5% for AGIs below $25k, 220.0% for AGIs $25k-50k, 703.0% for AGIs $75k-100k)
Total itemized deductions: $26,267 (reported on 2.7% of returns)
Here:
$26,267
State:
$35,601
(% of AGI for various income ranges: 788.0% for AGIs $75k-100k)
Taxes paid: $6,400 (reported on 2.7% of returns)
46539:
$6,400
State:
$7,542
(% of AGI for various income ranges: 192.0% for AGIs $75k-100k)
Earned income credit: $2,219 (reported on 14.4% of returns)
Here:
$2,219
State:
$2,298
(% of AGI for various income ranges: 85.7% for AGIs below $25k, 58.5% for AGIs $25k-50k)
Percentage of individuals using paid preparers for their 2020 taxes: 95.5%
Here:
95%
State:
94%
(% for various income ranges: 94.1% for AGIs below $25k, 97.0% for AGIs $25k-50k, 94.4% for AGIs $50k-75k, 92.3% for AGIs $75k-100k, 100.0% for AGIs $100k-200k)
Averages for the 2012 tax year for zip code 46539, filed in 2013:
Average Adjusted Gross Income (AGI) in 2012: $47,414 (Individual Income Tax Returns)
Here:
$47,414
State:
$52,932
Salary/wage: $40,329 (reported on 86.9% of returns)
Here:
$40,329
State:
$45,173
(% of AGI for various income ranges: 78.7% for AGIs below $25k, 81.3% for AGIs $25k-50k, 84.5% for AGIs $50k-75k, 80.8% for AGIs $75k-100k, 56.8% for AGIs $100k-200k)
Taxable interest for individuals: $928 (reported on 33.6% of returns)
This zip code:
$928
Indiana:
$1,311
(% of AGI for various income ranges: 1.3% for AGIs below $25k, 0.9% for AGIs $25k-50k, 0.7% for AGIs $50k-75k, 0.5% for AGIs $75k-100k, 0.3% for AGIs $100k-200k)
Ordinary dividends: $2,120 (reported on 14.0% of returns)
Here:
$2,120
State:
$4,690
(% of AGI for various income ranges: 0.5% for AGIs below $25k, 0.9% for AGIs $25k-50k, 1.1% for AGIs $50k-75k, 0.6% for AGIs $75k-100k, 0.2% for AGIs $100k-200k)
Net capital gain/loss in AGI: +$7,489 (reported on 8.4% of returns)
Here:
+$7,489
State:
+$10,406
(% of AGI for various income ranges: 1.0% for AGIs $25k-50k, 0.1% for AGIs $50k-75k, 3.4% for AGIs $100k-200k)
Profit/loss from business: +$4,369 (reported on 12.1% of returns)
Here:
+$4,369
State:
+$11,105
(% of AGI for various income ranges: 2.3% for AGIs below $25k, 1.8% for AGIs $25k-50k, 2.2% for AGIs $50k-75k)
Taxable individual retirement arrangement distribution: $9,830 (reported on 9.3% of returns)
46539:
$9,830
Indiana:
$13,841
(% of AGI for various income ranges: 3.0% for AGIs below $25k, 2.7% for AGIs $25k-50k, 4.6% for AGIs $50k-75k)
Total itemized deductions: $17,984 (16% of AGI, reported on 17.8% of returns)
Here:
$17,984
State:
$20,913
Here:
16.5% of AGI
State:
18.2% of AGI
(% of AGI for various income ranges: 7.0% for AGIs $25k-50k, 5.9% for AGIs $50k-75k, 7.9% for AGIs $75k-100k, 8.7% for AGIs $100k-200k)
Charity contributions: $4,393 (reported on 13.1% of returns)
Here:
$4,393
State:
$4,697
(% of AGI for various income ranges: 0.9% for AGIs $25k-50k, 0.9% for AGIs $50k-75k, 0.6% for AGIs $75k-100k, 2.3% for AGIs $100k-200k)
Taxes paid: $5,800 (reported on 17.8% of returns)
46539:
$5,800
State:
$7,456
(% of AGI for various income ranges: 1.6% for AGIs $25k-50k, 1.6% for AGIs $50k-75k, 2.6% for AGIs $75k-100k, 3.4% for AGIs $100k-200k)
Earned income credit: $2,410 (reported on 18.7% of returns)
Here:
$2,410
State:
$2,265
(% of AGI for various income ranges: 6.8% for AGIs below $25k, 1.3% for AGIs $25k-50k)
Percentage of individuals using paid preparers for their 2012 taxes: 60.7%
Here:
61%
State:
53%
(% for various income ranges: 54.8% for AGIs below $25k, 63.3% for AGIs $25k-50k, 63.2% for AGIs $50k-75k, 62.5% for AGIs $75k-100k, 75.0% for AGIs $100k-200k)
Averages for the 2004 tax year for zip code 46539, filed in 2005:
Average Adjusted Gross Income (AGI) in 2004: $38,768 (Individual Income Tax Returns)
Here:
$38,768
State:
$44,790
Salary/wage: $36,364 (reported on 87.1% of returns)
Here:
$36,364
State:
$39,615
(% of AGI for various income ranges: 98.0% for AGIs below $10k, 79.0% for AGIs $10k-25k, 88.5% for AGIs $25k-50k, 86.1% for AGIs $50k-75k, 86.2% for AGIs $75k-100k, 62.9% for AGIs over 100k)
Taxable interest for individuals: $1,266 (reported on 36.0% of returns)
This zip code:
$1,266
Indiana:
$1,535
(% of AGI for various income ranges: 13.6% for AGIs below $10k, 2.5% for AGIs $10k-25k, 1.0% for AGIs $25k-50k, 0.7% for AGIs $50k-75k, 0.4% for AGIs $75k-100k, 0.7% for AGIs over 100k)
Taxable dividends: $1,644 (reported on 20.6% of returns)
Here:
$1,644
State:
$2,998
(% of AGI for various income ranges: 1.8% for AGIs below $10k, 1.0% for AGIs $10k-25k, 0.5% for AGIs $25k-50k, 1.2% for AGIs $50k-75k, 0.2% for AGIs $75k-100k, 1.4% for AGIs over 100k)
Net capital gain/loss: +$6,686 (reported on 13.0% of returns)
Here:
+$6,686
State:
+$8,619
(% of AGI for various income ranges: -1.8% for AGIs below $10k, -0.0% for AGIs $10k-25k, 0.5% for AGIs $25k-50k, 0.6% for AGIs $50k-75k, 0.0% for AGIs $75k-100k, 10.0% for AGIs over 100k)
Profit/loss from business: +$3,245 (reported on 13.3% of returns)
Here:
+$3,245
State:
+$10,071
(% of AGI for various income ranges: 1.7% for AGIs below $10k, 4.8% for AGIs $10k-25k, 1.4% for AGIs $25k-50k, 1.0% for AGIs $50k-75k, -0.1% for AGIs over 100k)
IRA payment deduction: $1,923 (reported on 1.2% of returns)
46539:
$1,923
Indiana:
$2,840
Total itemized deductions: $14,579 (20% of AGI, reported on 19.4% of returns)
Here:
$14,579
State:
$17,065
Here:
19.8% of AGI
State:
19.5% of AGI
(% of AGI for various income ranges: 5.9% for AGIs $10k-25k, 5.3% for AGIs $25k-50k, 7.0% for AGIs $50k-75k, 9.5% for AGIs $75k-100k, 10.1% for AGIs over 100k)
Charity contributions deductions: $2,906 (4% of AGI, reported on 14.9% of returns)
Here:
$2,906
State:
$3,550
Here:
3.8% of AGI
State:
3.8% of AGI
(% of AGI for various income ranges: 0.5% for AGIs $10k-25k, 0.7% for AGIs $25k-50k, 1.0% for AGIs $50k-75k, 1.9% for AGIs $75k-100k, 1.5% for AGIs over 100k)
Total tax: $4,896 (reported on 73.0% of returns)
46539:
$4,896
State:
$6,914
(% of AGI for various income ranges: 2.0% for AGIs below $10k, 4.4% for AGIs $10k-25k, 6.4% for AGIs $25k-50k, 8.4% for AGIs $50k-75k, 10.6% for AGIs $75k-100k, 16.1% for AGIs over 100k)
Earned income credit: $1,654 (reported on 14.8% of returns)
Here:
$1,654
State:
$1,685
Percentage of individuals using paid preparers for their 2004 taxes: 67.2%
Here:
67%
State:
59%
(% for various income ranges: 61.0% for AGIs below $10k, 70.8% for AGIs $10k-25k, 69.3% for AGIs $25k-50k, 63.4% for AGIs $50k-75k, 66.7% for AGIs $75k-100k, 78.9% for AGIs over 100k)
Household received Food Stamps/SNAP in the past 12 months: 32 Household did not receive Food Stamps/SNAP in the past 12 months: 1,008
Women who had a birth in the past 12 months: 62 (1 now married, 52 unmarried) Women who did not have a birth in the past 12 months: 568 (296 now married, 273 unmarried)
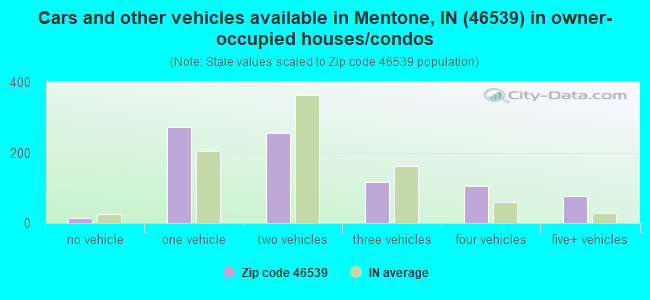
Housing units in zip code 46539 with a mortgage: 534 (94 second mortgage, 61 both second mortgage and home equity loan) Houses without a mortgage: 80
Median monthly owner costs for units with a mortgage: $973 Median monthly owner costs for units without a mortgage: $424
Residents with income below the poverty level in 2022:
This zip code:
11.4%
Whole state:
12.6%
Residents with income below 50% of the poverty level in 2022:
This zip code:
2.5%
Whole state:
6.3%
Median number of rooms in houses and condos:
Here:
6.7
State:
6.6
Median number of rooms in apartments:
Here:
5.2
State:
4.3
Notable locations in this zip code not listed on our city pages
271 married couples with children.
137 single-parent households (44 men, 93 women).
95.7% of residents of 46539 zip code speak English at home.
3.1% of residents speak Spanish at home (72% very well, 3% well, 26% not well).
0.5% of residents speak other Indo-European language at home (100% well).
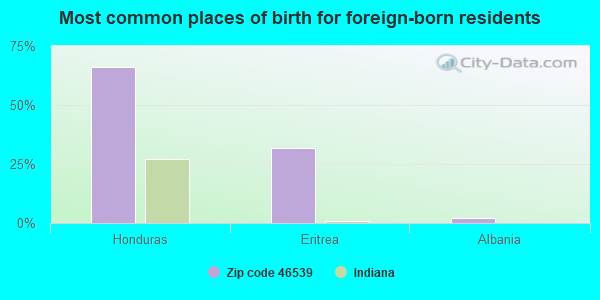
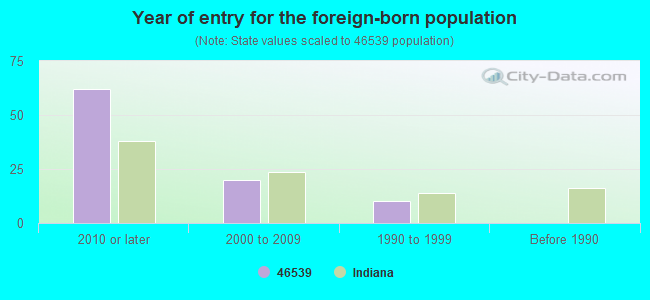
Foreign born population: 46 (1.9%) (33.7% of them are naturalized citizens)
This zip code:
1.9%
Whole state:
6.1%
66%Honduras
32%Eritrea
2%Albania
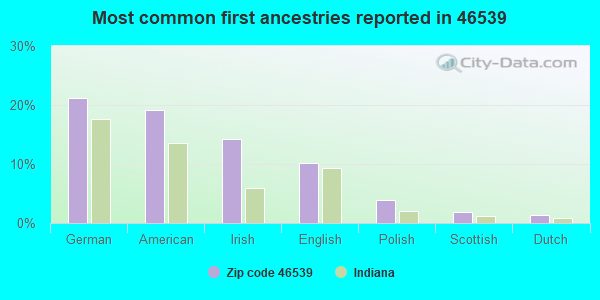
21%German
19%American
14%Irish
10%English
4%Polish
2%Scottish
1%Dutch
Year of entry for the foreign-born population
622010 or later
202000 to 2009
101990 to 1999
0Before 1990
Facilities with environmental interests located in this zip code:
MIDWEST SPRING MFG CO (105 ETNA ST in MENTONE, IN)
AIR MINOR (AIRS/AFS) STATE MASTER (Indiana facility tracking) - ACES-OP-08500023, AIR PROGRAM Conditionally Exempt Small Quantity Generators, less than 100 kg/month of hazardous waste (Resource Conservation and Recovery Act (tracking hazardous waste)) Business SIC classification: WIRE SPRINGS Organizations: JEFF ELLISON (CONTACT/OWNER)
Alternative names: MIDWEST SPRING CO, MIDWEST SPRING CO
ROYSTER-CLARK INCORPORATED (968 SOUTH STATE ROAD 19 in MENTONE, IN)
STATE MASTER (Indiana facility tracking) - CRTK-705, EPCRA (Resource Conservation and Recovery Act (tracking hazardous waste)) Organizations: KAISER ESTECH (CONTACT/OWNER)
Alternative names: KAISER ESTECH
CARGILL INC ANIMAL NUTRITION DIV (104 N ETNA ST in MENTONE, IN)
AIR MINOR (AIRS/AFS) STATE MASTER (Indiana facility tracking) - ACES-OP-08500042, AIR PROGRAM, CRTK-3817, EPCRA TRI REPORTER (Tracking of toxic chemicals releasing facilities) Business SIC classification: PREPARED FEEDS AND FEED INGREDIENTS FOR ANIMALS AND FOWLS, EXCEPT DOGS AND CATS Alternative names: CARGILL INC ANIMAL FEEDS DIV, NUTRENA FEEDS
MENTONE ELEMENTARY SCHOOL (YALE/JACKSON BOX 457 in MENTONE, IN)
(Geographic Names Information System) (National Center for Education Statistics) - STATE ID-3603 Organizations: TIPPECANOE VALLEY SCHOOL CORP (SCHOOL DISTRICT)
MENTONE MUNICIPAL SEWAGE TREATMENT PLANT (STATE ROUTE 19 & ETNA STREET 1/4 MILES NORTH in MENTONE, IN)
STATE MASTER (Indiana facility tracking) National Pollutant Discharge Elimination System NON-MAJOR (Tracking pollutant discharge elimination systems) - permit Business SIC classification: SEWERAGE SYSTEMS Organizations: BRIAN REED CERT OPER (CONTACT/OPERATOR)
, TOWN COUNCIL PRESIDENT (CONTACT/OWNER)
Alternative names: MENTONE MUNICIPAL STP, MENTONE MUNICIPAL WWTP
CARGILL NUTRENA FEED DIV (ELM & JACKSON ST in MENTONE, IN)
COMPLIANCE ACTIVITY (Tracking inspections of insecticide, fungicide, and rodenticide, and toxic substances)
Housing units lacking complete plumbing facilities: 1.0% Housing units lacking complete kitchen facilities: 1.0%
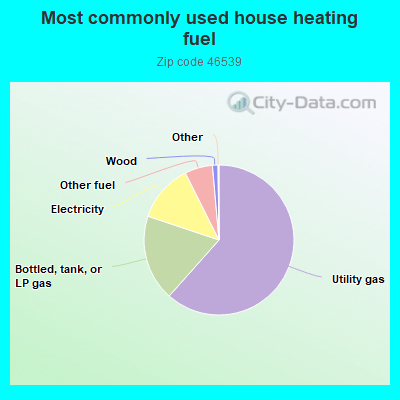
61.7%Utility gas
18.6%Bottled, tank, or LP gas
12.5%Electricity
6.0%Other fuel
1.2%Wood
Population in 1990: 2,163. Population change in the 1990s: +89 (+4.1%).
Place of birth for U.S.-born residents:
This state: 1,986
Northeast: 17
Midwest: 200
South: 201
West: 10
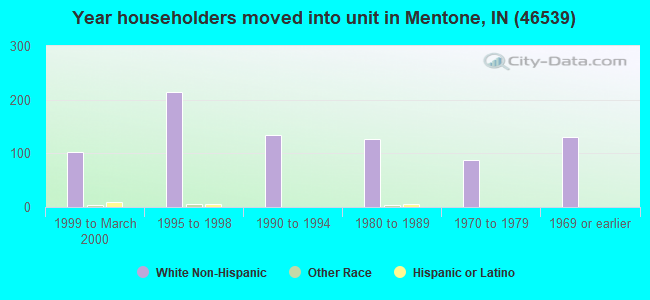
59% of the 46539 zip code residents lived in the same house 5 years ago. Out of people who lived in different houses, 58% lived in this county. Out of people who lived in different counties, 50% lived in Indiana.
97% of the 46539 zip code residents lived in the same house 1 year ago. Out of people who lived in different houses, 53% moved from this county. Out of people who lived in different houses, 29% moved from different county within same state. Out of people who lived in different houses, 31% moved from different state.
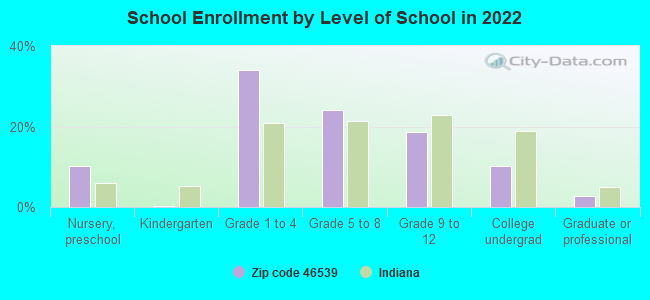
Private vs. public school enrollment:
Students in private schools in grades 1 to 8 (elementary and middle school): 8
Here:
2.6%
Indiana:
14.9%
Students in private schools in grades 9 to 12 (high school): 20
Here:
19.7%
Indiana:
11.4%
Students in private undergraduate colleges: 2
Here:
5.1%
Indiana:
22.3%
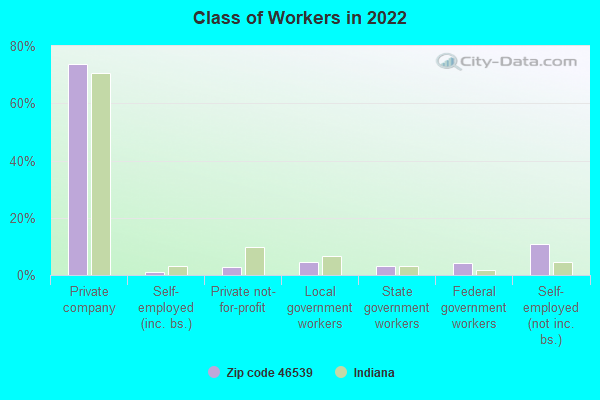
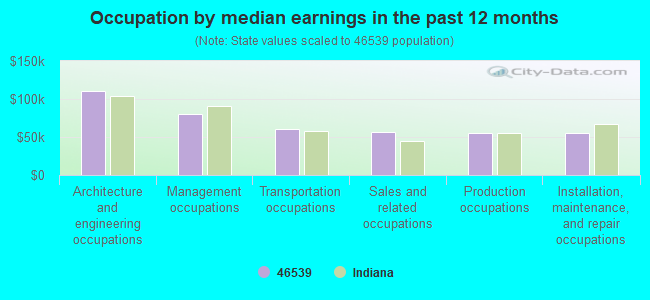
Occupation by median earnings in the past 12 months ($)
109,924Architecture and engineering occupations
80,727Management occupations
60,073Transportation occupations
57,173Sales and related occupations
55,310Production occupations
54,815Installation, maintenance, and repair occupations
Top industries in this zip code by the number of employees in 2005:
Other Services (except Public Administration): Commercial and Industrial Machinery and Equipment (except Automotive and Electronic) Repair and Maintenance (20-49: 1)
Construction: New Single-Family Housing Construction (except Operative Builders) (10-19: 1, 1-4: 1)
Accommodation and Food Services: Limited-Service Restaurants (10-19: 1, 1-4: 1)
2002 - 2017 National Fire Incident Reporting System (NFIRS) incidents
Based on the data from the years 2002 - 2017 the average number of fires per year is 17. The highest number of reported fire incidents - 29 took place in 2012, and the least - 4 in 2017. The data has a declining trend.
When looking into fire subcategories, the most reports belonged to: Outside Fires (45.7%), and Structure Fires (43.4%).
Fire incident types reported to NFIRS in Zip Code 46539
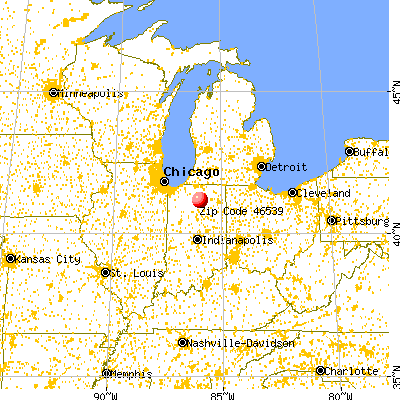


 Nearest zip codes: 46508, 46570, 46502, 46910, 46524, 46510.


 Based on the data from the years 2002 - 2017 the average number of fires per year is 17. The highest number of reported fire incidents - 29 took place in 2012, and the least - 4 in 2017. The data has a declining trend.
 When looking into fire subcategories, the most reports belonged to: Outside Fires (45.7%), and Structure Fires (43.4%).