Estimated zip code population in 2022: 3,517 Zip code population in 2010: 4,908 Zip code population in 2000: 2,052
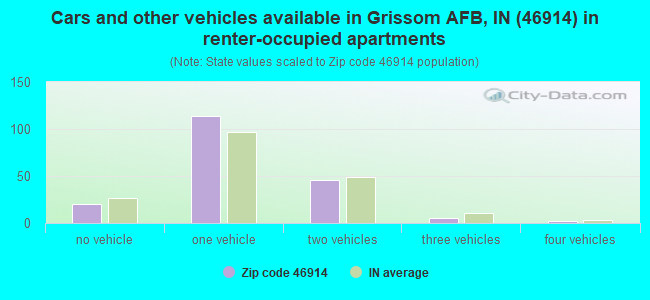
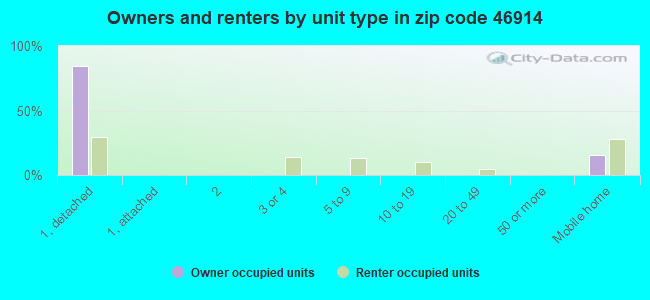
Houses and condos: 1,149 Renter-occupied apartments: 186
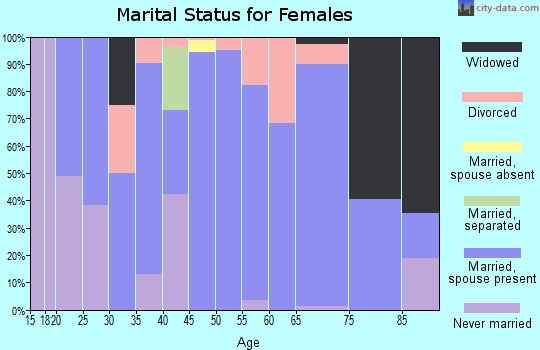
% of renters here:
18%
State:
29%
March 2022 cost of living index in zip code 46914: 74.5 (low, U.S. average is 100)
Land area: 28.8 sq. mi. Water area: 0.1 sq. mi.
Population density: 122 people per square mile
(very low).
OSM Map
General Map
Google Map
MSN Map
OSM Map
General Map
Google Map
MSN Map
OSM Map
General Map
Google Map
MSN Map
OSM Map
General Map
Google Map
MSN Map
Please wait while loading the map...
Real estate property taxes paid for housing units in 2022:
This zip code:
0.5% ($819)
Indiana:
0.7% ($1,467)
Median real estate property taxes paid for housing units with mortgages in 2022: $849 (0.4%) Median real estate property taxes paid for housing units with no mortgage in 2022: $802 (0.7%)
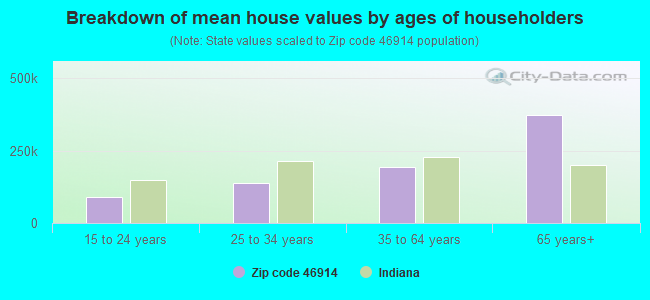
Estimated median house/condo value in 2022: $172,439
46914:
$172,439
Indiana:
$208,700
According to our research of Indiana and other state lists, there was 1 registered sex offender living in 46914 zip code as of April 23, 2024. The ratio of all residents to sex offenders in zip code 46914 is 1,773 to 1. The ratio of registered sex offenders to all residents in this zip code is much lower than the state average.
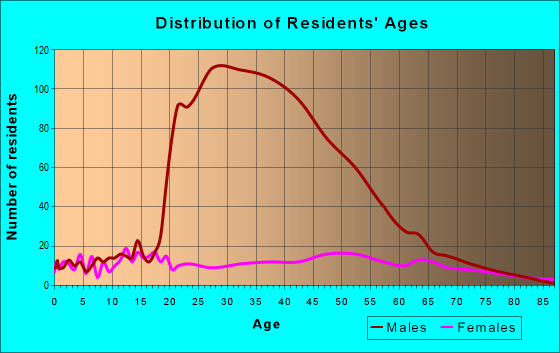
Median resident age:
This zip code:
42.9 years
Indiana median age:
38.2 years
Average household size:
This zip code:
2.6 people
Indiana:
2.4 people
Averages for the 2020 tax year for zip code 46914, filed in 2021:
Average Adjusted Gross Income (AGI) in 2020: $42,490 (Individual Income Tax Returns)
Here:
$42,490
State:
$64,978
Salary/wage: $42,595 (reported on 69.9% of returns)
Here:
$42,595
State:
$55,245
(% of AGI for various income ranges: 1270.9% for AGIs below $25k, 3080.0% for AGIs $25k-50k, 5588.0% for AGIs $50k-75k, 8167.1% for AGIs $75k-100k, 17506.2% for AGIs $100k-200k)
Taxable interest for individuals: $391 (reported on 38.1% of returns)
This zip code:
$391
Indiana:
$1,351
(% of AGI for various income ranges: 15.9% for AGIs below $25k, 11.1% for AGIs $25k-50k, 49.0% for AGIs $50k-75k, 58.6% for AGIs $75k-100k, 28.7% for AGIs $100k-200k)
Ordinary dividends: $2,254 (reported on 11.5% of returns)
Here:
$2,254
State:
$5,827
(% of AGI for various income ranges: 6.4% for AGIs below $25k, 34.4% for AGIs $25k-50k, 75.7% for AGIs $75k-100k, 205.0% for AGIs $100k-200k)
Net capital gain/loss in AGI: +$6,480 (reported on 8.8% of returns)
Here:
+$6,480
State:
+$17,730
(% of AGI for various income ranges: 17.2% for AGIs $25k-50k, 86.0% for AGIs $50k-75k, 663.8% for AGIs $100k-200k)
Profit/loss from business: +$4,200 (reported on 9.7% of returns)
Here:
+$4,200
State:
+$12,144
(% of AGI for various income ranges: 67.3% for AGIs below $25k, 7.8% for AGIs $25k-50k, 78.0% for AGIs $50k-75k, 277.5% for AGIs $100k-200k)
Taxable individual retirement arrangement distribution: $13,688 (reported on 7.1% of returns)
46914:
$13,688
Indiana:
$18,302
(% of AGI for various income ranges: 163.3% for AGIs $25k-50k, 1144.3% for AGIs $75k-100k)
Earned income credit: $2,231 (reported on 14.2% of returns)
Here:
$2,231
State:
$2,298
(% of AGI for various income ranges: 80.0% for AGIs below $25k, 100.6% for AGIs $25k-50k)
Percentage of individuals using paid preparers for their 2020 taxes: 75.2%
Here:
75%
State:
94%
(% for various income ranges: 52.7% for AGIs below $25k, 95.5% for AGIs $25k-50k, 100.0% for AGIs $50k-75k, 100.0% for AGIs $75k-100k, 92.9% for AGIs $100k-200k)
Averages for the 2012 tax year for zip code 46914, filed in 2013:
Average Adjusted Gross Income (AGI) in 2012: $43,138 (Individual Income Tax Returns)
Here:
$43,138
State:
$52,932
Salary/wage: $35,983 (reported on 84.6% of returns)
Here:
$35,983
State:
$45,173
(% of AGI for various income ranges: 67.2% for AGIs below $25k, 66.4% for AGIs $25k-50k, 66.7% for AGIs $50k-75k, 78.8% for AGIs $75k-100k, 71.2% for AGIs $100k-200k)
Taxable interest for individuals: $1,227 (reported on 33.0% of returns)
This zip code:
$1,227
Indiana:
$1,311
(% of AGI for various income ranges: 1.1% for AGIs below $25k, 1.4% for AGIs $25k-50k, 0.6% for AGIs $50k-75k, 0.6% for AGIs $75k-100k, 1.1% for AGIs $100k-200k)
Ordinary dividends: $2,500 (reported on 12.1% of returns)
Here:
$2,500
State:
$4,690
(% of AGI for various income ranges: 0.4% for AGIs below $25k, 0.6% for AGIs $25k-50k, 0.9% for AGIs $50k-75k, 1.7% for AGIs $75k-100k)
Net capital gain/loss in AGI: +$2,475 (reported on 8.8% of returns)
Here:
+$2,475
State:
+$10,406
(% of AGI for various income ranges: 0.6% for AGIs $50k-75k, 1.4% for AGIs $100k-200k)
Profit/loss from business: +$5,522 (reported on 9.9% of returns)
Here:
+$5,522
State:
+$11,105
(% of AGI for various income ranges: 4.3% for AGIs below $25k, 3.1% for AGIs $25k-50k, 1.1% for AGIs $75k-100k)
Taxable individual retirement arrangement distribution: $8,778 (reported on 9.9% of returns)
46914:
$8,778
Indiana:
$13,841
Total itemized deductions: $17,333 (21% of AGI, reported on 19.8% of returns)
Here:
$17,333
State:
$20,913
Here:
20.6% of AGI
State:
18.2% of AGI
(% of AGI for various income ranges: 6.6% for AGIs $25k-50k, 9.7% for AGIs $50k-75k, 6.5% for AGIs $75k-100k, 11.5% for AGIs $100k-200k)
Charity contributions: $4,062 (reported on 17.6% of returns)
Here:
$4,062
State:
$4,697
(% of AGI for various income ranges: 1.8% for AGIs below $25k, 2.0% for AGIs $50k-75k, 0.9% for AGIs $75k-100k, 3.0% for AGIs $100k-200k)
Taxes paid: $5,888 (reported on 18.7% of returns)
46914:
$5,888
State:
$7,456
(% of AGI for various income ranges: 1.2% for AGIs $25k-50k, 2.3% for AGIs $50k-75k, 2.4% for AGIs $75k-100k, 4.7% for AGIs $100k-200k)
Earned income credit: $1,988 (reported on 17.6% of returns)
Here:
$1,988
State:
$2,265
(% of AGI for various income ranges: 5.5% for AGIs below $25k, 1.2% for AGIs $25k-50k)
Percentage of individuals using paid preparers for their 2012 taxes: 59.3%
Here:
59%
State:
53%
(% for various income ranges: 47.4% for AGIs below $25k, 65.0% for AGIs $25k-50k, 64.3% for AGIs $50k-75k, 70.0% for AGIs $75k-100k, 77.8% for AGIs $100k-200k)
Averages for the 2004 tax year for zip code 46914, filed in 2005:
Average Adjusted Gross Income (AGI) in 2004: $40,262 (Individual Income Tax Returns)
Here:
$40,262
State:
$44,790
Salary/wage: $36,978 (reported on 86.5% of returns)
Here:
$36,978
State:
$39,615
(% of AGI for various income ranges: 85.6% for AGIs below $10k, 65.1% for AGIs $10k-25k, 71.5% for AGIs $25k-50k, 83.8% for AGIs $50k-75k, 86.9% for AGIs $75k-100k, 81.0% for AGIs over 100k)
Taxable interest for individuals: $948 (reported on 44.7% of returns)
This zip code:
$948
Indiana:
$1,535
(% of AGI for various income ranges: 2.5% for AGIs below $10k, 2.9% for AGIs $10k-25k, 1.3% for AGIs $25k-50k, 0.9% for AGIs $50k-75k, 0.2% for AGIs $75k-100k, 0.8% for AGIs over 100k)
Taxable dividends: $772 (reported on 18.2% of returns)
Here:
$772
State:
$2,998
(% of AGI for various income ranges: 0.9% for AGIs below $10k, 1.0% for AGIs $10k-25k, 0.5% for AGIs $25k-50k, 0.3% for AGIs $50k-75k, 0.0% for AGIs $75k-100k, 0.2% for AGIs over 100k)
Net capital gain/loss: +$3,265 (reported on 11.8% of returns)
Here:
+$3,265
State:
+$8,619
(% of AGI for various income ranges: -1.4% for AGIs below $10k, 0.5% for AGIs $10k-25k, 1.5% for AGIs $25k-50k, -0.1% for AGIs $50k-75k, 0.2% for AGIs $75k-100k, 2.6% for AGIs over 100k)
Profit/loss from business: +$3,190 (reported on 12.2% of returns)
Here:
+$3,190
State:
+$10,071
(% of AGI for various income ranges: 3.4% for AGIs below $10k, 3.9% for AGIs $10k-25k, 2.5% for AGIs $25k-50k, -0.0% for AGIs $50k-75k, -0.1% for AGIs over 100k)
IRA payment deduction: $1,944 (reported on 1.8% of returns)
46914:
$1,944
Indiana:
$2,840
Total itemized deductions: $14,360 (19% of AGI, reported on 24.9% of returns)
Here:
$14,360
State:
$17,065
Here:
19.1% of AGI
State:
19.5% of AGI
(% of AGI for various income ranges: 7.5% for AGIs $10k-25k, 6.7% for AGIs $25k-50k, 8.5% for AGIs $50k-75k, 11.1% for AGIs $75k-100k, 11.0% for AGIs over 100k)
Charity contributions deductions: $3,167 (4% of AGI, reported on 21.1% of returns)
Here:
$3,167
State:
$3,550
Here:
4.0% of AGI
State:
3.8% of AGI
(% of AGI for various income ranges: 1.7% for AGIs below $10k, 1.0% for AGIs $25k-50k, 1.6% for AGIs $50k-75k, 2.1% for AGIs $75k-100k, 2.6% for AGIs over 100k)
Total tax: $5,067 (reported on 75.8% of returns)
46914:
$5,067
State:
$6,914
(% of AGI for various income ranges: 1.4% for AGIs below $10k, 4.1% for AGIs $10k-25k, 6.7% for AGIs $25k-50k, 8.5% for AGIs $50k-75k, 10.8% for AGIs $75k-100k, 15.3% for AGIs over 100k)
Earned income credit: $1,276 (reported on 15.3% of returns)
Here:
$1,276
State:
$1,685
Percentage of individuals using paid preparers for their 2004 taxes: 65.8%
Here:
66%
State:
59%
(% for various income ranges: 53.7% for AGIs below $10k, 66.5% for AGIs $10k-25k, 68.1% for AGIs $25k-50k, 70.8% for AGIs $50k-75k, 68.5% for AGIs $75k-100k, 78.9% for AGIs over 100k)
Household received Food Stamps/SNAP in the past 12 months: 57 Household did not receive Food Stamps/SNAP in the past 12 months: 966
Women who had a birth in the past 12 months: 31 (29 now married, 3 unmarried) Women who did not have a birth in the past 12 months: 576 (303 now married, 274 unmarried)
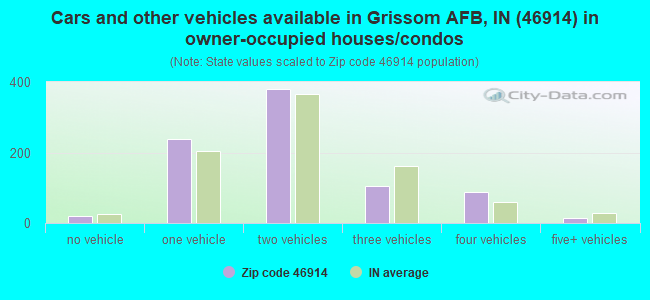
Housing units in zip code 46914 with a mortgage: 428 (58 second mortgage, 7 home equity loan, 53 both second mortgage and home equity loan) Houses without a mortgage: 14
Median monthly owner costs for units with a mortgage: $1,246 Median monthly owner costs for units without a mortgage: $391
Residents with income below the poverty level in 2022:
This zip code:
15.2%
Whole state:
12.6%
Residents with income below 50% of the poverty level in 2022:
This zip code:
3.0%
Whole state:
6.3%
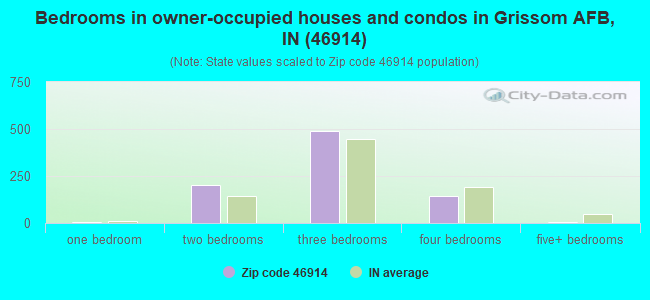
Median number of rooms in houses and condos:
Here:
6.6
State:
6.6
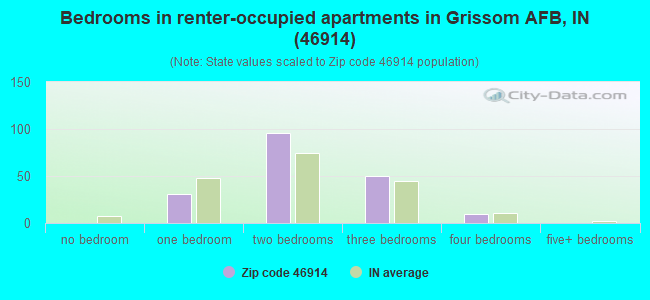
Median number of rooms in apartments:
Here:
4.1
State:
4.3
Notable locations in this zip code not listed on our city pages
In group quarters: 837 (-1 institutionalized population)
Size of family households: 277 2-persons, 172 3-persons, 129 4-persons, 30 5-persons, 3 6-persons, 22 7-or-more-persons
Size of nonfamily households: 306 1-person, 83 2-persons
514 married couples with children.
53 single-parent households (15 men, 38 women).
91.5% of residents of 46914 zip code speak English at home.
2.6% of residents speak Spanish at home (95% very well, 2% well, 2% not well).
1.2% of residents speak other Indo-European language at home (100% very well).
3.7% of residents speak Asian or Pacific Island language at home (100% very well).
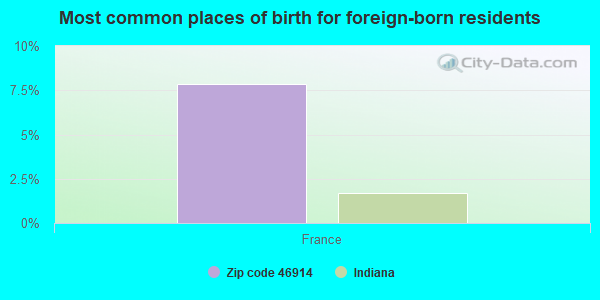
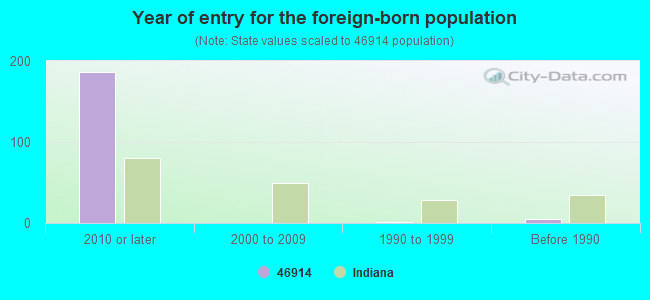
Foreign born population: 162 (4.6%) (0.7% of them are naturalized citizens)
This zip code:
4.6%
Whole state:
6.1%
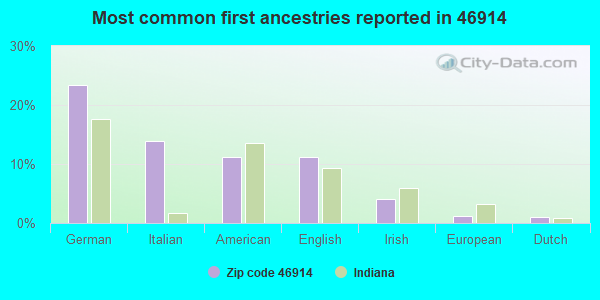
8%France
23%German
14%Italian
11%American
11%English
4%Irish
1%European
1%Dutch
Year of entry for the foreign-born population
1872010 or later
02000 to 2009
11990 to 1999
5Before 1990
Facilities with environmental interests located in this zip code:
MACONAQUAH HIGH SCHOOL (256 E 800 S in BUNKER HILL, IN)
(Geographic Names Information System) STATE MASTER (Indiana facility tracking) - UST-5811, UNDERGROUND STORAGE TANK PROGRAM (National Center for Education Statistics) - STATE ID-6032 Organizations: MACONAQUAH SCHOOL CORP (SCHOOL DISTRICT)
BUNKER HILL MUNICIPAL WWTP (3 N THIRD ST in BUNKER HILL, IN)
STATE MASTER (Indiana facility tracking) - CRTK-7812, EPCRA National Pollutant Discharge Elimination System NON-MAJOR (Tracking pollutant discharge elimination systems) - permit Business SIC classification: SEWERAGE SYSTEMS Organizations: STEPHEN WHYBREW CERT 7223 (CONTACT/OPERATOR)
, BUNKER HILL TOWN COUNCIL (CONTACT/OWNER)
Alternative names: BUNKER HILL MUNICIPAL STP
MACONAQUAH ELEMENTARY SCHOOL (7784 S STRAWTOWN PIKE in BUNKER HILL, IN)
(Geographic Names Information System) STATE MASTER (Indiana facility tracking) (National Center for Education Statistics) - STATE ID-6035 Organizations: MACONAQUAH SCHOOL CORP (SCHOOL DISTRICT)
MACONAQUAH MIDDLE SCHOOL (594 E 800 S in BUNKER HILL, IN)
(Geographic Names Information System) STATE MASTER (Indiana facility tracking) (National Center for Education Statistics) - STATE ID-6033 Organizations: MACONAQUAH SCHOOL CORP (SCHOOL DISTRICT)
MACONAQUAH SCHOOL CORPORATION TECHNOLOGY CENTER (7932 S STRAWTOWN PIKE in BUNKER HILL, IN)
STATE MASTER (Indiana facility tracking) COMPLIANCE ACTIVITY (Tracking inspections of insecticide, fungicide, and rodenticide, and toxic substances) National Pollutant Discharge Elimination System NON-MAJOR (Tracking pollutant discharge elimination systems) - permit Business SIC classification: ELEMENTARY AND SECONDARY SCHOOLS Organizations: MIKE DAHLQUIST 12736 CLS4 (CONTACT/OPERATOR)
Alternative names: MACONAQUAH HIGH SCHOOL
PEN PRODUCTS - MIAMI CORR FAC (3063 W 800 S in BUNKER HILL, IN)
STATE MASTER (Indiana facility tracking) CRITERIA AND HAZARDOUS AIR POLLUTANT INVENTORY (Inventory of air pollution sources) Conditionally Exempt Small Quantity Generators, less than 100 kg/month of hazardous waste (Resource Conservation and Recovery Act (tracking hazardous waste)) HAZARDOUS WASTE BIENNIAL REPORTER (Resource Conservation and Recovery Act (tracking hazardous waste)) TRI REPORTER (Tracking of toxic chemicals releasing facilities) Business SIC classification: MOTOR HOMES Organizations: PEN PRODUCTS-MIAMI CORR FAC (CONTACT/OPERATOR)
, IN DEPT OF ADMIN (CONTACT/OWNER)
Alternative names: PEN PRODUCTS - MCF, PENN PRODS. - MCF
CEDAR CREEK MHP (5851 US 31 S in BUNKER HILL, IN)
STATE MASTER (Indiana facility tracking) National Pollutant Discharge Elimination System NON-MAJOR (Tracking pollutant discharge elimination systems) - permit Business SIC classification: OPERATORS OF RESIDENTIAL MOBILE HOME SITES Organizations: THOMAS WALLACE 13263 EXP 0605 (CONTACT/OPERATOR)
, CEDAR CREEK MOBILE HOME PARK (CONTACT/OWNER)
Alternative names: CEDAR CREEK MOBILE HOME PARK
MIAMI CORRECTIONAL FACILITY (3038 W 850 S in BUNKER HILL, IN)
STATE MASTER (Indiana facility tracking) Conditionally Exempt Small Quantity Generators, less than 100 kg/month of hazardous waste (Resource Conservation and Recovery Act (tracking hazardous waste)) - notification Organizations: IN DEPT OF CORRECTIONS (CONTACT/OWNER)
Housing units lacking complete plumbing facilities: 2.7% Housing units lacking complete kitchen facilities: 1.3%
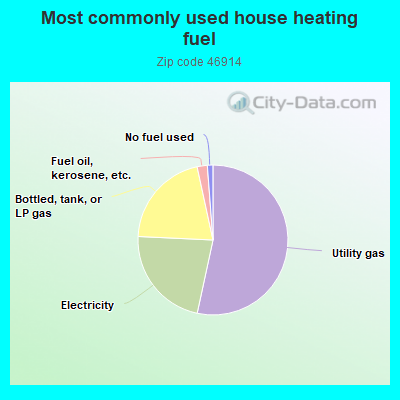
53.5%Utility gas
22.4%Electricity
20.9%Bottled, tank, or LP gas
2.2%Fuel oil, kerosene, etc.
1.2%No fuel used
Population in 1990: 3,073.
Place of birth for U.S.-born residents:
This state: 2,485
Northeast: 41
Midwest: 355
South: 402
West: 43
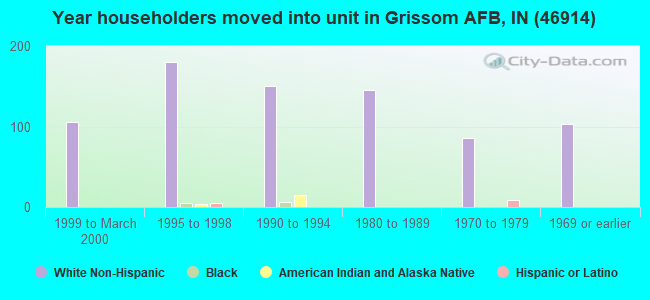
65% of the 46914 zip code residents lived in the same house 5 years ago. Out of people who lived in different houses, 57% lived in this county. Out of people who lived in different counties, 50% lived in Indiana.
74% of the 46914 zip code residents lived in the same house 1 year ago. Out of people who lived in different houses, 11% moved from this county. Out of people who lived in different houses, 83% moved from different county within same state. Out of people who lived in different houses, 3% moved from different state.
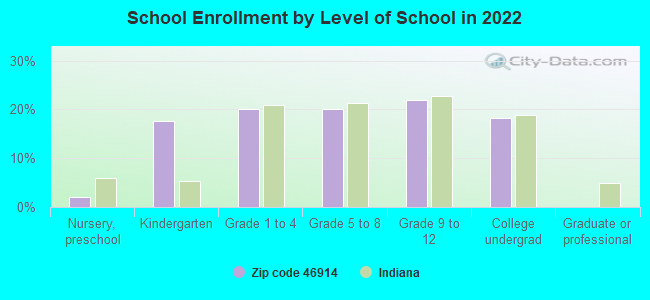
Private vs. public school enrollment:
Students in private schools in grades 1 to 8 (elementary and middle school):
Here:
0.0%
Indiana:
14.9%
Students in private schools in grades 9 to 12 (high school):
Here:
0.0%
Indiana:
11.4%
Students in private undergraduate colleges:
Here:
0.0%
Indiana:
22.3%
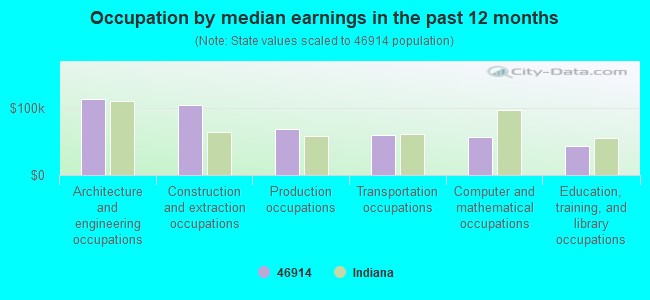
Occupation by median earnings in the past 12 months ($)
113,355Architecture and engineering occupations
104,444Construction and extraction occupations
67,936Production occupations
59,483Transportation occupations
57,067Computer and mathematical occupations
43,129Education, training, and library occupations
Top industries in this zip code by the number of employees in 2005:
Construction: Plumbing, Heating, and Air-Conditioning Contractors (50-99 employees: 1 establishment)
Accommodation and Food Services: Full-Service Restaurants (10-19: 1, 1-4: 1)
Accommodation and Food Services: Food Service Contractors (10-19: 1)
Accommodation and Food Services: Drinking Places (Alcoholic Beverages) (10-19: 1)
Other Services (except Public Administration): Religious Organizations (5-9: 1, 1-4: 2)
Wholesale Trade: Grain and Field Bean Merchant Wholesalers (5-9: 1)
Health Care and Social Assistance: HMO Medical Centers (5-9: 1)
People in group quarters in 2010:
3,120 people in state prisons
Fatal accident statistics in 2014:
Fatal accident count: 1
Vehicles involved in fatal accidents: 2
Fatal accidents caused by drunken drivers: 0
Fatalities: 1
Persons involved in fatal accidents: 2
Pedestrians involved in fatal accidents: 0
Fatal accident statistics in 2013:
Fatal accident count: 2
Vehicles involved in fatal accidents: 3
Fatal accidents caused by drunken drivers: 0
Fatalities: 3
Persons involved in fatal accidents: 5
Pedestrians involved in fatal accidents: 0
2002 - 2018 National Fire Incident Reporting System (NFIRS) incidents
Based on the data from the years 2002 - 2018 the average number of fire incidents per year is 24. The highest number of fires - 50 took place in 2012, and the least - 3 in 2002. The data has a rising trend.
When looking into fire subcategories, the most reports belonged to: Outside Fires (46.6%), and Structure Fires (31.7%).
Fire incident types reported to NFIRS in Zip Code 46914


 Nearest zip codes: 46959, 46967, 46901, 46970, 46911, 46932.


 Based on the data from the years 2002 - 2018 the average number of fire incidents per year is 24. The highest number of fires - 50 took place in 2012, and the least - 3 in 2002. The data has a rising trend.
 When looking into fire subcategories, the most reports belonged to: Outside Fires (46.6%), and Structure Fires (31.7%).