Estimated zip code population in 2022: 3,028 Zip code population in 2010: 3,448 Zip code population in 2000: 3,738
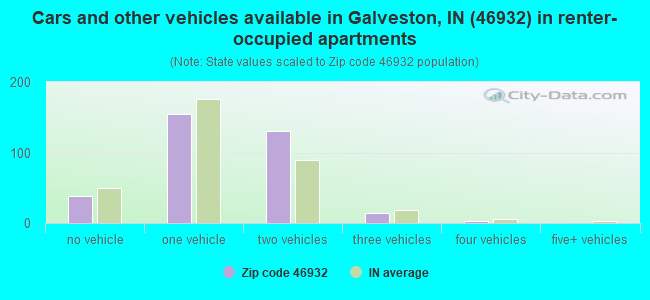
Houses and condos: 1,482 Renter-occupied apartments: 341
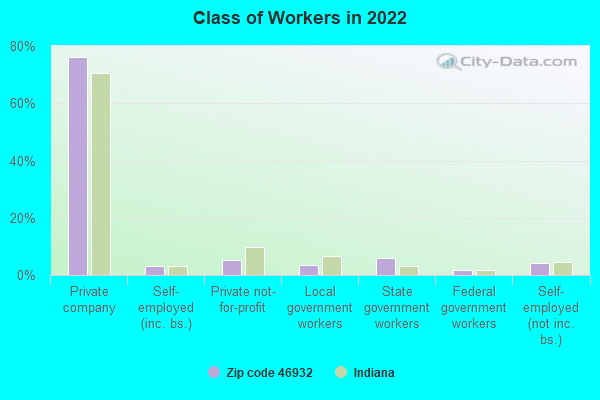
% of renters here:
24%
State:
29%
March 2022 cost of living index in zip code 46932: 84.7 (less than average, U.S. average is 100)
Land area: 55.3 sq. mi. Water area: 0.0 sq. mi.
Population density: 55 people per square mile
(very low).
OSM Map
General Map
Google Map
MSN Map
OSM Map
General Map
Google Map
MSN Map
OSM Map
General Map
Google Map
MSN Map
OSM Map
General Map
Google Map
MSN Map
Please wait while loading the map...
Real estate property taxes paid for housing units in 2022:
This zip code:
0.6% ($968)
Indiana:
0.7% ($1,467)
Median real estate property taxes paid for housing units with mortgages in 2022: $1,061 (0.6%) Median real estate property taxes paid for housing units with no mortgage in 2022: $748 (0.4%)
Business Search- 14 Million verified businesses
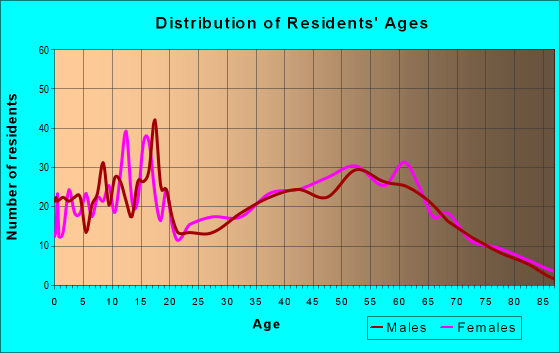
Males: 1,460
(48.2%)
Females: 1,568
(51.8%)
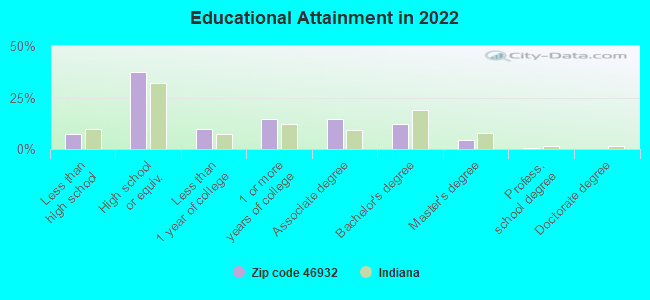
For population 25 years and over in 46932:
High school or higher: 92.3%
Bachelor's degree or higher: 17.2%
Graduate or professional degree: 5.2%
Unemployed: 5.5%
Mean travel time to work (commute): 24.5 minutes
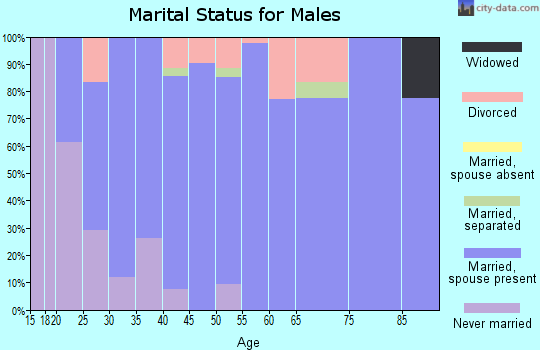
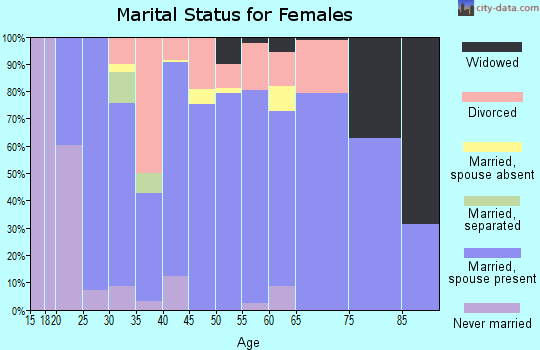
For population 15 years and over in 46932:
Never married: 19.1%
Now married: 62.1%
Separated: 0.2%
Widowed: 5.3%
Divorced: 13.3%
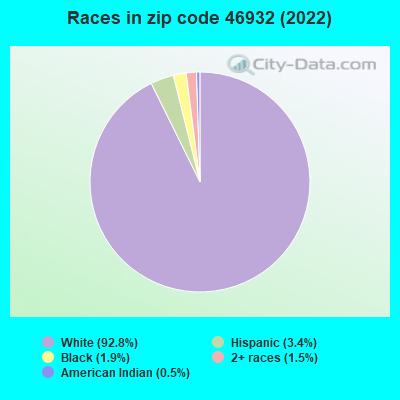
Zip code 46932 compared to state average:
Black race population percentage significantly below state average.
Hispanic race population percentage below state average.
Median age significantly above state average.
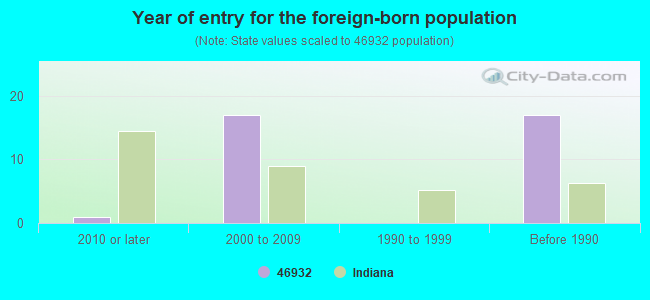
Foreign-born population percentage significantly below state average.
Length of stay since moving in significantly above state average.
Percentage of population with a bachelor's degree or higher below state average.
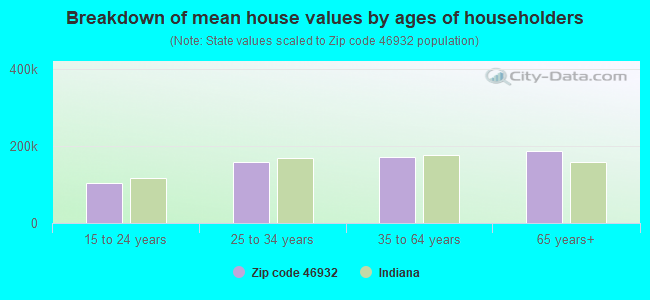
Estimated median house/condo value in 2022: $168,915
46932:
$168,915
Indiana:
$208,700
Median resident age:
This zip code:
47.0 years
Indiana median age:
38.2 years
Average household size:
This zip code:
2.2 people
Indiana:
2.4 people
Averages for the 2020 tax year for zip code 46932, filed in 2021:
Average Adjusted Gross Income (AGI) in 2020: $57,219 (Individual Income Tax Returns)
Here:
$57,219
State:
$64,978
Salary/wage: $49,681 (reported on 79.9% of returns)
Here:
$49,681
State:
$55,245
(% of AGI for various income ranges: 1081.4% for AGIs below $25k, 3191.7% for AGIs $25k-50k, 6158.5% for AGIs $50k-75k, 8420.0% for AGIs $75k-100k, 15741.9% for AGIs $100k-200k)
Taxable interest for individuals: $815 (reported on 31.4% of returns)
This zip code:
$815
Indiana:
$1,351
(% of AGI for various income ranges: 15.7% for AGIs below $25k, 23.7% for AGIs $25k-50k, 49.0% for AGIs $50k-75k, 40.0% for AGIs $75k-100k, 63.1% for AGIs $100k-200k)
Ordinary dividends: $2,638 (reported on 15.4% of returns)
Here:
$2,638
State:
$5,827
(% of AGI for various income ranges: 16.0% for AGIs below $25k, 23.7% for AGIs $25k-50k, 81.5% for AGIs $50k-75k, 51.5% for AGIs $75k-100k, 198.8% for AGIs $100k-200k)
Net capital gain/loss in AGI: +$5,826 (reported on 13.6% of returns)
Here:
+$5,826
State:
+$17,730
(% of AGI for various income ranges: 36.7% for AGIs $25k-50k, 62.5% for AGIs $50k-75k, 230.0% for AGIs $75k-100k, 511.2% for AGIs $100k-200k)
Profit/loss from business: +$7,318 (reported on 10.1% of returns)
Here:
+$7,318
State:
+$12,144
(% of AGI for various income ranges: 17.9% for AGIs below $25k, 86.0% for AGIs $25k-50k, 279.5% for AGIs $50k-75k, 53.8% for AGIs $75k-100k, 176.2% for AGIs $100k-200k)
Taxable individual retirement arrangement distribution: $13,467 (reported on 10.7% of returns)
46932:
$13,467
Indiana:
$18,302
(% of AGI for various income ranges: 52.4% for AGIs below $25k, 90.3% for AGIs $25k-50k, 205.5% for AGIs $50k-75k, 319.2% for AGIs $75k-100k, 691.9% for AGIs $100k-200k)
Total itemized deductions: $32,075 (reported on 2.4% of returns)
Here:
$32,075
State:
$35,601
(% of AGI for various income ranges: 222.0% for AGIs $25k-50k, 474.6% for AGIs $75k-100k)
Charity contributions: $9,300 (reported on 1.8% of returns)
Here:
$9,300
State:
$15,596
(% of AGI for various income ranges: 214.6% for AGIs $75k-100k)
Taxes paid: $6,225 (reported on 2.4% of returns)
46932:
$6,225
State:
$7,542
(% of AGI for various income ranges: 25.7% for AGIs $25k-50k, 132.3% for AGIs $75k-100k)
Earned income credit: $2,274 (reported on 13.6% of returns)
Here:
$2,274
State:
$2,298
(% of AGI for various income ranges: 76.0% for AGIs below $25k, 68.0% for AGIs $25k-50k)
Percentage of individuals using paid preparers for their 2020 taxes: 95.9%
Here:
96%
State:
94%
(% for various income ranges: 94.6% for AGIs below $25k, 97.4% for AGIs $25k-50k, 96.4% for AGIs $50k-75k, 94.4% for AGIs $75k-100k, 96.2% for AGIs $100k-200k, 100.0% for AGIs over 200k)
Averages for the 2012 tax year for zip code 46932, filed in 2013:
Average Adjusted Gross Income (AGI) in 2012: $50,102 (Individual Income Tax Returns)
Here:
$50,102
State:
$52,932
Salary/wage: $41,668 (reported on 84.2% of returns)
Here:
$41,668
State:
$45,173
(% of AGI for various income ranges: 62.6% for AGIs below $25k, 64.8% for AGIs $25k-50k, 70.1% for AGIs $50k-75k, 77.2% for AGIs $75k-100k, 70.5% for AGIs $100k-200k)
Taxable interest for individuals: $1,093 (reported on 33.9% of returns)
This zip code:
$1,093
Indiana:
$1,311
(% of AGI for various income ranges: 1.0% for AGIs below $25k, 0.9% for AGIs $25k-50k, 0.6% for AGIs $50k-75k, 0.6% for AGIs $75k-100k, 0.8% for AGIs $100k-200k)
Ordinary dividends: $2,029 (reported on 17.0% of returns)
Here:
$2,029
State:
$4,690
(% of AGI for various income ranges: 1.0% for AGIs below $25k, 0.8% for AGIs $25k-50k, 0.8% for AGIs $50k-75k, 0.4% for AGIs $75k-100k, 0.7% for AGIs $100k-200k)
Net capital gain/loss in AGI: +$3,560 (reported on 12.1% of returns)
Here:
+$3,560
State:
+$10,406
(% of AGI for various income ranges: 0.3% for AGIs $25k-50k, 2.5% for AGIs $100k-200k)
Profit/loss from business: +$6,840 (reported on 12.1% of returns)
Here:
+$6,840
State:
+$11,105
(% of AGI for various income ranges: 4.0% for AGIs below $25k, 4.0% for AGIs $25k-50k, 1.0% for AGIs $50k-75k, 1.1% for AGIs $75k-100k, 0.6% for AGIs $100k-200k)
Taxable individual retirement arrangement distribution: $8,617 (reported on 10.9% of returns)
46932:
$8,617
Indiana:
$13,841
(% of AGI for various income ranges: 3.0% for AGIs below $25k, 1.8% for AGIs $25k-50k, 2.3% for AGIs $50k-75k, 2.5% for AGIs $75k-100k, 1.1% for AGIs $100k-200k)
Total itemized deductions: $17,571 (20% of AGI, reported on 24.8% of returns)
Here:
$17,571
State:
$20,913
Here:
20.0% of AGI
State:
18.2% of AGI
(% of AGI for various income ranges: 7.2% for AGIs below $25k, 7.2% for AGIs $25k-50k, 7.9% for AGIs $50k-75k, 9.1% for AGIs $75k-100k, 10.0% for AGIs $100k-200k)
Charity contributions: $4,017 (reported on 18.2% of returns)
Here:
$4,017
State:
$4,697
(% of AGI for various income ranges: 0.7% for AGIs below $25k, 1.1% for AGIs $25k-50k, 1.4% for AGIs $50k-75k, 1.5% for AGIs $75k-100k, 1.8% for AGIs $100k-200k)
Taxes paid: $6,132 (reported on 24.8% of returns)
46932:
$6,132
State:
$7,456
(% of AGI for various income ranges: 1.1% for AGIs below $25k, 1.6% for AGIs $25k-50k, 2.3% for AGIs $50k-75k, 3.1% for AGIs $75k-100k, 4.6% for AGIs $100k-200k)
Earned income credit: $2,164 (reported on 15.2% of returns)
Here:
$2,164
State:
$2,265
(% of AGI for various income ranges: 5.2% for AGIs below $25k, 1.2% for AGIs $25k-50k)
Percentage of individuals using paid preparers for their 2012 taxes: 64.8%
Here:
65%
State:
53%
(% for various income ranges: 59.0% for AGIs below $25k, 65.8% for AGIs $25k-50k, 72.0% for AGIs $50k-75k, 63.2% for AGIs $75k-100k, 72.7% for AGIs $100k-200k)
Averages for the 2004 tax year for zip code 46932, filed in 2005:
Average Adjusted Gross Income (AGI) in 2004: $44,715 (Individual Income Tax Returns)
Here:
$44,715
State:
$44,790
Salary/wage: $39,985 (reported on 88.3% of returns)
Here:
$39,985
State:
$39,615
(% of AGI for various income ranges: 99.8% for AGIs below $10k, 65.6% for AGIs $10k-25k, 72.1% for AGIs $25k-50k, 80.1% for AGIs $50k-75k, 87.7% for AGIs $75k-100k, 77.7% for AGIs over 100k)
Taxable interest for individuals: $1,032 (reported on 48.0% of returns)
This zip code:
$1,032
Indiana:
$1,535
(% of AGI for various income ranges: 6.8% for AGIs below $10k, 3.3% for AGIs $10k-25k, 1.4% for AGIs $25k-50k, 1.0% for AGIs $50k-75k, 0.4% for AGIs $75k-100k, 0.7% for AGIs over 100k)
Taxable dividends: $838 (reported on 22.3% of returns)
Here:
$838
State:
$2,998
(% of AGI for various income ranges: 2.0% for AGIs below $10k, 1.2% for AGIs $10k-25k, 0.4% for AGIs $25k-50k, 0.4% for AGIs $50k-75k, 0.2% for AGIs $75k-100k, 0.2% for AGIs over 100k)
Net capital gain/loss: +$3,673 (reported on 15.0% of returns)
Here:
+$3,673
State:
+$8,619
(% of AGI for various income ranges: -1.2% for AGIs below $10k, -0.2% for AGIs $10k-25k, 0.7% for AGIs $25k-50k, 1.4% for AGIs $50k-75k, 0.1% for AGIs $75k-100k, 3.1% for AGIs over 100k)
Profit/loss from business: +$5,329 (reported on 13.4% of returns)
Here:
+$5,329
State:
+$10,071
(% of AGI for various income ranges: 7.4% for AGIs below $10k, 4.3% for AGIs $10k-25k, 2.3% for AGIs $25k-50k, 2.6% for AGIs $50k-75k, 0.4% for AGIs $75k-100k, 0.1% for AGIs over 100k)
Profit/loss from farming: +$221 (reported on 3.9% of returns)
Here:
+$221
State:
-$2,212
(% of AGI for various income ranges: 1.6% for AGIs below $10k, -0.4% for AGIs $25k-50k, -0.4% for AGIs $50k-75k, 0.7% for AGIs $75k-100k)
IRA payment deduction: $2,885 (reported on 1.5% of returns)
46932:
$2,885
Indiana:
$2,840
Total itemized deductions: $14,418 (19% of AGI, reported on 30.5% of returns)
Here:
$14,418
State:
$17,065
Here:
18.6% of AGI
State:
19.5% of AGI
(% of AGI for various income ranges: 8.8% for AGIs $10k-25k, 7.6% for AGIs $25k-50k, 10.3% for AGIs $50k-75k, 11.0% for AGIs $75k-100k, 10.8% for AGIs over 100k)
Charity contributions deductions: $2,748 (3% of AGI, reported on 26.1% of returns)
Here:
$2,748
State:
$3,550
Here:
3.4% of AGI
State:
3.8% of AGI
(% of AGI for various income ranges: 1.1% for AGIs $10k-25k, 1.3% for AGIs $25k-50k, 1.9% for AGIs $50k-75k, 1.7% for AGIs $75k-100k, 1.7% for AGIs over 100k)
Total tax: $5,874 (reported on 78.5% of returns)
46932:
$5,874
State:
$6,914
(% of AGI for various income ranges: 3.5% for AGIs below $10k, 3.8% for AGIs $10k-25k, 7.0% for AGIs $25k-50k, 9.0% for AGIs $50k-75k, 10.6% for AGIs $75k-100k, 15.8% for AGIs over 100k)
Earned income credit: $1,598 (reported on 12.0% of returns)
Here:
$1,598
State:
$1,685
Percentage of individuals using paid preparers for their 2004 taxes: 66.4%
Here:
66%
State:
59%
(% for various income ranges: 57.2% for AGIs below $10k, 65.8% for AGIs $10k-25k, 67.6% for AGIs $25k-50k, 71.1% for AGIs $50k-75k, 71.5% for AGIs $75k-100k, 69.0% for AGIs over 100k)
Household received Food Stamps/SNAP in the past 12 months: 22 Household did not receive Food Stamps/SNAP in the past 12 months: 1,379
Women who had a birth in the past 12 months: 50 (55 now married, 0 unmarried) Women who did not have a birth in the past 12 months: 527 (266 now married, 261 unmarried)
Housing units in zip code 46932 with a mortgage: 661 (84 second mortgage, 66 both second mortgage and home equity loan) Houses without a mortgage: 36
Median monthly owner costs for units with a mortgage: $1,061 Median monthly owner costs for units without a mortgage: $395
Residents with income below the poverty level in 2022:
This zip code:
6.3%
Whole state:
12.6%
Residents with income below 50% of the poverty level in 2022:
This zip code:
4.3%
Whole state:
6.3%
Median number of rooms in houses and condos:
Here:
6.8
State:
6.6
Median number of rooms in apartments:
Here:
4.5
State:
4.3
Notable locations in this zip code not listed on our city pages
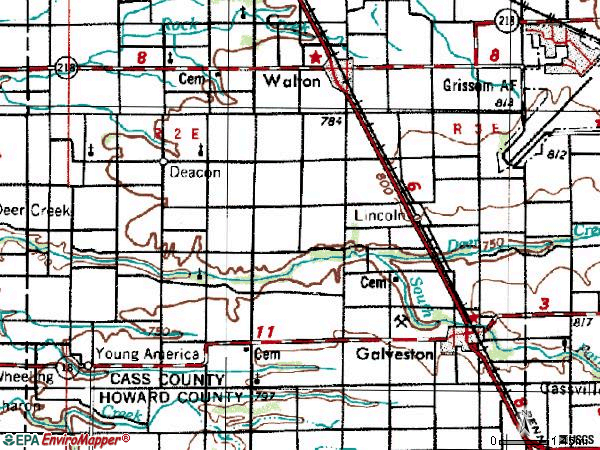
Notable locations in zip code 46932: Galveston Volunteer Fire Department (A), Young America Volunteer Fire Department (B). Display/hide their locations on the map
Churches in zip code 46932 include: Center Church (A), Mount Zion Church (B), Otterbein Church (C), Upper Deer Creek Church (D). Display/hide their locations on the map
Cemeteries: McWilliams Cemetery (1), Meeks Cemetery (2), Harness Cemetery (3), Patterson Cemetery (4), Sprinkle Cemetery (5). Display/hide their locations on the map
In group quarters: 4 (-1 institutionalized population)
Size of family households: 521 2-persons, 199 3-persons, 142 4-persons, 33 5-persons, 8 6-persons, 2 7-or-more-persons
Size of nonfamily households: 449 1-person, 31 2-persons, 16 3-persons
359 married couples with children.
71 single-parent households (36 men, 35 women).
95.7% of residents of 46932 zip code speak English at home.
2.7% of residents speak Spanish at home (59% very well, 41% not well).
1.0% of residents speak other Indo-European language at home (100% very well).
0.2% of residents speak Asian or Pacific Island language at home (100% very well).
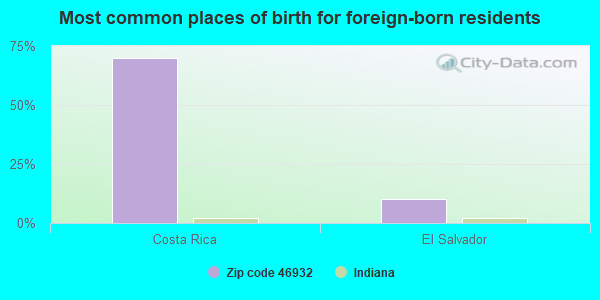
Foreign born population: 10 (0.4%) (0.0% of them are naturalized citizens)
:
0.4%
Whole state:
6.1%
70%Costa Rica
10%El Salvador
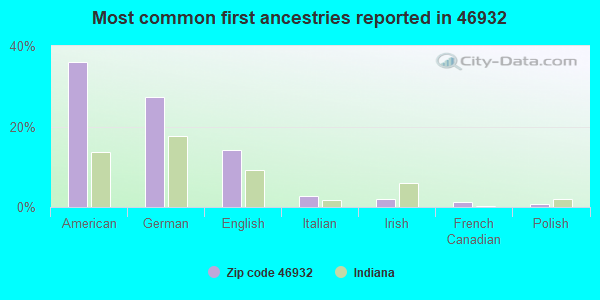
36%American
27%German
14%English
3%Italian
2%Irish
1%French Canadian
1%Polish
Year of entry for the foreign-born population
12010 or later
172000 to 2009
01990 to 1999
17Before 1990
Facilities with environmental interests located in this zip code:
GALVESTON ELEMENTARY SCHOOL (401 S MAPLE ST in GALVESTON, IN)
STATE MASTER (Indiana facility tracking) - UST-17131, UNDERGROUND STORAGE TANK PROGRAM (National Center for Education Statistics) - STATE ID-0673 Organizations: SOUTHEASTERN SCHOOL CORP (SCHOOL DISTRICT)
GALVESTON MUNICIPAL WWTP (129 N MAPLE ST in GALVESTON, IN)
STATE MASTER (Indiana facility tracking) National Pollutant Discharge Elimination System NON-MAJOR (Tracking pollutant discharge elimination systems) - permit Business SIC classification: SEWERAGE SYSTEMS Organizations: JOHN ROBERSON CERT OPER (CONTACT/OPERATOR)
, TOWN COUNCIL PRESIDENT (CONTACT/OWNER)
Alternative names: GALVESTON MUNICIPAL STP
Housing units lacking complete plumbing facilities: 0.2% Housing units lacking complete kitchen facilities: 0.2%
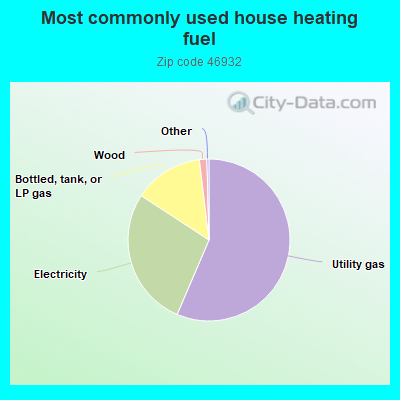
56.5%Utility gas
27.8%Electricity
13.9%Bottled, tank, or LP gas
1.5%Wood
Population in 1990: 3,059. Population change in the 1990s: +679 (+22.2%).
Place of birth for U.S.-born residents:
This state: 2,523
Northeast: 58
Midwest: 188
South: 153
West: 46
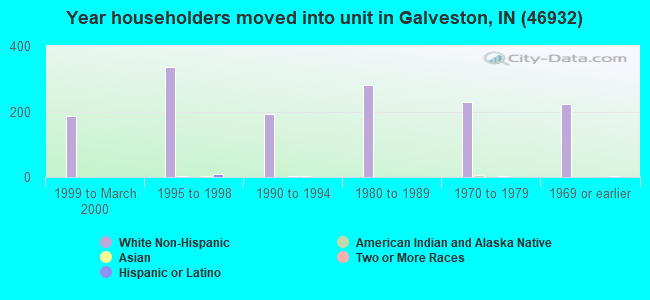
65% of the 46932 zip code residents lived in the same house 5 years ago. Out of people who lived in different houses, 47% lived in this county. Out of people who lived in different counties, 50% lived in Indiana.
89% of the 46932 zip code residents lived in the same house 1 year ago. Out of people who lived in different houses, 54% moved from this county. Out of people who lived in different houses, 39% moved from different county within same state. Out of people who lived in different houses, 5% moved from different state.
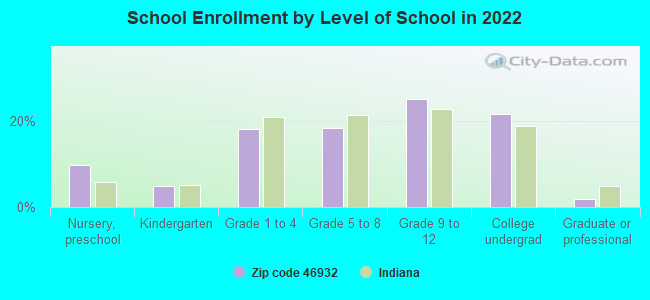
Private vs. public school enrollment:
Students in private schools in grades 1 to 8 (elementary and middle school): 11
Here:
7.2%
Indiana:
14.9%
Students in private schools in grades 9 to 12 (high school):
Here:
0.0%
Indiana:
11.4%
Students in private undergraduate colleges: 17
Here:
18.4%
Indiana:
22.3%
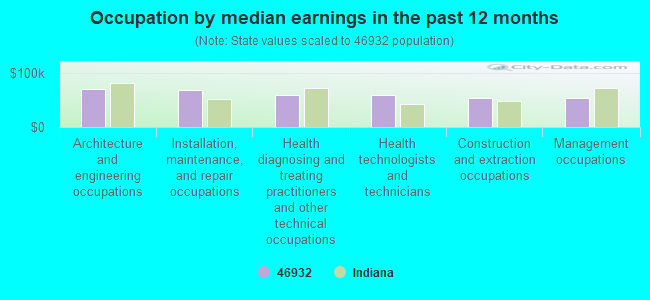
Occupation by median earnings in the past 12 months ($)
70,011Architecture and engineering occupations
69,433Installation, maintenance, and repair occupations
60,066Health diagnosing and treating practitioners and other technical occupations
59,670Health technologists and technicians
54,524Construction and extraction occupations
54,511Management occupations
Top industries in this zip code by the number of employees in 2005:
Other Services (except Public Administration): Religious Organizations (10-19: 1, 5-9: 1)
Health Care and Social Assistance: Child Day Care Services (10-19: 1, 5-9: 1)
Construction: Water and Sewer Line and Related Structures Construction (10-19: 1)
Finance and Insurance: Commercial Banking (5-9: 1, 1-4: 1)
Administrative and Support and Waste Management and Remediation Services: Janitorial Services (5-9: 1, 1-4: 1)
Other Services (except Public Administration): Other Personal Care Services (5-9: 1)
Other Services (except Public Administration): Labor Unions and Similar Labor Organizations (5-9: 1)
Fatal accident statistics in 2013:
Fatal accident count: 1
Vehicles involved in fatal accidents: 2
Fatal accidents caused by drunken drivers: 0
Fatalities: 1
Persons involved in fatal accidents: 2
Pedestrians involved in fatal accidents: 0
2002 - 2016 National Fire Incident Reporting System (NFIRS) incidents
Based on the data from the years 2002 - 2016 the average number of fires per year is 14. The highest number of reported fire incidents - 29 took place in 2005, and the least - 0 in 2015. The data has a growing trend.
When looking into fire subcategories, the most incidents belonged to: Outside Fires (40.8%), and Structure Fires (34.1%).
Fire incident types reported to NFIRS in Zip Code 46932


+$221
-$2,212
(% of AGI for various income ranges: 1.6% for AGIs below $10k, -0.4% for AGIs $25k-50k, -0.4% for AGIs $50k-75k, 0.7% for AGIs $75k-100k) Nearest zip codes: 46994, 46998, 46901, 46967, 46959, 46914.
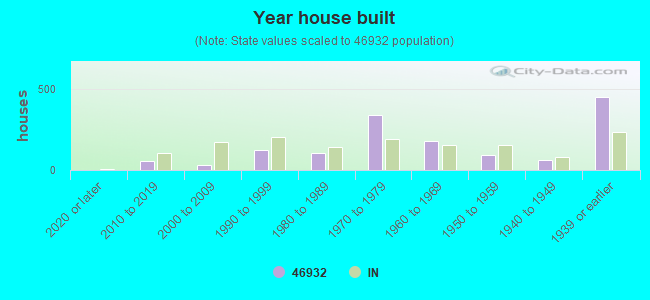


 Based on the data from the years 2002 - 2016 the average number of fires per year is 14. The highest number of reported fire incidents - 29 took place in 2005, and the least - 0 in 2015. The data has a growing trend.
 When looking into fire subcategories, the most incidents belonged to: Outside Fires (40.8%), and Structure Fires (34.1%).