Estimated zip code population in 2022: 1,732 Zip code population in 2010: 2,041 Zip code population in 2000: 1,991
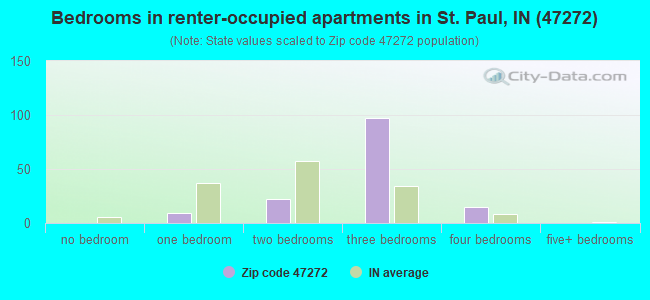
Houses and condos: 755 Renter-occupied apartments: 144
% of renters here:
21%
State:
29%
March 2022 cost of living index in zip code 47272: 84.4 (less than average, U.S. average is 100)
Land area: 32.5 sq. mi. Water area: 0.1 sq. mi.
Population density: 53 people per square mile
(very low).
OSM Map
General Map
Google Map
MSN Map
OSM Map
General Map
Google Map
MSN Map
OSM Map
General Map
Google Map
MSN Map
OSM Map
General Map
Google Map
MSN Map
Please wait while loading the map...
Real estate property taxes paid for housing units in 2022:
This zip code:
0.5% ($607)
Indiana:
0.7% ($1,467)
Median real estate property taxes paid for housing units with mortgages in 2022: $747 (0.5%) Median real estate property taxes paid for housing units with no mortgage in 2022: $579 (0.5%)
Business Search- 14 Million verified businesses
Males: 824
(47.6%)
Females: 908
(52.4%)
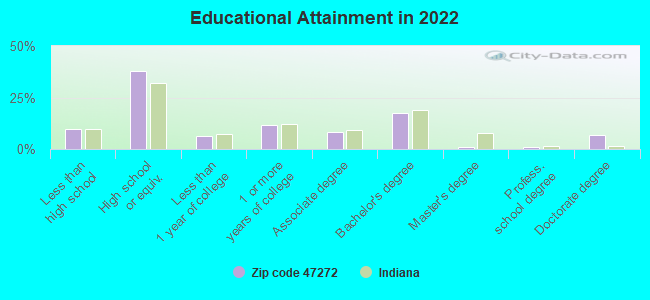
For population 25 years and over in 47272:
High school or higher: 89.8%
Bachelor's degree or higher: 26.1%
Graduate or professional degree: 9.0%
Unemployed: 1.6%
Mean travel time to work (commute): 24.4 minutes
For population 15 years and over in 47272:
Never married: 19.5%
Now married: 57.0%
Separated: 1.7%
Widowed: 10.9%
Divorced: 11.0%
Zip code 47272 compared to state average:
Median house value below state average.
Unemployed percentage below state average.
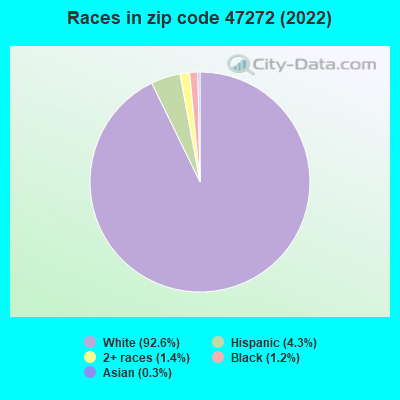
Black race population percentage significantly below state average.
Hispanic race population percentage below state average.
Foreign-born population percentage below state average.
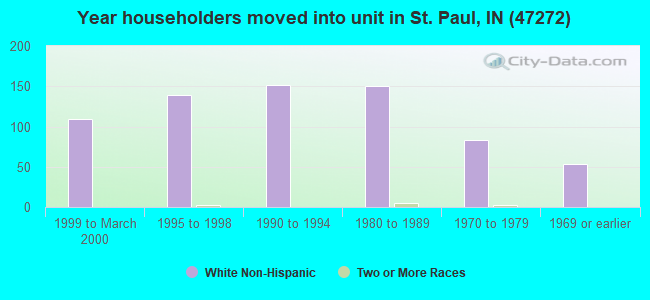
Length of stay since moving in significantly above state average.
Estimated median house/condo value in 2022: $125,038
47272:
$125,038
Indiana:
$208,700
Median resident age:
This zip code:
36.1 years
Indiana median age:
38.2 years
Average household size:
This zip code:
2.6 people
Indiana:
2.4 people
Averages for the 2020 tax year for zip code 47272, filed in 2021:
Average Adjusted Gross Income (AGI) in 2020: $50,107 (Individual Income Tax Returns)
Here:
$50,107
State:
$64,978
Salary/wage: $47,955 (reported on 80.7% of returns)
Here:
$47,955
State:
$55,245
(% of AGI for various income ranges: 1161.6% for AGIs below $25k, 3568.5% for AGIs $25k-50k, 6667.0% for AGIs $50k-75k, 10474.3% for AGIs $75k-100k, 21410.0% for AGIs $100k-200k)
Taxable interest for individuals: $705 (reported on 21.6% of returns)
This zip code:
$705
Indiana:
$1,351
(% of AGI for various income ranges: 11.6% for AGIs below $25k, 39.5% for AGIs $25k-50k, 9.0% for AGIs $50k-75k, 15.7% for AGIs $75k-100k, 26.0% for AGIs $100k-200k)
Ordinary dividends: $1,360 (reported on 11.4% of returns)
Here:
$1,360
State:
$5,827
(% of AGI for various income ranges: 34.7% for AGIs below $25k, 25.0% for AGIs $50k-75k, 90.0% for AGIs $100k-200k)
Net capital gain/loss in AGI: +$6,275 (reported on 13.6% of returns)
Here:
+$6,275
State:
+$17,730
(% of AGI for various income ranges: 15.8% for AGIs below $25k, 28.0% for AGIs $25k-50k, 171.0% for AGIs $50k-75k, 992.0% for AGIs $100k-200k)
Profit/loss from business: +$11,133 (reported on 13.6% of returns)
Here:
+$11,133
State:
+$12,144
(% of AGI for various income ranges: 140.5% for AGIs below $25k, 204.5% for AGIs $25k-50k, 521.0% for AGIs $50k-75k, 278.0% for AGIs $100k-200k)
Taxable individual retirement arrangement distribution: $12,000 (reported on 5.7% of returns)
47272:
$12,000
Indiana:
$18,302
(% of AGI for various income ranges: 181.1% for AGIs below $25k, 256.0% for AGIs $50k-75k)
Earned income credit: $2,082 (reported on 19.3% of returns)
Here:
$2,082
State:
$2,298
(% of AGI for various income ranges: 112.1% for AGIs below $25k, 70.5% for AGIs $25k-50k)
Percentage of individuals using paid preparers for their 2020 taxes: 97.7%
Here:
98%
State:
94%
(% for various income ranges: 96.7% for AGIs below $25k, 100.0% for AGIs $25k-50k, 100.0% for AGIs $50k-75k, 90.9% for AGIs $75k-100k, 100.0% for AGIs $100k-200k)
Averages for the 2012 tax year for zip code 47272, filed in 2013:
Average Adjusted Gross Income (AGI) in 2012: $42,503 (Individual Income Tax Returns)
Here:
$42,503
State:
$52,932
Salary/wage: $37,979 (reported on 84.5% of returns)
Here:
$37,979
State:
$45,173
(% of AGI for various income ranges: 74.6% for AGIs below $25k, 81.8% for AGIs $25k-50k, 84.7% for AGIs $50k-75k, 77.5% for AGIs $75k-100k, 62.8% for AGIs $100k-200k)
Taxable interest for individuals: $752 (reported on 23.7% of returns)
This zip code:
$752
Indiana:
$1,311
(% of AGI for various income ranges: 1.0% for AGIs below $25k, 0.3% for AGIs $25k-50k, 0.3% for AGIs $50k-75k, 0.3% for AGIs $75k-100k, 0.5% for AGIs $100k-200k)
Ordinary dividends: $1,220 (reported on 10.3% of returns)
Here:
$1,220
State:
$4,690
(% of AGI for various income ranges: 0.5% for AGIs below $25k, 0.2% for AGIs $25k-50k, 0.8% for AGIs $50k-75k)
Net capital gain/loss in AGI: +$2,389 (reported on 9.3% of returns)
Here:
+$2,389
State:
+$10,406
(% of AGI for various income ranges: 0.1% for AGIs $25k-50k, 1.4% for AGIs $50k-75k, 0.8% for AGIs $100k-200k)
Profit/loss from business: +$8,343 (reported on 14.4% of returns)
Here:
+$8,343
State:
+$11,105
(% of AGI for various income ranges: 6.6% for AGIs below $25k, 3.4% for AGIs $25k-50k, 1.8% for AGIs $50k-75k, 5.8% for AGIs $75k-100k)
Taxable individual retirement arrangement distribution: $10,714 (reported on 7.2% of returns)
47272:
$10,714
Indiana:
$13,841
Total itemized deductions: $17,724 (19% of AGI, reported on 17.5% of returns)
Here:
$17,724
State:
$20,913
Here:
19.3% of AGI
State:
18.2% of AGI
(% of AGI for various income ranges: 7.9% for AGIs $25k-50k, 6.7% for AGIs $50k-75k, 5.9% for AGIs $75k-100k, 11.2% for AGIs $100k-200k)
Charity contributions: $4,050 (reported on 12.4% of returns)
Here:
$4,050
State:
$4,697
(% of AGI for various income ranges: 1.3% for AGIs $25k-50k, 1.6% for AGIs $50k-75k, 1.3% for AGIs $75k-100k, 1.1% for AGIs $100k-200k)
Taxes paid: $5,600 (reported on 17.5% of returns)
47272:
$5,600
State:
$7,456
(% of AGI for various income ranges: 1.5% for AGIs $25k-50k, 1.7% for AGIs $50k-75k, 1.7% for AGIs $75k-100k, 4.7% for AGIs $100k-200k)
Earned income credit: $2,222 (reported on 18.6% of returns)
Here:
$2,222
State:
$2,265
(% of AGI for various income ranges: 5.9% for AGIs below $25k, 1.3% for AGIs $25k-50k)
Percentage of individuals using paid preparers for their 2012 taxes: 63.9%
Here:
64%
State:
53%
(% for various income ranges: 59.5% for AGIs below $25k, 60.0% for AGIs $25k-50k, 80.0% for AGIs $50k-75k, 62.5% for AGIs $75k-100k, 71.4% for AGIs $100k-200k)
Averages for the 2004 tax year for zip code 47272, filed in 2005:
Average Adjusted Gross Income (AGI) in 2004: $35,894 (Individual Income Tax Returns)
Here:
$35,894
State:
$44,790
Salary/wage: $33,737 (reported on 87.3% of returns)
Here:
$33,737
State:
$39,615
(% of AGI for various income ranges: 94.7% for AGIs below $10k, 76.4% for AGIs $10k-25k, 85.9% for AGIs $25k-50k, 88.5% for AGIs $50k-75k, 84.2% for AGIs $75k-100k, 59.4% for AGIs over 100k)
Taxable interest for individuals: $1,134 (reported on 34.6% of returns)
This zip code:
$1,134
Indiana:
$1,535
(% of AGI for various income ranges: 5.9% for AGIs below $10k, 2.3% for AGIs $10k-25k, 1.3% for AGIs $25k-50k, 0.4% for AGIs $50k-75k, 0.3% for AGIs $75k-100k, 1.2% for AGIs over 100k)
Taxable dividends: $1,086 (reported on 11.6% of returns)
Here:
$1,086
State:
$2,998
(% of AGI for various income ranges: 1.4% for AGIs below $10k, 1.3% for AGIs $10k-25k, 0.4% for AGIs $25k-50k, 0.1% for AGIs $50k-75k, 0.2% for AGIs $75k-100k)
Net capital gain/loss: +$4,731 (reported on 11.9% of returns)
Here:
+$4,731
State:
+$8,619
(% of AGI for various income ranges: -2.6% for AGIs below $10k, 0.6% for AGIs $10k-25k, 0.7% for AGIs $25k-50k, 0.8% for AGIs $50k-75k, 0.7% for AGIs $75k-100k, 7.9% for AGIs over 100k)
Profit/loss from business: +$7,256 (reported on 13.8% of returns)
Here:
+$7,256
State:
+$10,071
(% of AGI for various income ranges: 7.1% for AGIs below $10k, 7.0% for AGIs $10k-25k, 2.8% for AGIs $25k-50k, 1.5% for AGIs $50k-75k, 3.8% for AGIs $75k-100k)
Profit/loss from farming: +$756 (reported on 4.5% of returns)
Here:
+$756
State:
-$2,212
Total itemized deductions: $14,485 (22% of AGI, reported on 22.3% of returns)
Here:
$14,485
State:
$17,065
Here:
22.3% of AGI
State:
19.5% of AGI
(% of AGI for various income ranges: 6.7% for AGIs $10k-25k, 6.4% for AGIs $25k-50k, 10.8% for AGIs $50k-75k, 10.9% for AGIs $75k-100k, 12.1% for AGIs over 100k)
Charity contributions deductions: $2,474 (3% of AGI, reported on 17.0% of returns)
Here:
$2,474
State:
$3,550
Here:
3.5% of AGI
State:
3.8% of AGI
(% of AGI for various income ranges: 2.7% for AGIs below $10k, 1.1% for AGIs $25k-50k, 1.2% for AGIs $50k-75k, 1.2% for AGIs $75k-100k, 2.0% for AGIs over 100k)
Total tax: $3,997 (reported on 73.9% of returns)
47272:
$3,997
State:
$6,914
(% of AGI for various income ranges: 2.1% for AGIs below $10k, 4.1% for AGIs $10k-25k, 6.4% for AGIs $25k-50k, 7.8% for AGIs $50k-75k, 10.2% for AGIs $75k-100k, 15.3% for AGIs over 100k)
Earned income credit: $1,697 (reported on 14.6% of returns)
Here:
$1,697
State:
$1,685
Percentage of individuals using paid preparers for their 2004 taxes: 70.7%
Here:
71%
State:
59%
(% for various income ranges: 67.5% for AGIs below $10k, 70.2% for AGIs $10k-25k, 73.2% for AGIs $25k-50k, 69.7% for AGIs $50k-75k, 71.7% for AGIs $75k-100k, 77.8% for AGIs over 100k)
Likely homosexual households (counted as self-reported same-sex unmarried-partner households)
Lesbian couples: 1.9% of all households
Gay men: 0.2% of all households
Household received Food Stamps/SNAP in the past 12 months: 64 Household did not receive Food Stamps/SNAP in the past 12 months: 613
Women who had a birth in the past 12 months: 16 (10 now married, 6 unmarried) Women who did not have a birth in the past 12 months: 301 (139 now married, 161 unmarried)
Housing units in zip code 47272 with a mortgage: 263 (14 second mortgage, 14 both second mortgage and home equity loan) Houses without a mortgage: 23
Median monthly owner costs for units with a mortgage: $937 Median monthly owner costs for units without a mortgage: $374
Residents with income below the poverty level in 2022:
This zip code:
7.2%
Whole state:
12.6%
Residents with income below 50% of the poverty level in 2022:
This zip code:
5.0%
Whole state:
6.3%
Median number of rooms in houses and condos:
Here:
6.2
State:
6.6
Median number of rooms in apartments:
Here:
5.1
State:
4.3
Notable locations in this zip code not listed on our city pages
Churches in zip code 47272 include: Bethel Church (A), Pleasant Hill Church (B), Star Church (C), Union Chapel (D), Valley Church (E), Wesley Chapel (F). Display/hide their locations on the map
Size of family households: 209 2-persons, 102 3-persons, 87 4-persons, 44 5-persons, 6 6-persons, 9 7-or-more-persons
Size of nonfamily households: 195 1-person, 14 2-persons, 7 3-persons
339 married couples with children.
83 single-parent households (58 men, 25 women).
98.4% of residents of 47272 zip code speak English at home.
0.6% of residents speak Spanish at home (100% very well).
0.3% of residents speak other Indo-European language at home (100% very well).
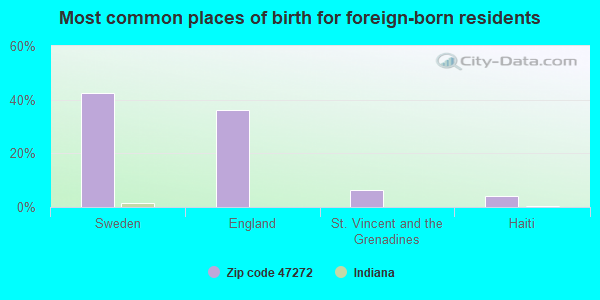
Foreign born population: 46 (2.7%) (26.5% of them are naturalized citizens)
This zip code:
2.7%
Whole state:
6.1%
43%Sweden
36%England
6%St. Vincent and the Grenadines
4%Haiti
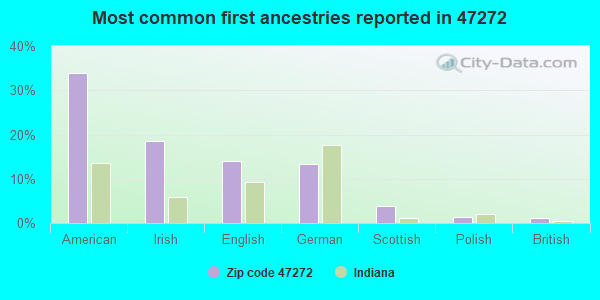
34%American
18%Irish
14%English
13%German
4%Scottish
1%Polish
1%British
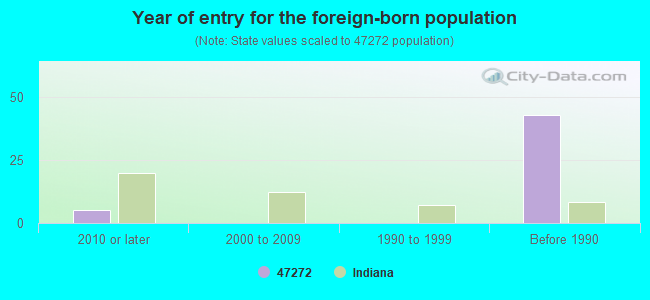
Year of entry for the foreign-born population
52010 or later
02000 to 2009
01990 to 1999
43Before 1990
Facilities with environmental interests located in this zip code:
SAINT PAUL STONE COMPANY (519 SOUTH COUNTY LINE ROAD in SAINT PAUL, IN)
AIR MINOR (AIRS/AFS) STATE MASTER (Indiana facility tracking) - ACES-OP-14500012, AIR PROGRAM, ACES-OP-14503273, National Pollutant Discharge Elimination System NON-MAJOR (Tracking pollutant discharge elimination systems) - permit Business SIC classification: CRUSHED AND BROKEN LIMESTONE Organizations: CERTIFIED OPERATOR (CONTACT/OPERATOR)
, MR KEN WANSTRATH PRESIDENT (CONTACT/OWNER)
Alternative names: NEW POINT STONE COMPANY, INC., NEW POINT STONE, ST. PAUL QUAR
SAINT PAUL WWTP (108 WEBSTER ST in ST PAUL, IN)
STATE MASTER (Indiana facility tracking) - CRTK-230, EPCRA National Pollutant Discharge Elimination System NON-MAJOR (Tracking pollutant discharge elimination systems) - permit Business SIC classification: SEWERAGE SYSTEMS Organizations: JEROME BUENING (CONTACT/OPERATOR)
, ST PAUL TOWN HALL (CONTACT/OWNER)
Alternative names: SAINT PAUL MUNICIPAL STP
RIETH RILEY PORTABLE CMI PLT (7390 E 650 S in ST PAUL, IN)
STATE MASTER (Indiana facility tracking) CRITERIA AND HAZARDOUS AIR POLLUTANT INVENTORY (Inventory of air pollution sources) (Resource Conservation and Recovery Act (tracking hazardous waste)) Business SIC classification: ASPHALT PAVING MIXTURES AND BLOCKS Business NAICS classification: ASPHALT PAVING MIXTURE AND BLOCK MANUFACTURING. Organizations: RIETH-RILEY CONST CO INC (CONTACT/OWNER)
MILESTONE CONTRACTORS LP (519 S COUNTY LINE RD in ST PAUL, IN)
STATE MASTER (Indiana facility tracking) USED OIL PROGRAM (Resource Conservation and Recovery Act (tracking hazardous waste))
Housing units lacking complete plumbing facilities: 6.1% Housing units lacking complete kitchen facilities: 8.2%
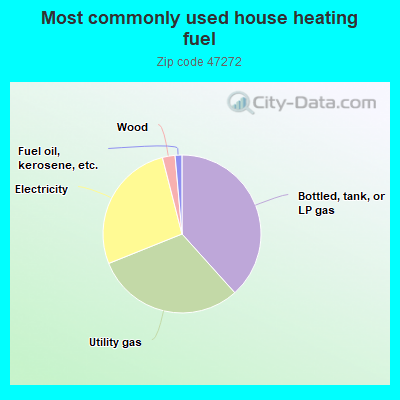
38.5%Bottled, tank, or LP gas
30.7%Utility gas
27.2%Electricity
2.6%Wood
1.4%Fuel oil, kerosene, etc.
Population in 1990: 1,389. Population change in the 1990s: +602 (+43.3%).
Place of birth for U.S.-born residents:
This state: 1,388
Northeast: 5
Midwest: 86
South: 153
West: 35
72% of the 47272 zip code residents lived in the same house 5 years ago. Out of people who lived in different houses, 48% lived in this county. Out of people who lived in different counties, 50% lived in Indiana.
97% of the 47272 zip code residents lived in the same house 1 year ago. Out of people who lived in different houses, 55% moved from this county. Out of people who lived in different houses, 61% moved from different county within same state.
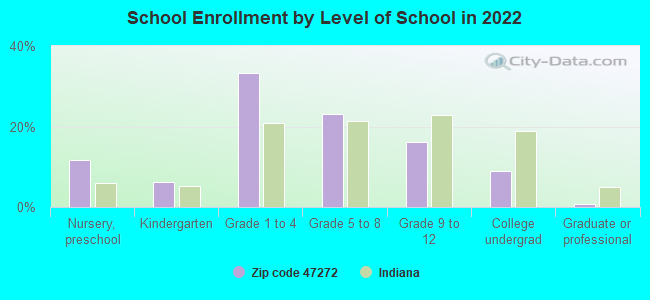
Private vs. public school enrollment:
Students in private schools in grades 1 to 8 (elementary and middle school): 3
Here:
1.7%
Indiana:
14.9%
Students in private schools in grades 9 to 12 (high school):
Here:
0.0%
Indiana:
11.4%
Students in private undergraduate colleges: 3
Here:
9.9%
Indiana:
22.3%
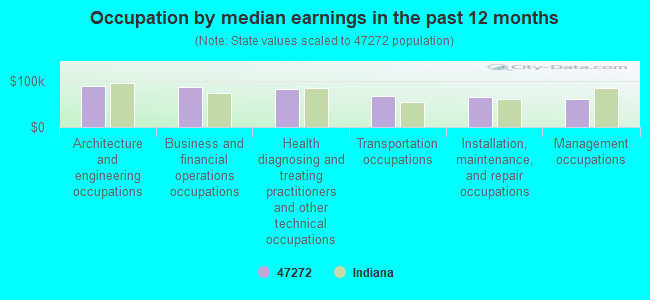
Occupation by median earnings in the past 12 months ($)
88,687Architecture and engineering occupations
87,318Business and financial operations occupations
82,376Health diagnosing and treating practitioners and other technical occupations
66,784Transportation occupations
65,475Installation, maintenance, and repair occupations
61,204Management occupations
Top industries in this zip code by the number of employees in 2005:
Construction: Commercial and Institutional Building Construction (20-49 employees: 1 establishment)
Construction: Roofing Contractors (10-19: 1)
Administrative and Support and Waste Management and Remediation Services: Janitorial Services (10-19: 1)
Mining: Crushed and Broken Limestone Mining and Quarrying (10-19: 1)
Health Care and Social Assistance: Other Individual and Family Services (10-19: 1)
Wholesale Trade: Grain and Field Bean Merchant Wholesalers (5-9: 1)
Fatal accident statistics in 2014:
Fatal accident count: 2
Vehicles involved in fatal accidents: 5
Fatal accidents caused by drunken drivers: 0
Fatalities: 2
Persons involved in fatal accidents: 6
Pedestrians involved in fatal accidents: 0
Fatal accident statistics in 2012:
Fatal accident count: 3
Vehicles involved in fatal accidents: 3
Fatal accidents caused by drunken drivers: 1
Fatalities: 4
Persons involved in fatal accidents: 5
Pedestrians involved in fatal accidents: 0
Home Mortgage Disclosure Act Aggregated Statistics For Year 2009 (Based on 2 partial tracts)
A) FHA, FSA/RHS & VA Home Purchase Loans
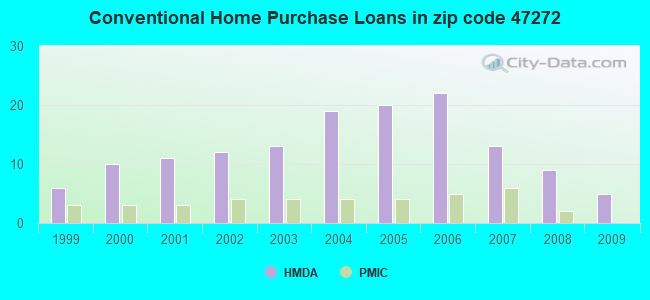
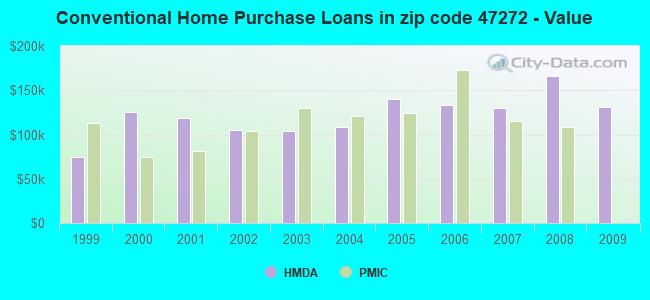
B) Conventional Home Purchase Loans
C) Refinancings
D) Home Improvement Loans
F) Non-occupant Loans on < 5 Family Dwellings (A B C & D)
G) Loans On Manufactured Home Dwelling (A B C & D)
Number
Average Value
Number
Average Value
Number
Average Value
Number
Average Value
Number
Average Value
Number
Average Value
LOANS ORIGINATED
4
$102,508
5
$131,272
35
$160,143
3
$98,030
1
$117,830
2
$82,005
APPLICATIONS APPROVED, NOT ACCEPTED
0
$0
1
$132,910
5
$164,076
0
$0
0
$0
1
$46,820
APPLICATIONS DENIED
1
$76,660
2
$101,015
16
$147,890
0
$0
1
$43,050
1
$82,950
APPLICATIONS WITHDRAWN
0
$0
1
$158,040
6
$182,498
0
$0
0
$0
0
$0
FILES CLOSED FOR INCOMPLETENESS
0
$0
0
$0
1
$65,350
0
$0
0
$0
0
$0
Aggregated Statistics For Year 2008 (Based on 2 partial tracts)
A) FHA, FSA/RHS & VA Home Purchase Loans
B) Conventional Home Purchase Loans
C) Refinancings
D) Home Improvement Loans
F) Non-occupant Loans on < 5 Family Dwellings (A B C & D)
G) Loans On Manufactured Home Dwelling (A B C & D)
Number
Average Value
Number
Average Value
Number
Average Value
Number
Average Value
Number
Average Value
Number
Average Value
LOANS ORIGINATED
3
$125,260
9
$166,491
20
$145,333
2
$98,815
2
$157,415
1
$87,030
APPLICATIONS APPROVED, NOT ACCEPTED
0
$0
0
$0
6
$90,437
0
$0
0
$0
0
$0
APPLICATIONS DENIED
0
$0
3
$89,967
13
$139,239
2
$11,470
0
$0
0
$0
APPLICATIONS WITHDRAWN
0
$0
1
$142,020
6
$128,088
1
$76,350
0
$0
0
$0
FILES CLOSED FOR INCOMPLETENESS
1
$61,900
0
$0
1
$84,830
0
$0
0
$0
0
$0
Aggregated Statistics For Year 2007 (Based on 2 partial tracts)
A) FHA, FSA/RHS & VA Home Purchase Loans
B) Conventional Home Purchase Loans
C) Refinancings
D) Home Improvement Loans
F) Non-occupant Loans on < 5 Family Dwellings (A B C & D)
G) Loans On Manufactured Home Dwelling (A B C & D)
Number
Average Value
Number
Average Value
Number
Average Value
Number
Average Value
Number
Average Value
Number
Average Value
LOANS ORIGINATED
3
$96,773
13
$130,175
24
$110,480
7
$47,400
2
$38,330
1
$139,820
APPLICATIONS APPROVED, NOT ACCEPTED
1
$70,070
0
$0
7
$92,060
1
$11,630
0
$0
1
$50,900
APPLICATIONS DENIED
1
$102,430
3
$118,977
20
$101,974
6
$81,378
2
$60,955
1
$34,250
APPLICATIONS WITHDRAWN
0
$0
2
$75,880
9
$92,514
2
$62,525
0
$0
0
$0
FILES CLOSED FOR INCOMPLETENESS
0
$0
0
$0
2
$117,355
0
$0
0
$0
0
$0
Aggregated Statistics For Year 2006 (Based on 2 partial tracts)
A) FHA, FSA/RHS & VA Home Purchase Loans
B) Conventional Home Purchase Loans
C) Refinancings
D) Home Improvement Loans
F) Non-occupant Loans on < 5 Family Dwellings (A B C & D)
G) Loans On Manufactured Home Dwelling (A B C & D)
Number
Average Value
Number
Average Value
Number
Average Value
Number
Average Value
Number
Average Value
Number
Average Value
LOANS ORIGINATED
1
$98,030
22
$133,435
29
$114,076
7
$42,507
3
$114,683
3
$93,317
APPLICATIONS APPROVED, NOT ACCEPTED
0
$0
2
$103,845
8
$117,315
1
$42,420
0
$0
0
$0
APPLICATIONS DENIED
0
$0
4
$156,158
29
$132,007
8
$75,879
0
$0
1
$80,440
APPLICATIONS WITHDRAWN
1
$57,810
2
$147,675
10
$126,937
1
$53,100
2
$120,025
0
$0
FILES CLOSED FOR INCOMPLETENESS
0
$0
1
$102,740
6
$146,627
0
$0
0
$0
1
$49,640
Aggregated Statistics For Year 2005 (Based on 2 partial tracts)
A) FHA, FSA/RHS & VA Home Purchase Loans
B) Conventional Home Purchase Loans
C) Refinancings
D) Home Improvement Loans
F) Non-occupant Loans on < 5 Family Dwellings (A B C & D)
G) Loans On Manufactured Home Dwelling (A B C & D)
Number
Average Value
Number
Average Value
Number
Average Value
Number
Average Value
Number
Average Value
Number
Average Value
LOANS ORIGINATED
2
$96,775
20
$140,290
33
$142,466
5
$24,130
3
$67,030
2
$75,565
APPLICATIONS APPROVED, NOT ACCEPTED
1
$62,530
1
$64,100
7
$99,826
1
$20,420
1
$62,210
1
$62,530
APPLICATIONS DENIED
0
$0
4
$117,902
24
$103,385
4
$48,150
3
$106,933
4
$73,915
APPLICATIONS WITHDRAWN
0
$0
3
$99,600
16
$107,614
2
$73,525
2
$88,135
0
$0
FILES CLOSED FOR INCOMPLETENESS
0
$0
1
$99,920
5
$124,298
1
$17,280
0
$0
0
$0
Aggregated Statistics For Year 2004 (Based on 2 partial tracts)
A) FHA, FSA/RHS & VA Home Purchase Loans
B) Conventional Home Purchase Loans
C) Refinancings
D) Home Improvement Loans
F) Non-occupant Loans on < 5 Family Dwellings (A B C & D)
G) Loans On Manufactured Home Dwelling (A B C & D)
Number
Average Value
Number
Average Value
Number
Average Value
Number
Average Value
Number
Average Value
Number
Average Value
LOANS ORIGINATED
1
$80,440
19
$108,151
36
$112,231
8
$51,058
2
$41,315
1
$77,290
APPLICATIONS APPROVED, NOT ACCEPTED
0
$0
5
$79,430
8
$115,351
2
$18,065
0
$0
2
$73,680
APPLICATIONS DENIED
1
$55,930
7
$88,650
26
$95,662
4
$27,965
2
$56,555
3
$32,257
APPLICATIONS WITHDRAWN
0
$0
3
$107,980
16
$96,282
2
$58,755
1
$94,570
0
$0
FILES CLOSED FOR INCOMPLETENESS
0
$0
1
$86,090
2
$96,145
0
$0
0
$0
0
$0
Aggregated Statistics For Year 2003 (Based on 2 partial tracts)
A) FHA, FSA/RHS & VA Home Purchase Loans
B) Conventional Home Purchase Loans
C) Refinancings
D) Home Improvement Loans
F) Non-occupant Loans on < 5 Family Dwellings (A B C & D)
Number
Average Value
Number
Average Value
Number
Average Value
Number
Average Value
Number
Average Value
LOANS ORIGINATED
4
$75,642
13
$104,194
68
$109,351
4
$61,505
4
$71,245
APPLICATIONS APPROVED, NOT ACCEPTED
0
$0
2
$109,340
9
$133,430
1
$23,250
0
$0
APPLICATIONS DENIED
0
$0
2
$78,080
25
$105,433
2
$35,190
2
$40,375
APPLICATIONS WITHDRAWN
0
$0
1
$117,200
13
$90,780
0
$0
0
$0
FILES CLOSED FOR INCOMPLETENESS
0
$0
0
$0
4
$118,690
0
$0
0
$0
Aggregated Statistics For Year 2002 (Based on 2 partial tracts)
A) FHA, FSA/RHS & VA Home Purchase Loans
B) Conventional Home Purchase Loans
C) Refinancings
D) Home Improvement Loans
F) Non-occupant Loans on < 5 Family Dwellings (A B C & D)
Number
Average Value
Number
Average Value
Number
Average Value
Number
Average Value
Number
Average Value
LOANS ORIGINATED
4
$92,298
12
$104,838
52
$105,728
7
$17,730
2
$69,750
APPLICATIONS APPROVED, NOT ACCEPTED
0
$0
2
$71,480
11
$103,515
0
$0
0
$0
APPLICATIONS DENIED
1
$77,610
3
$90,070
24
$83,826
4
$12,725
0
$0
APPLICATIONS WITHDRAWN
0
$0
1
$165,270
14
$101,913
1
$6,910
0
$0
FILES CLOSED FOR INCOMPLETENESS
0
$0
1
$101,490
3
$80,750
0
$0
0
$0
Aggregated Statistics For Year 2001 (Based on 2 partial tracts)
A) FHA, FSA/RHS & VA Home Purchase Loans
B) Conventional Home Purchase Loans
C) Refinancings
D) Home Improvement Loans
F) Non-occupant Loans on < 5 Family Dwellings (A B C & D)
Number
Average Value
Number
Average Value
Number
Average Value
Number
Average Value
Number
Average Value
LOANS ORIGINATED
5
$99,852
11
$118,425
44
$96,202
5
$23,816
1
$82,320
APPLICATIONS APPROVED, NOT ACCEPTED
0
$0
1
$101,490
8
$74,859
1
$39,900
0
$0
APPLICATIONS DENIED
0
$0
3
$56,033
22
$80,678
5
$20,424
1
$30,160
APPLICATIONS WITHDRAWN
0
$0
1
$43,990
18
$86,614
1
$69,120
0
$0
FILES CLOSED FOR INCOMPLETENESS
0
$0
0
$0
3
$100,440
0
$0
0
$0
Aggregated Statistics For Year 2000 (Based on 2 partial tracts)
A) FHA, FSA/RHS & VA Home Purchase Loans
B) Conventional Home Purchase Loans
C) Refinancings
D) Home Improvement Loans
F) Non-occupant Loans on < 5 Family Dwellings (A B C & D)
Number
Average Value
Number
Average Value
Number
Average Value
Number
Average Value
Number
Average Value
LOANS ORIGINATED
4
$101,722
10
$125,743
17
$96,995
5
$25,890
0
$0
APPLICATIONS APPROVED, NOT ACCEPTED
0
$0
2
$43,515
5
$68,308
1
$18,220
1
$21,680
APPLICATIONS DENIED
0
$0
18
$36,168
12
$59,750
6
$28,383
0
$0
APPLICATIONS WITHDRAWN
0
$0
2
$97,400
7
$75,991
0
$0
0
$0
FILES CLOSED FOR INCOMPLETENESS
0
$0
0
$0
1
$57,500
0
$0
0
$0
Aggregated Statistics For Year 1999 (Based on 1 partial tract)
A) FHA, FSA/RHS & VA Home Purchase Loans
B) Conventional Home Purchase Loans
C) Refinancings
D) Home Improvement Loans
F) Non-occupant Loans on < 5 Family Dwellings (A B C & D)
Detailed PMIC statistics for the following Tracts:7109.00
2002 - 2018 National Fire Incident Reporting System (NFIRS) incidents
According to the data from the years 2002 - 2018 the average number of fires per year is 16. The highest number of fire incidents - 40 took place in 2009, and the least - 0 in 2012. The data has a rising trend.
When looking into fire subcategories, the most reports belonged to: Outside Fires (45.0%), and Structure Fires (31.2%).
Fire incident types reported to NFIRS in Zip Code 47272


+$756
-$2,212
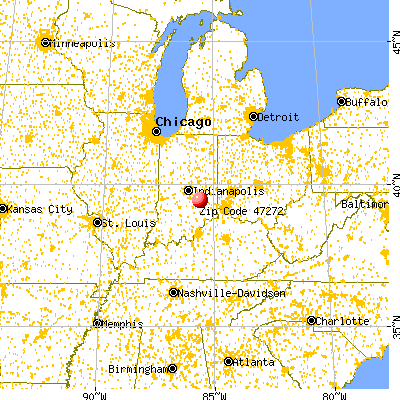
 Nearest zip codes: 46182, 46150, 46156, 47234, 47240, 46146.


 According to the data from the years 2002 - 2018 the average number of fires per year is 16. The highest number of fire incidents - 40 took place in 2009, and the least - 0 in 2012. The data has a rising trend.
 When looking into fire subcategories, the most reports belonged to: Outside Fires (45.0%), and Structure Fires (31.2%).