Estimated zip code population in 2022: 1,446 Zip code population in 2010: 1,433 Zip code population in 2000: 1,434
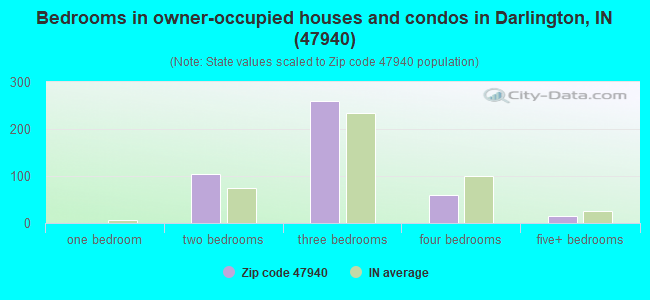
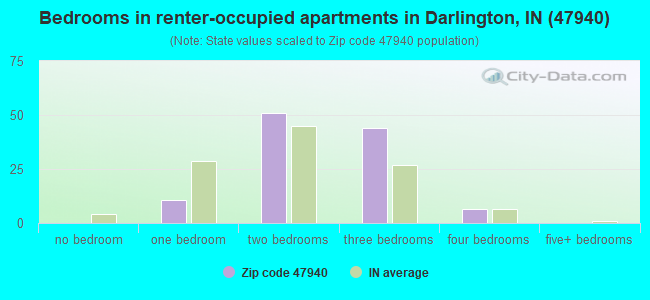
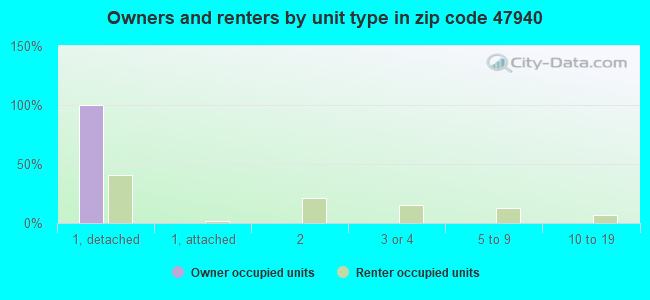
Houses and condos: 612 Renter-occupied apartments: 112
% of renters here:
20%
State:
29%
March 2022 cost of living index in zip code 47940: 84.8 (less than average, U.S. average is 100)
Land area: 40.8 sq. mi. Water area: 0.0 sq. mi.
Population density: 35 people per square mile
(very low).
OSM Map
General Map
Google Map
MSN Map
OSM Map
General Map
Google Map
MSN Map
OSM Map
General Map
Google Map
MSN Map
OSM Map
General Map
Google Map
MSN Map
Please wait while loading the map...
Real estate property taxes paid for housing units in 2022:
This zip code:
0.6% ($884)
Indiana:
0.7% ($1,467)
Median real estate property taxes paid for housing units with mortgages in 2022: $881 (0.6%) Median real estate property taxes paid for housing units with no mortgage in 2022: $930 (0.5%)
Business Search- 14 Million verified businesses
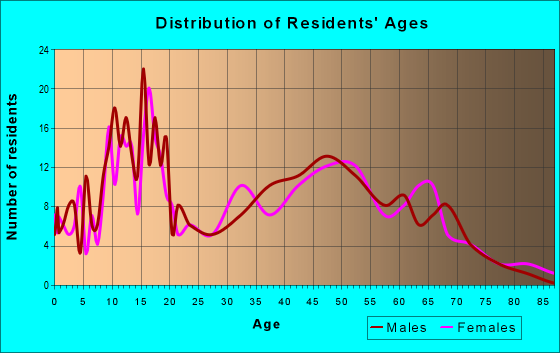
Males: 768
(53.2%)
Females: 677
(46.8%)
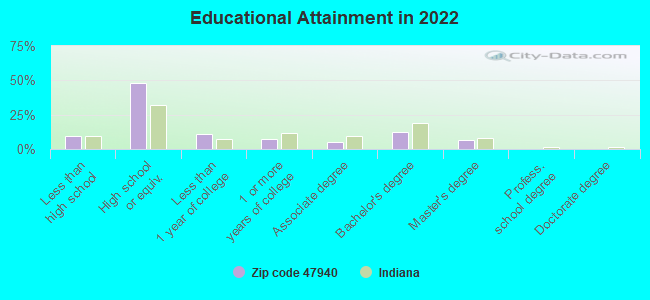
For population 25 years and over in 47940:
High school or higher: 90.2%
Bachelor's degree or higher: 19.2%
Graduate or professional degree: 6.6%
Unemployed: 1.3%
Mean travel time to work (commute): 28.2 minutes
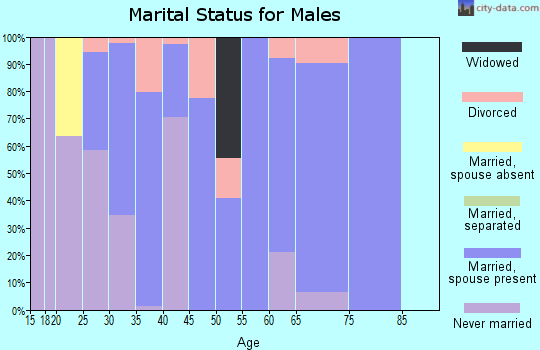
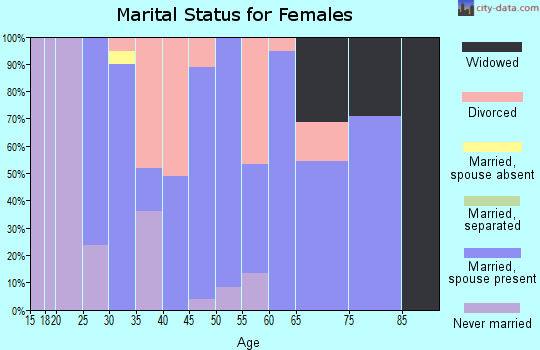
For population 15 years and over in 47940:
Never married: 23.0%
Now married: 62.5%
Separated: 2.3%
Widowed: 4.1%
Divorced: 8.0%
Zip code 47940 compared to state average:
Unemployed percentage below state average.
Black race population percentage significantly below state average.
Hispanic race population percentage below state average.
Median age above state average.
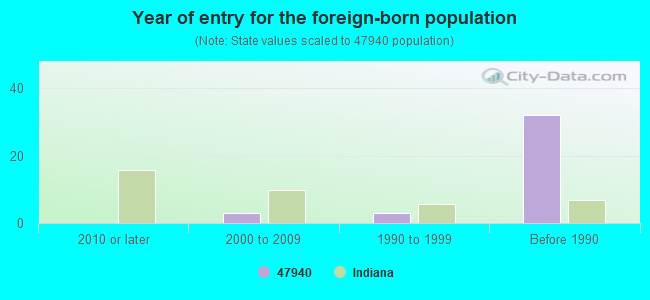
Foreign-born population percentage significantly below state average.
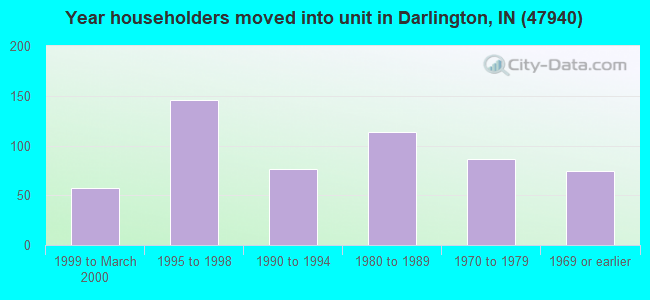
Length of stay since moving in significantly above state average.
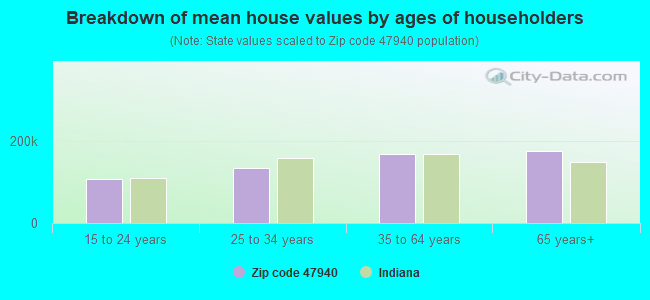
Estimated median house/condo value in 2022: $155,275
47940:
$155,275
Indiana:
$208,700
Median resident age:
This zip code:
42.5 years
Indiana median age:
38.2 years
Average household size:
This zip code:
2.6 people
Indiana:
2.4 people
Averages for the 2020 tax year for zip code 47940, filed in 2021:
Average Adjusted Gross Income (AGI) in 2020: $58,731 (Individual Income Tax Returns)
Here:
$58,731
State:
$64,978
Salary/wage: $51,075 (reported on 84.3% of returns)
Here:
$51,075
State:
$55,245
(% of AGI for various income ranges: 1269.2% for AGIs below $25k, 3322.0% for AGIs $25k-50k, 7007.0% for AGIs $50k-75k, 9184.3% for AGIs $75k-100k, 16775.0% for AGIs $100k-200k)
Taxable interest for individuals: $588 (reported on 22.9% of returns)
This zip code:
$588
Indiana:
$1,351
(% of AGI for various income ranges: 8.5% for AGIs below $25k, 13.3% for AGIs $25k-50k, 11.0% for AGIs $50k-75k, 14.3% for AGIs $75k-100k, 70.0% for AGIs $100k-200k)
Ordinary dividends: $1,111 (reported on 12.9% of returns)
Here:
$1,111
State:
$5,827
(% of AGI for various income ranges: 25.3% for AGIs $25k-50k, 18.0% for AGIs $50k-75k, 73.3% for AGIs $100k-200k)
Net capital gain/loss in AGI: +$7,188 (reported on 11.4% of returns)
Here:
+$7,188
State:
+$17,730
(% of AGI for various income ranges: 40.0% for AGIs below $25k, 14.0% for AGIs $50k-75k, 848.3% for AGIs $100k-200k)
Profit/loss from business: +$9,871 (reported on 10.0% of returns)
Here:
+$9,871
State:
+$12,144
(% of AGI for various income ranges: 356.0% for AGIs $25k-50k, 224.3% for AGIs $75k-100k)
Taxable individual retirement arrangement distribution: $9,500 (reported on 10.0% of returns)
47940:
$9,500
Indiana:
$18,302
(% of AGI for various income ranges: 178.0% for AGIs $25k-50k, 398.0% for AGIs $50k-75k)
Total itemized deductions: $27,850 (reported on 2.9% of returns)
Here:
$27,850
State:
$35,601
(% of AGI for various income ranges: 371.3% for AGIs $25k-50k)
Taxes paid: $5,667 (reported on 4.3% of returns)
47940:
$5,667
State:
$7,542
(% of AGI for various income ranges: 170.0% for AGIs $50k-75k)
Earned income credit: $2,100 (reported on 12.9% of returns)
Here:
$2,100
State:
$2,298
(% of AGI for various income ranges: 75.4% for AGIs below $25k, 60.7% for AGIs $25k-50k)
Percentage of individuals using paid preparers for their 2020 taxes: 97.1%
Here:
97%
State:
94%
(% for various income ranges: 94.7% for AGIs below $25k, 94.4% for AGIs $25k-50k, 100.0% for AGIs $50k-75k, 100.0% for AGIs $75k-100k, 100.0% for AGIs $100k-200k)
Averages for the 2012 tax year for zip code 47940, filed in 2013:
Average Adjusted Gross Income (AGI) in 2012: $47,387 (Individual Income Tax Returns)
Here:
$47,387
State:
$52,932
Salary/wage: $39,771 (reported on 87.3% of returns)
Here:
$39,771
State:
$45,173
(% of AGI for various income ranges: 76.7% for AGIs below $25k, 87.6% for AGIs $25k-50k, 82.0% for AGIs $50k-75k, 84.8% for AGIs $75k-100k, 48.8% for AGIs $100k-200k)
Taxable interest for individuals: $375 (reported on 28.2% of returns)
This zip code:
$375
Indiana:
$1,311
(% of AGI for various income ranges: 0.5% for AGIs below $25k, 0.2% for AGIs $25k-50k, 0.2% for AGIs $50k-75k, 0.1% for AGIs $75k-100k, 0.2% for AGIs $100k-200k)
Ordinary dividends: $978 (reported on 12.7% of returns)
Here:
$978
State:
$4,690
(% of AGI for various income ranges: 0.8% for AGIs below $25k, 0.6% for AGIs $50k-75k, 0.1% for AGIs $100k-200k)
Net capital gain/loss in AGI: +$6,420 (reported on 7.0% of returns)
Here:
+$6,420
State:
+$10,406
Profit/loss from business: +$6,333 (reported on 12.7% of returns)
Here:
+$6,333
State:
+$11,105
(% of AGI for various income ranges: 7.0% for AGIs below $25k, 1.8% for AGIs $50k-75k, 3.1% for AGIs $75k-100k)
Taxable individual retirement arrangement distribution: $4,300 (reported on 5.6% of returns)
47940:
$4,300
Indiana:
$13,841
Total itemized deductions: $18,075 (19% of AGI, reported on 16.9% of returns)
Here:
$18,075
State:
$20,913
Here:
19.1% of AGI
State:
18.2% of AGI
(% of AGI for various income ranges: 6.7% for AGIs $25k-50k, 5.6% for AGIs $50k-75k, 5.7% for AGIs $75k-100k, 9.6% for AGIs $100k-200k)
Charity contributions: $3,540 (reported on 14.1% of returns)
Here:
$3,540
State:
$4,697
(% of AGI for various income ranges: 1.4% for AGIs below $25k, 1.7% for AGIs $50k-75k, 1.7% for AGIs $100k-200k)
Taxes paid: $5,958 (reported on 16.9% of returns)
47940:
$5,958
State:
$7,456
(% of AGI for various income ranges: 1.3% for AGIs $25k-50k, 1.3% for AGIs $50k-75k, 2.0% for AGIs $75k-100k, 4.1% for AGIs $100k-200k)
Earned income credit: $2,373 (reported on 15.5% of returns)
Here:
$2,373
State:
$2,265
(% of AGI for various income ranges: 6.6% for AGIs below $25k, 0.8% for AGIs $25k-50k)
Percentage of individuals using paid preparers for their 2012 taxes: 57.7%
Here:
58%
State:
53%
(% for various income ranges: 51.7% for AGIs below $25k, 56.2% for AGIs $25k-50k, 61.5% for AGIs $50k-75k, 57.1% for AGIs $75k-100k, 83.3% for AGIs $100k-200k)
Averages for the 2004 tax year for zip code 47940, filed in 2005:
Average Adjusted Gross Income (AGI) in 2004: $38,158 (Individual Income Tax Returns)
Here:
$38,158
State:
$44,790
Salary/wage: $36,539 (reported on 88.9% of returns)
Here:
$36,539
State:
$39,615
(% of AGI for various income ranges: 78.9% for AGIs below $10k, 74.2% for AGIs $10k-25k, 90.4% for AGIs $25k-50k, 87.5% for AGIs $50k-75k, 85.4% for AGIs $75k-100k, 73.6% for AGIs over 100k)
Taxable interest for individuals: $741 (reported on 42.2% of returns)
This zip code:
$741
Indiana:
$1,535
(% of AGI for various income ranges: 6.7% for AGIs below $10k, 2.8% for AGIs $10k-25k, 0.5% for AGIs $25k-50k, 0.6% for AGIs $50k-75k, 0.3% for AGIs $75k-100k, 0.4% for AGIs over 100k)
Taxable dividends: $412 (reported on 16.8% of returns)
Here:
$412
State:
$2,998
(% of AGI for various income ranges: 0.4% for AGIs $10k-25k, 0.2% for AGIs $25k-50k, 0.2% for AGIs $50k-75k, 0.1% for AGIs $75k-100k, 0.1% for AGIs over 100k)
Net capital gain/loss: +$397 (reported on 8.6% of returns)
Here:
+$397
State:
+$8,619
(% of AGI for various income ranges: -0.9% for AGIs below $10k, 0.1% for AGIs $25k-50k, 0.2% for AGIs $50k-75k, 0.2% for AGIs $75k-100k)
Profit/loss from business: +$5,416 (reported on 13.1% of returns)
Here:
+$5,416
State:
+$10,071
(% of AGI for various income ranges: 6.5% for AGIs $10k-25k, 2.0% for AGIs $25k-50k, 1.7% for AGIs $50k-75k, 0.8% for AGIs $75k-100k)
IRA payment deduction: $1,375 (reported on 2.4% of returns)
47940:
$1,375
Indiana:
$2,840
Total itemized deductions: $13,016 (22% of AGI, reported on 27.7% of returns)
Here:
$13,016
State:
$17,065
Here:
21.9% of AGI
State:
19.5% of AGI
(% of AGI for various income ranges: 11.3% for AGIs $10k-25k, 6.8% for AGIs $25k-50k, 9.7% for AGIs $50k-75k, 13.3% for AGIs $75k-100k, 9.6% for AGIs over 100k)
Charity contributions deductions: $2,625 (4% of AGI, reported on 20.1% of returns)
Here:
$2,625
State:
$3,550
Here:
4.1% of AGI
State:
3.8% of AGI
(% of AGI for various income ranges: 0.4% for AGIs $10k-25k, 0.8% for AGIs $25k-50k, 1.3% for AGIs $50k-75k, 2.8% for AGIs $75k-100k, 1.8% for AGIs over 100k)
Total tax: $4,184 (reported on 74.5% of returns)
47940:
$4,184
State:
$6,914
(% of AGI for various income ranges: 1.4% for AGIs below $10k, 4.1% for AGIs $10k-25k, 6.4% for AGIs $25k-50k, 8.1% for AGIs $50k-75k, 10.4% for AGIs $75k-100k, 14.7% for AGIs over 100k)
Earned income credit: $1,564 (reported on 13.9% of returns)
Here:
$1,564
State:
$1,685
Percentage of individuals using paid preparers for their 2004 taxes: 65.0%
Here:
65%
State:
59%
(% for various income ranges: 55.5% for AGIs below $10k, 71.8% for AGIs $10k-25k, 65.6% for AGIs $25k-50k, 64.5% for AGIs $50k-75k, 66.7% for AGIs $75k-100k, 71.4% for AGIs over 100k)
Likely homosexual households (counted as self-reported same-sex unmarried-partner households)
Lesbian couples: 1.9% of all households
Gay men: 0.0% of all households
Household received Food Stamps/SNAP in the past 12 months: 35 Household did not receive Food Stamps/SNAP in the past 12 months: 515
Women who had a birth in the past 12 months: 6 (0 now married, 5 unmarried) Women who did not have a birth in the past 12 months: 316 (214 now married, 103 unmarried)
Housing units in zip code 47940 with a mortgage: 232 (37 second mortgage, 10 home equity loan, 28 both second mortgage and home equity loan) Median monthly owner costs for units with a mortgage: $1,164 Median monthly owner costs for units without a mortgage: $492
Residents with income below the poverty level in 2022:
This zip code:
6.9%
Whole state:
12.6%
Residents with income below 50% of the poverty level in 2022:
This zip code:
1.3%
Whole state:
6.3%
Median number of rooms in houses and condos:
Here:
7.0
State:
6.6
Median number of rooms in apartments:
Here:
4.8
State:
4.3
Notable locations in this zip code not listed on our city pages
Size of family households: 171 2-persons, 99 3-persons, 56 4-persons, 21 5-persons, 24 6-persons, 13 7-or-more-persons
Size of nonfamily households: 144 1-person, 21 2-persons
173 married couples with children.
49 single-parent households (49 women).
95.8% of residents of 47940 zip code speak English at home.
2.7% of residents speak Spanish at home (78% very well, 6% well, 14% not well, 3% not at all).
0.2% of residents speak other Indo-European language at home (100% very well).
0.5% of residents speak Asian or Pacific Island language at home (100% very well).
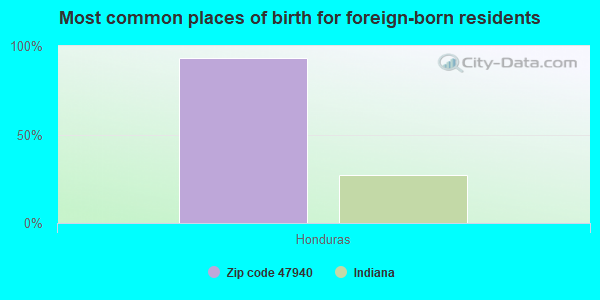
Foreign born population: 30 (2.1%) (0.0% of them are naturalized citizens)
:
2.1%
Whole state:
6.1%
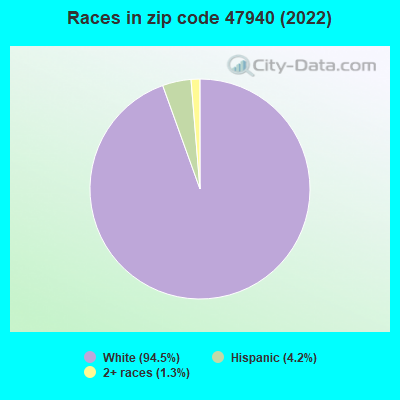
93%Honduras
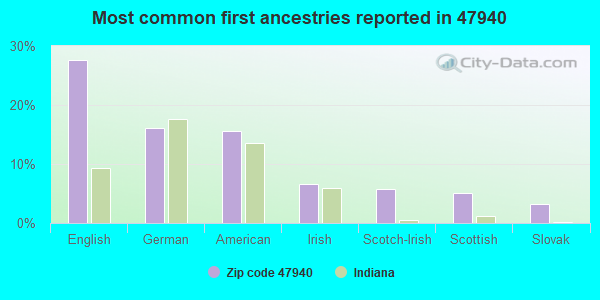
28%English
16%German
16%American
7%Irish
6%Scotch-Irish
5%Scottish
3%Slovak
Year of entry for the foreign-born population
02010 or later
32000 to 2009
31990 to 1999
32Before 1990
Facilities with environmental interests located in this zip code:
AMERITECH (FRANKLIN ST & MAIN ST in DARLINGTON, IN)
STATE MASTER (Indiana facility tracking) - CRTK-6497, EPCRA (Resource Conservation and Recovery Act (tracking hazardous waste)) Organizations: INDIANA BELL TELEPHONE CO INC (CONTACT/OWNER)
Alternative names: IND BELL TEL CO DARLINGTON 794 OFF
DARLINGTON MUNICIPAL WWTP (SR 47 & MADISON ST in DARLINGTON, IN)
STATE MASTER (Indiana facility tracking) - CRTK-491, EPCRA National Pollutant Discharge Elimination System NON-MAJOR (Tracking pollutant discharge elimination systems) - permit Business SIC classification: SEWERAGE SYSTEMS Organizations: RICHARD SMITH CERT OPER (CONTACT/OPERATOR)
, TOWN COUNCIL PRESIDENT (CONTACT/OWNER)
Alternative names: DARLINGTON MUNICIPAL STP, DARLINTON MUNICIPAL WWTP
DARLINGTON POWER & LIGHT (104 FRANKLIN ST in DARLINGTON, IN)
STATE MASTER (Indiana facility tracking) - UST-11321, UNDERGROUND STORAGE TANK PROGRAM, UST-21334, COMPLIANCE ACTIVITY (Tracking inspections of insecticide, fungicide, and rodenticide, and toxic substances) Business SIC classification: REGULATION AND ADMINISTRATION OF COMMUNICATIONS, ELECTRIC, GAS, AND OTHER UTILITIES
B&H INDUSTRIES (609 SOUTH ST in DARLINGTON, IN)
(Resource Conservation and Recovery Act (tracking hazardous waste))
Housing units lacking complete plumbing facilities: 0.5% Housing units lacking complete kitchen facilities: 5.1%
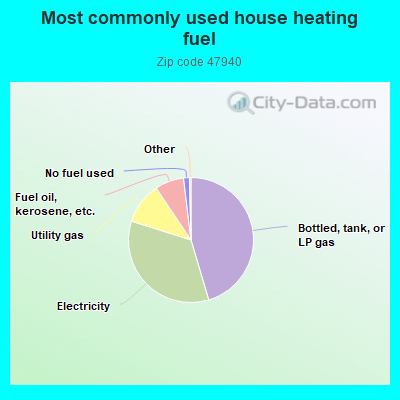
45.6%Bottled, tank, or LP gas
34.6%Electricity
10.8%Utility gas
7.5%Fuel oil, kerosene, etc.
1.5%No fuel used
Population in 1990: 1,941.
Place of birth for U.S.-born residents:
This state: 1,120
Northeast: 37
Midwest: 113
South: 108
West: 14
61% of the 47940 zip code residents lived in the same house 5 years ago. Out of people who lived in different houses, 68% lived in this county. Out of people who lived in different counties, 50% lived in Indiana.
95% of the 47940 zip code residents lived in the same house 1 year ago. Out of people who lived in different houses, 37% moved from this county. Out of people who lived in different houses, 57% moved from different county within same state. Out of people who lived in different houses, 16% moved from different state.
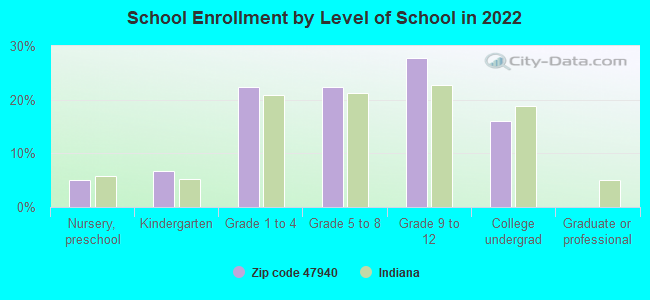
Private vs. public school enrollment:
Students in private schools in grades 1 to 8 (elementary and middle school): 29
Here:
25.8%
Indiana:
14.9%
Students in private schools in grades 9 to 12 (high school):
Here:
0.0%
Indiana:
11.4%
Students in private undergraduate colleges:
Here:
0.0%
Indiana:
22.3%
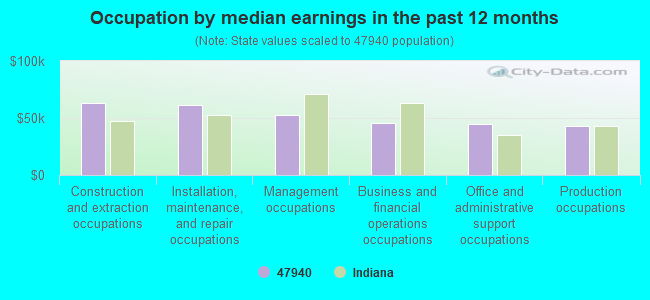
Occupation by median earnings in the past 12 months ($)
63,250Construction and extraction occupations
61,792Installation, maintenance, and repair occupations
52,721Management occupations
45,731Business and financial operations occupations
44,936Office and administrative support occupations
43,105Production occupations
Top industries in this zip code by the number of employees in 2005:
Construction: Commercial and Institutional Building Construction (10-19 employees: 1 establishment)
Construction: Water and Sewer Line and Related Structures Construction (1-4: 3)
Construction: Plumbing, Heating, and Air-Conditioning Contractors (1-4: 2)
Other Services (except Public Administration): Religious Organizations (1-4: 2)
Professional, Scientific, and Technical Services: Engineering Services (1-4: 1)
Construction: All Other Specialty Trade Contractors (1-4: 1)
2002 - 2018 National Fire Incident Reporting System (NFIRS) incidents
Based on the data from the years 2002 - 2018 the average number of fires per year is 15. The highest number of reported fire incidents - 39 took place in 2010, and the least - 1 in 2014. The data has a decreasing trend.
When looking into fire subcategories, the most incidents belonged to: Structure Fires (44.0%), and Outside Fires (44.0%).
Fire incident types reported to NFIRS in Zip Code 47940
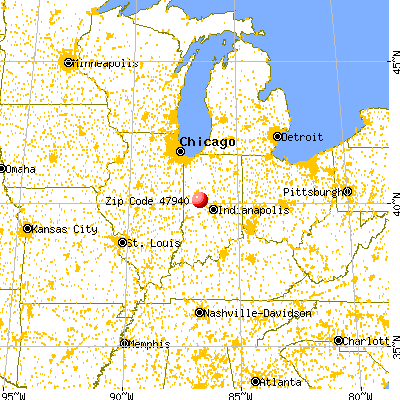


 Nearest zip codes: 46035, 47930, 46071, 47955, 47968, 47983.


 Based on the data from the years 2002 - 2018 the average number of fires per year is 15. The highest number of reported fire incidents - 39 took place in 2010, and the least - 1 in 2014. The data has a decreasing trend.
 When looking into fire subcategories, the most incidents belonged to: Structure Fires (44.0%), and Outside Fires (44.0%).