Estimated zip code population in 2022: 2,031 Zip code population in 2010: 1,865 Zip code population in 2000: 1,841
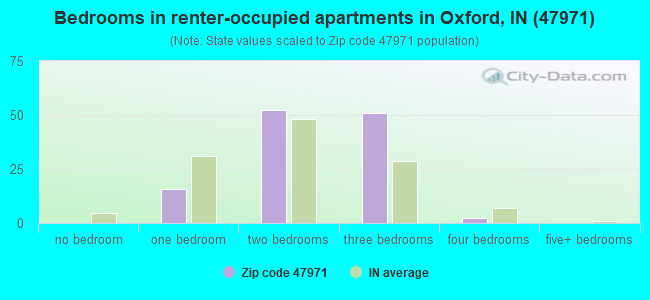
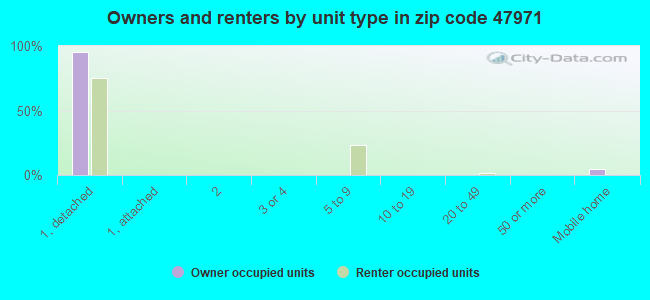
Houses and condos: 864 Renter-occupied apartments: 121
% of renters here:
15%
State:
29%
March 2022 cost of living index in zip code 47971: 85.1 (less than average, U.S. average is 100)
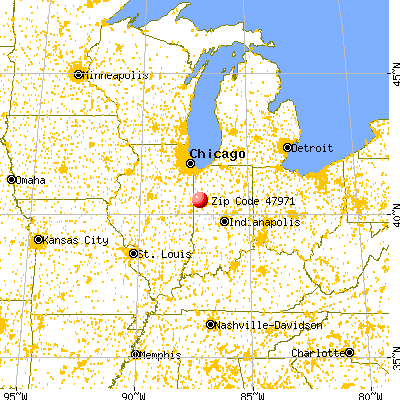
Land area: 55.6 sq. mi. Water area: 0.0 sq. mi.
Population density: 37 people per square mile
(very low).
OSM Map
General Map
Google Map
MSN Map
OSM Map
General Map
Google Map
MSN Map
OSM Map
General Map
Google Map
MSN Map
OSM Map
General Map
Google Map
MSN Map
Please wait while loading the map...
Real estate property taxes paid for housing units in 2022:
This zip code:
0.6% ($859)
Indiana:
0.7% ($1,467)
Median real estate property taxes paid for housing units with mortgages in 2022: $869 (0.6%) Median real estate property taxes paid for housing units with no mortgage in 2022: $862 (0.6%)
Business Search- 14 Million verified businesses
Males: 945
(46.5%)
Females: 1,086
(53.5%)
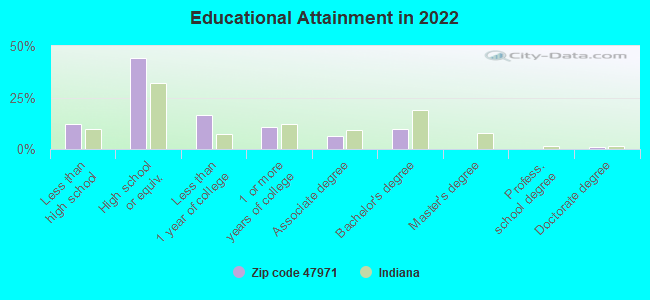
For population 25 years and over in 47971:
High school or higher: 86.0%
Bachelor's degree or higher: 10.5%
Graduate or professional degree: 1.0%
Unemployed: 3.9%
Mean travel time to work (commute): 23.6 minutes
For population 15 years and over in 47971:
Never married: 26.4%
Now married: 50.0%
Separated: 0.9%
Widowed: 4.0%
Divorced: 18.6%
Zip code 47971 compared to state average:
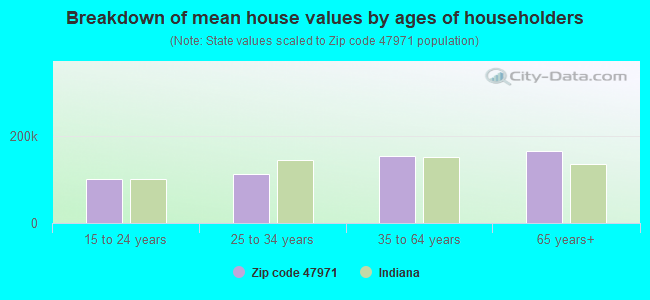
Median house value below state average.
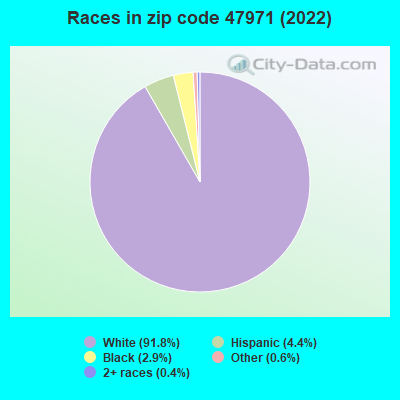
Black race population percentage significantly below state average.
Hispanic race population percentage below state average.
Foreign-born population percentage significantly below state average.
Renting percentage below state average.
Length of stay since moving in significantly above state average.
House age above state average.
Number of college students below state average.
Percentage of population with a bachelor's degree or higher significantly below state average.
Estimated median house/condo value in 2022: $136,064
47971:
$136,064
Indiana:
$208,700
Median resident age:
This zip code:
39.5 years
Indiana median age:
38.2 years
Average household size:
This zip code:
2.5 people
Indiana:
2.4 people
Averages for the 2020 tax year for zip code 47971, filed in 2021:
Average Adjusted Gross Income (AGI) in 2020: $51,180 (Individual Income Tax Returns)
Here:
$51,180
State:
$64,978
Salary/wage: $47,571 (reported on 83.0% of returns)
Here:
$47,571
State:
$55,245
(% of AGI for various income ranges: 1088.9% for AGIs below $25k, 3737.9% for AGIs $25k-50k, 6000.0% for AGIs $50k-75k, 9973.3% for AGIs $75k-100k, 17674.3% for AGIs $100k-200k)
Taxable interest for individuals: $641 (reported on 25.0% of returns)
This zip code:
$641
Indiana:
$1,351
(% of AGI for various income ranges: 12.1% for AGIs below $25k, 8.9% for AGIs $25k-50k, 26.7% for AGIs $50k-75k, 18.3% for AGIs $75k-100k, 82.9% for AGIs $100k-200k)
Ordinary dividends: $1,155 (reported on 12.5% of returns)
Here:
$1,155
State:
$5,827
(% of AGI for various income ranges: 14.7% for AGIs below $25k, 15.0% for AGIs $50k-75k, 115.7% for AGIs $100k-200k)
Net capital gain/loss in AGI: +$6,562 (reported on 9.1% of returns)
Here:
+$6,562
State:
+$17,730
(% of AGI for various income ranges: 26.7% for AGIs $50k-75k, 708.6% for AGIs $100k-200k)
Profit/loss from business: +$6,318 (reported on 12.5% of returns)
Here:
+$6,318
State:
+$12,144
(% of AGI for various income ranges: 98.9% for AGIs below $25k, 83.7% for AGIs $25k-50k, 103.3% for AGIs $50k-75k, 320.0% for AGIs $100k-200k)
Taxable individual retirement arrangement distribution: $8,150 (reported on 9.1% of returns)
47971:
$8,150
Indiana:
$18,302
(% of AGI for various income ranges: 64.2% for AGIs below $25k, 111.1% for AGIs $25k-50k, 531.7% for AGIs $75k-100k)
Earned income credit: $2,043 (reported on 15.9% of returns)
Here:
$2,043
State:
$2,298
(% of AGI for various income ranges: 74.2% for AGIs below $25k, 76.3% for AGIs $25k-50k)
Percentage of individuals using paid preparers for their 2020 taxes: 95.5%
Here:
95%
State:
94%
(% for various income ranges: 93.3% for AGIs below $25k, 95.7% for AGIs $25k-50k, 100.0% for AGIs $50k-75k, 100.0% for AGIs $75k-100k, 91.7% for AGIs $100k-200k)
Averages for the 2012 tax year for zip code 47971, filed in 2013:
Average Adjusted Gross Income (AGI) in 2012: $44,736 (Individual Income Tax Returns)
Here:
$44,736
State:
$52,932
Salary/wage: $38,363 (reported on 83.8% of returns)
Here:
$38,363
State:
$45,173
(% of AGI for various income ranges: 73.1% for AGIs below $25k, 78.3% for AGIs $25k-50k, 81.3% for AGIs $50k-75k, 76.6% for AGIs $75k-100k, 57.0% for AGIs $100k-200k)
Taxable interest for individuals: $542 (reported on 30.0% of returns)
This zip code:
$542
Indiana:
$1,311
(% of AGI for various income ranges: 0.8% for AGIs below $25k, 0.2% for AGIs $25k-50k, 0.5% for AGIs $50k-75k, 0.2% for AGIs $75k-100k, 0.3% for AGIs $100k-200k)
Ordinary dividends: $900 (reported on 16.2% of returns)
Here:
$900
State:
$4,690
(% of AGI for various income ranges: 0.1% for AGIs below $25k, 0.4% for AGIs $25k-50k, 0.1% for AGIs $50k-75k, 0.2% for AGIs $75k-100k, 0.6% for AGIs $100k-200k)
Net capital gain/loss in AGI: +$567 (reported on 7.5% of returns)
Here:
+$567
State:
+$10,406
Profit/loss from business: +$5,091 (reported on 13.8% of returns)
Here:
+$5,091
State:
+$11,105
(% of AGI for various income ranges: 5.8% for AGIs below $25k, 1.3% for AGIs $25k-50k, 2.2% for AGIs $50k-75k, 0.9% for AGIs $75k-100k)
Taxable individual retirement arrangement distribution: $9,086 (reported on 8.8% of returns)
47971:
$9,086
Indiana:
$13,841
Total itemized deductions: $16,007 (22% of AGI, reported on 18.8% of returns)
Here:
$16,007
State:
$20,913
Here:
21.7% of AGI
State:
18.2% of AGI
(% of AGI for various income ranges: 10.5% for AGIs $25k-50k, 4.8% for AGIs $50k-75k, 5.7% for AGIs $75k-100k, 8.7% for AGIs $100k-200k)
Charity contributions: $3,482 (reported on 13.8% of returns)
Here:
$3,482
State:
$4,697
(% of AGI for various income ranges: 0.8% for AGIs $25k-50k, 1.3% for AGIs $50k-75k, 2.1% for AGIs $100k-200k)
Taxes paid: $5,907 (reported on 17.5% of returns)
47971:
$5,907
State:
$7,456
(% of AGI for various income ranges: 1.7% for AGIs $25k-50k, 1.6% for AGIs $50k-75k, 2.1% for AGIs $75k-100k, 4.3% for AGIs $100k-200k)
Earned income credit: $2,093 (reported on 18.8% of returns)
Here:
$2,093
State:
$2,265
(% of AGI for various income ranges: 6.1% for AGIs below $25k, 1.0% for AGIs $25k-50k)
Percentage of individuals using paid preparers for their 2012 taxes: 53.8%
Here:
54%
State:
53%
(% for various income ranges: 45.5% for AGIs below $25k, 55.0% for AGIs $25k-50k, 53.8% for AGIs $50k-75k, 71.4% for AGIs $75k-100k, 71.4% for AGIs $100k-200k)
Averages for the 2004 tax year for zip code 47971, filed in 2005:
Average Adjusted Gross Income (AGI) in 2004: $35,959 (Individual Income Tax Returns)
Here:
$35,959
State:
$44,790
Salary/wage: $33,789 (reported on 85.6% of returns)
Here:
$33,789
State:
$39,615
(% of AGI for various income ranges: 120.5% for AGIs below $10k, 71.8% for AGIs $10k-25k, 81.2% for AGIs $25k-50k, 81.0% for AGIs $50k-75k, 84.5% for AGIs $75k-100k, 73.0% for AGIs over 100k)
Taxable interest for individuals: $994 (reported on 40.8% of returns)
This zip code:
$994
Indiana:
$1,535
(% of AGI for various income ranges: 8.9% for AGIs below $10k, 2.2% for AGIs $10k-25k, 0.8% for AGIs $25k-50k, 1.3% for AGIs $50k-75k, 0.5% for AGIs $75k-100k, 0.3% for AGIs over 100k)
Taxable dividends: $1,058 (reported on 19.1% of returns)
Here:
$1,058
State:
$2,998
(% of AGI for various income ranges: 2.5% for AGIs below $10k, 1.6% for AGIs $10k-25k, 0.5% for AGIs $25k-50k, 0.3% for AGIs $50k-75k, 0.4% for AGIs $75k-100k, 0.3% for AGIs over 100k)
Net capital gain/loss: +$3,146 (reported on 11.0% of returns)
Here:
+$3,146
State:
+$8,619
(% of AGI for various income ranges: 7.4% for AGIs below $10k, -0.1% for AGIs $10k-25k, -0.1% for AGIs $25k-50k, 0.3% for AGIs $50k-75k, 4.4% for AGIs $75k-100k)
Profit/loss from business: +$4,415 (reported on 13.1% of returns)
Here:
+$4,415
State:
+$10,071
(% of AGI for various income ranges: 6.0% for AGIs below $10k, 3.2% for AGIs $10k-25k, 0.9% for AGIs $25k-50k, 2.9% for AGIs $50k-75k)
Profit/loss from farming: +$7,050 (reported on 7.4% of returns)
Here:
+$7,050
State:
-$2,212
IRA payment deduction: $2,947 (reported on 2.4% of returns)
47971:
$2,947
Indiana:
$2,840
Total itemized deductions: $14,018 (23% of AGI, reported on 20.8% of returns)
Here:
$14,018
State:
$17,065
Here:
22.6% of AGI
State:
19.5% of AGI
(% of AGI for various income ranges: 6.4% for AGIs $10k-25k, 7.2% for AGIs $25k-50k, 8.0% for AGIs $50k-75k, 10.5% for AGIs $75k-100k, 10.0% for AGIs over 100k)
Charity contributions deductions: $1,948 (3% of AGI, reported on 14.4% of returns)
Here:
$1,948
State:
$3,550
Here:
2.9% of AGI
State:
3.8% of AGI
(% of AGI for various income ranges: 0.7% for AGIs $25k-50k, 0.6% for AGIs $50k-75k, 1.7% for AGIs $75k-100k, 1.2% for AGIs over 100k)
Total tax: $4,097 (reported on 73.9% of returns)
47971:
$4,097
State:
$6,914
(% of AGI for various income ranges: 3.1% for AGIs below $10k, 3.7% for AGIs $10k-25k, 6.9% for AGIs $25k-50k, 8.4% for AGIs $50k-75k, 9.7% for AGIs $75k-100k, 15.7% for AGIs over 100k)
Earned income credit: $1,690 (reported on 14.4% of returns)
Here:
$1,690
State:
$1,685
Percentage of individuals using paid preparers for their 2004 taxes: 58.9%
Here:
59%
State:
59%
(% for various income ranges: 44.4% for AGIs below $10k, 61.6% for AGIs $10k-25k, 64.7% for AGIs $25k-50k, 62.8% for AGIs $50k-75k, 59.3% for AGIs $75k-100k, 60.9% for AGIs over 100k)
Likely homosexual households (counted as self-reported same-sex unmarried-partner households)
Lesbian couples: 0.4% of all households
Gay men: 0.0% of all households
Household received Food Stamps/SNAP in the past 12 months: 80 Household did not receive Food Stamps/SNAP in the past 12 months: 720
Women who had a birth in the past 12 months: 6 (6 now married, 0 unmarried) Women who did not have a birth in the past 12 months: 447 (183 now married, 264 unmarried)
Housing units in zip code 47971 with a mortgage: 421 (45 second mortgage, 47 both second mortgage and home equity loan) Houses without a mortgage: 4
Median monthly owner costs for units with a mortgage: $1,036 Median monthly owner costs for units without a mortgage: $409
Residents with income below the poverty level in 2022:
This zip code:
16.4%
Whole state:
12.6%
Residents with income below 50% of the poverty level in 2022:
This zip code:
6.7%
Whole state:
6.3%
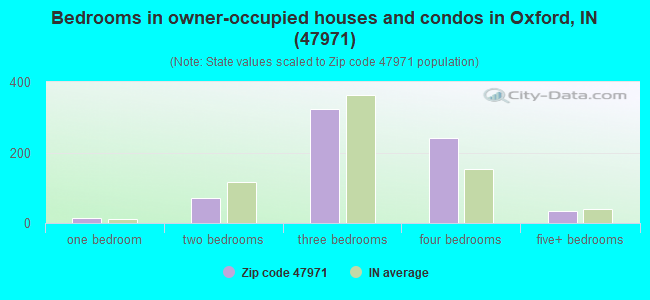
Median number of rooms in houses and condos:
Here:
6.9
State:
6.6
Median number of rooms in apartments:
Here:
5.5
State:
4.3
Notable locations in this zip code not listed on our city pages
In group quarters: 34 (-1 institutionalized population)
Size of family households: 232 2-persons, 124 3-persons, 74 4-persons, 70 5-persons, 14 6-persons, 2 7-or-more-persons
Size of nonfamily households: 178 1-person, 84 2-persons, 18 3-persons
263 married couples with children.
155 single-parent households (41 men, 114 women).
97.7% of residents of 47971 zip code speak English at home.
1.3% of residents speak Spanish at home (76% very well, 12% well, 12% not at all).
0.1% of residents speak other Indo-European language at home (100% very well).
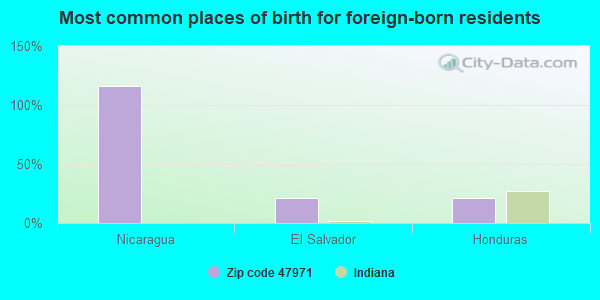
Foreign born population: 19 (1.0%) (62.3% of them are naturalized citizens)
This zip code:
1.0%
Whole state:
6.1%
116%Nicaragua
21%El Salvador
21%Honduras
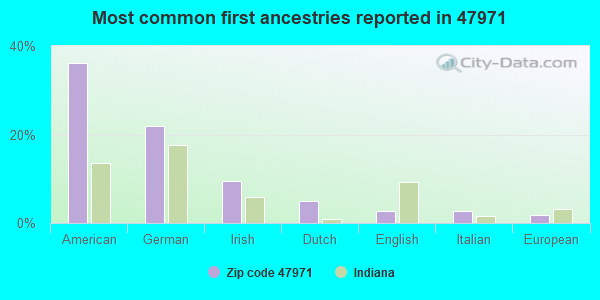
36%American
22%German
10%Irish
5%Dutch
3%English
3%Italian
2%European
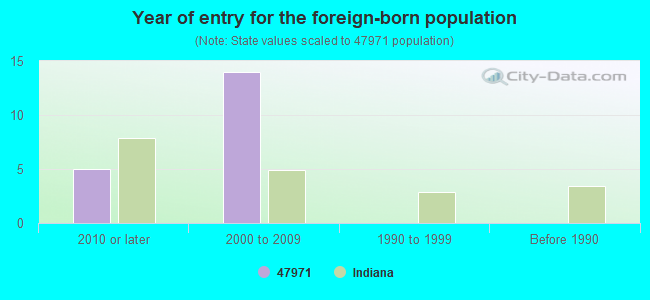
Year of entry for the foreign-born population
52010 or later
142000 to 2009
01990 to 1999
0Before 1990
Facilities with environmental interests located in this zip code:
BENTON CENTRAL JR SR HIGH SCHOOL (4241 EAST 300 SOUTH in OXFORD, IN)
STATE MASTER (Indiana facility tracking) - UST-11099, UNDERGROUND STORAGE TANK PROGRAM (National Center for Education Statistics) - STATE ID-0445 National Pollutant Discharge Elimination System NON-MAJOR (Tracking pollutant discharge elimination systems) - permit Business SIC classification: ELEMENTARY AND SECONDARY SCHOOLS Organizations: FRED J FLOOK 8371 (CONTACT/OPERATOR)
, BENTON COMMUNITY SCHOOL CORP (CONTACT/OWNER)
Alternative names: BENTON CENTRAL JR.-SR. H. S.
OXFORD UTILITIES (300 E WILSON in OXFORD, IN)
(Integrated Compliance Information System) - ICIS-05-1988-0299, FORMAL ENFORCEMENT ACTION STATE MASTER (Indiana facility tracking) - UST-7548, UNDERGROUND STORAGE TANK PROGRAM National Pollutant Discharge Elimination System NON-MAJOR (Tracking pollutant discharge elimination systems) - permit Business SIC classification: SEWERAGE SYSTEMS Organizations: ED MORRIS CERT OPER (CONTACT/OPERATOR)
, TOWN COUNCIL PRESIDENT (CONTACT/OWNER)
Alternative names: OXFORD MUNICIPAL STP, OXFORD MUNICIPAL WWTP, OXFORD MUNICIPAL WWTP SITE 1, TOWN OF OXFORD CSS
ASGROW SEED COMPANY (205 N MICHIGAN in OXFORD, IN)
AIR MINOR (AIRS/AFS) STATE MASTER (Indiana facility tracking) - ACES-OP-00700012, AIR PROGRAM, CRTK-10424, EPCRA (Resource Conservation and Recovery Act (tracking hazardous waste)) Business SIC classification: SOYBEANS; CROP PREPARATION SERVICES FOR MARKET, EXCEPT COTTON GINNING
OXFORD WATER UTILITY (8910 S STATE RD 55 in OXFORD, IN)
STATE MASTER (Indiana facility tracking) National Pollutant Discharge Elimination System NON-MAJOR (Tracking pollutant discharge elimination systems) - permit COMMUNITY WATER SYSTEM (SDWIS) - SDWIS-IN5204005 7169, WATER TREATMENT PLANT Business SIC classification: WATER SUPPLY Organizations: CERTIFIED OPERATOR (CONTACT/OPERATOR)
, OXFORD CITY HALL (CONTACT/OWNER)
Alternative names: OXFORD UTILITIES, OXFORD WATER TREATMENT PLANT
AMERITECH (403 BENTON RD in OXFORD, IN)
STATE MASTER (Indiana facility tracking) - CRTK-6462, EPCRA (Resource Conservation and Recovery Act (tracking hazardous waste)) Organizations: INDIANA BELL TELEPHONE CO INC (CONTACT/OWNER)
Alternative names: IND BELL TEL CO OXFORD 385 OFF
OXFORD ELEMENTARY SCHOOL (405 N 5TH ST in OXFORD, IN)
(National Center for Education Statistics) - STATE ID-0441 Organizations: BENTON COMMUNITY SCHOOL CORP (SCHOOL DISTRICT)
BAYER CORP (7511 S SR 55 in OXFORD, IN)
STATE MASTER (Indiana facility tracking) (Resource Conservation and Recovery Act (tracking hazardous waste)) Organizations: BAYER CROPSCIENCE LP (CONTACT/OPERATOR)
Alternative names: BAYER CROPSCIENCE
Housing units lacking complete plumbing facilities: 4.2% Housing units lacking complete kitchen facilities: 0.9%
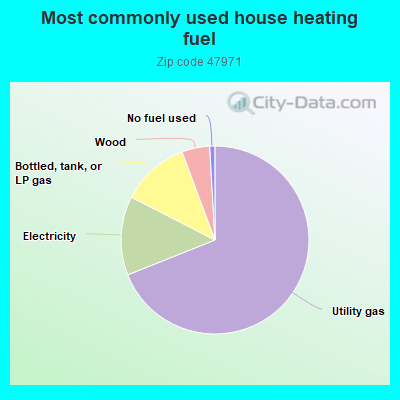
69.1%Utility gas
13.6%Electricity
11.8%Bottled, tank, or LP gas
4.8%Wood
0.9%No fuel used
Population in 1990: 1,641. Population change in the 1990s: +200 (+12.2%).
Place of birth for U.S.-born residents:
This state: 1,646
Northeast: 36
Midwest: 171
South: 120
West: 22
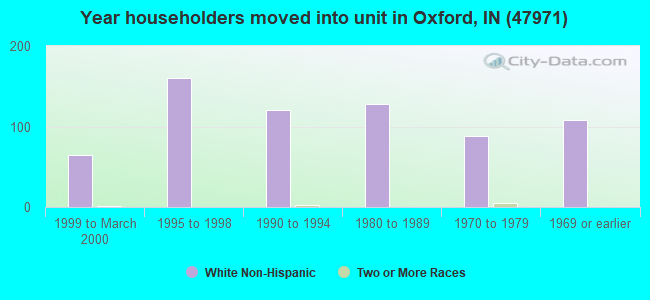
71% of the 47971 zip code residents lived in the same house 5 years ago. Out of people who lived in different houses, 40% lived in this county. Out of people who lived in different counties, 50% lived in Indiana.
91% of the 47971 zip code residents lived in the same house 1 year ago. Out of people who lived in different houses, 26% moved from this county. Out of people who lived in different houses, 67% moved from different county within same state. Out of people who lived in different houses, 6% moved from different state. Out of people who lived in different houses, 3% moved from abroad.
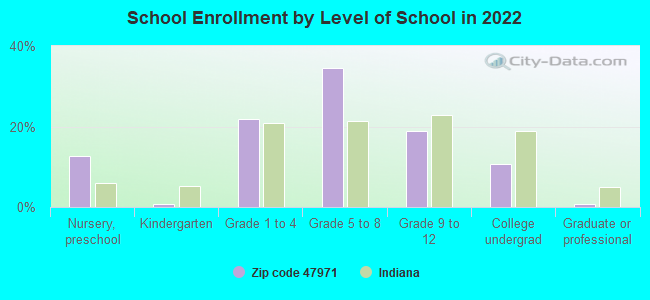
Private vs. public school enrollment:
Students in private schools in grades 1 to 8 (elementary and middle school): 10
Here:
4.1%
Indiana:
14.9%
Students in private schools in grades 9 to 12 (high school): 1
Here:
2.3%
Indiana:
11.4%
Students in private undergraduate colleges: 7
Here:
15.9%
Indiana:
22.3%
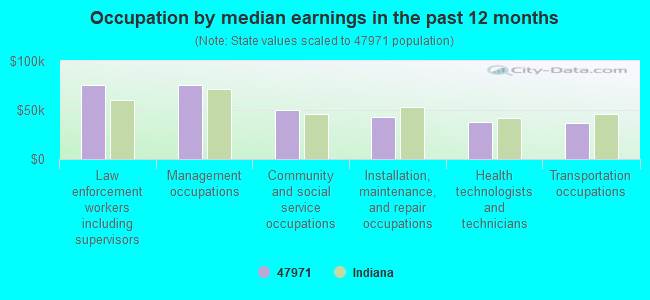
Occupation by median earnings in the past 12 months ($)
75,733Law enforcement workers including supervisors
75,186Management occupations
49,855Community and social service occupations
42,482Installation, maintenance, and repair occupations
37,830Health technologists and technicians
37,066Transportation occupations
Top industries in this zip code by the number of employees in 2005:
Health Care and Social Assistance: Offices of Physicians (except Mental Health Specialists) (10-19 employees: 1 establishment)
Finance and Insurance: Commercial Banking (10-19: 1)
Other Services (except Public Administration): Religious Organizations (1-4: 5)
Arts, Entertainment, and Recreation: Fitness and Recreational Sports Centers (5-9: 1)
Administrative and Support and Waste Management and Remediation Services: All Other Support Services (5-9: 1)
Finance and Insurance: Insurance Agencies and Brokerages (5-9: 1)
People in group quarters in 2010:
12 people in workers' group living quarters and job corps centers
People in group quarters in 2000:
40 people in nursing homes
Fatal accident statistics in 2014:
Fatal accident count: 2
Vehicles involved in fatal accidents: 2
Fatal accidents caused by drunken drivers: 0
Fatalities: 2
Persons involved in fatal accidents: 2
Pedestrians involved in fatal accidents: 1
2002 - 2018 National Fire Incident Reporting System (NFIRS) incidents
According to the data from the years 2002 - 2018 the average number of fires per year is 6. The highest number of fires - 14 took place in 2006, and the least - 0 in 2014. The data has a constant trend.
When looking into fire subcategories, the most reports belonged to: Outside Fires (43.9%), and Structure Fires (34.6%).
Fire incident types reported to NFIRS in Zip Code 47971


+$7,050
-$2,212
 Nearest zip codes: 47975, 47970, 47944, 47921, 47977, 47918.
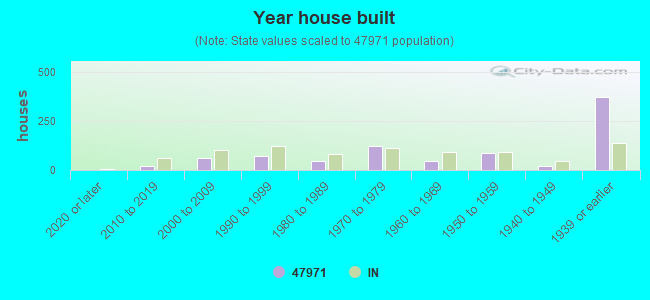


 According to the data from the years 2002 - 2018 the average number of fires per year is 6. The highest number of fires - 14 took place in 2006, and the least - 0 in 2014. The data has a constant trend.
 When looking into fire subcategories, the most reports belonged to: Outside Fires (43.9%), and Structure Fires (34.6%).