Estimated zip code population in 2022: 14,633 Zip code population in 2010: 14,480 Zip code population in 2000: 15,297
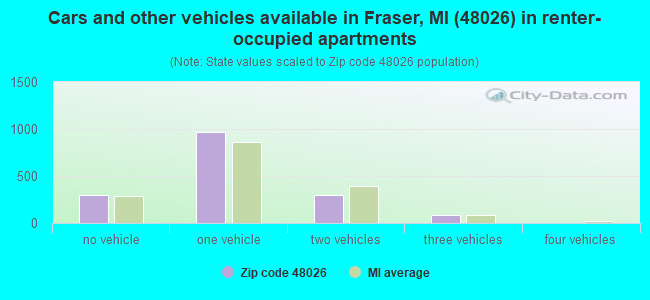
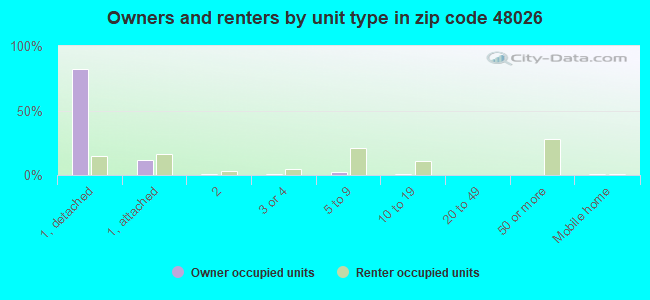
Houses and condos: 6,949 Renter-occupied apartments: 1,650
% of renters here:
25%
State:
27%
March 2022 cost of living index in zip code 48026: 94.9 (less than average, U.S. average is 100)
Land area: 4.1 sq. mi. Water area: 0.0 sq. mi.
Population density: 3,534 people per square mile
(average).
OSM Map
General Map
Google Map
MSN Map
OSM Map
General Map
Google Map
MSN Map
OSM Map
General Map
Google Map
MSN Map
OSM Map
General Map
Google Map
MSN Map
Please wait while loading the map...
Real estate property taxes paid for housing units in 2022:
This zip code:
1.8% ($3,546)
Michigan:
1.2% ($2,746)
Median real estate property taxes paid for housing units with mortgages in 2022: $3,651 (1.8%) Median real estate property taxes paid for housing units with no mortgage in 2022: $3,380 (1.7%)
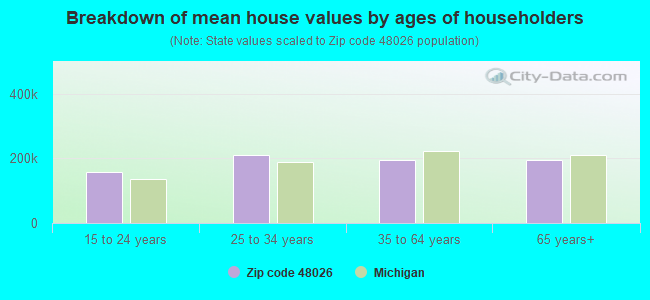
Estimated median house/condo value in 2022: $199,628
48026:
$199,628
Michigan:
$224,400
According to our research of Michigan and other state lists, there were 17 registered sex offenders living in 48026 zip code as of April 24, 2024. The ratio of all residents to sex offenders in zip code 48026 is 872 to 1. The ratio of registered sex offenders to all residents in this zip code is much lower than the state average.
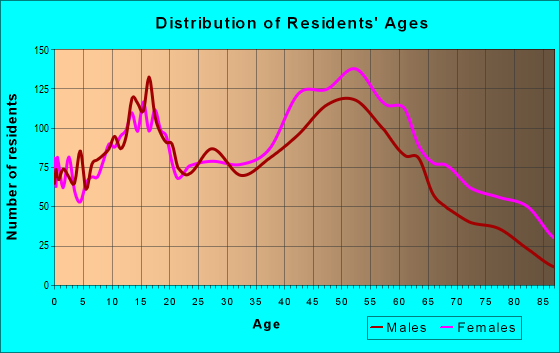
Median resident age:
This zip code:
42.3 years
Michigan median age:
40.3 years
Average household size:
This zip code:
2.2 people
Michigan:
2.4 people
Averages for the 2020 tax year for zip code 48026, filed in 2021:
Average Adjusted Gross Income (AGI) in 2020: $54,159 (Individual Income Tax Returns)
Here:
$54,159
State:
$68,945
Salary/wage: $50,302 (reported on 77.5% of returns)
Here:
$50,302
State:
$57,142
(% of AGI for various income ranges: 973.7% for AGIs below $25k, 3354.9% for AGIs $25k-50k, 6382.1% for AGIs $50k-75k, 8870.9% for AGIs $75k-100k, 17297.8% for AGIs $100k-200k, 63635.0% for AGIs over 200k)
Taxable interest for individuals: $1,013 (reported on 28.9% of returns)
This zip code:
$1,013
Michigan:
$1,630
(% of AGI for various income ranges: 15.6% for AGIs below $25k, 21.4% for AGIs $25k-50k, 57.1% for AGIs $50k-75k, 70.2% for AGIs $75k-100k, 81.0% for AGIs $100k-200k, 742.5% for AGIs over 200k)
Ordinary dividends: $2,949 (reported on 18.1% of returns)
Here:
$2,949
State:
$6,972
(% of AGI for various income ranges: 23.3% for AGIs below $25k, 24.8% for AGIs $25k-50k, 72.1% for AGIs $50k-75k, 104.5% for AGIs $75k-100k, 178.0% for AGIs $100k-200k, 2740.0% for AGIs over 200k)
Net capital gain/loss in AGI: +$4,252 (reported on 15.3% of returns)
Here:
+$4,252
State:
+$20,064
(% of AGI for various income ranges: 5.9% for AGIs below $25k, 27.4% for AGIs $25k-50k, 49.0% for AGIs $50k-75k, 173.1% for AGIs $75k-100k, 297.8% for AGIs $100k-200k, 3410.0% for AGIs over 200k)
Profit/loss from business: +$7,370 (reported on 13.2% of returns)
Here:
+$7,370
State:
+$11,172
(% of AGI for various income ranges: 77.4% for AGIs below $25k, 74.4% for AGIs $25k-50k, 142.2% for AGIs $50k-75k, 75.3% for AGIs $75k-100k, 337.1% for AGIs $100k-200k, 3692.5% for AGIs over 200k)
Taxable individual retirement arrangement distribution: $15,174 (reported on 9.8% of returns)
48026:
$15,174
Michigan:
$19,803
(% of AGI for various income ranges: 67.1% for AGIs below $25k, 107.4% for AGIs $25k-50k, 174.0% for AGIs $50k-75k, 361.4% for AGIs $75k-100k, 613.9% for AGIs $100k-200k, 3902.5% for AGIs over 200k)
Total itemized deductions: $25,162 (reported on 5.0% of returns)
Here:
$25,162
State:
$34,117
(% of AGI for various income ranges: 49.1% for AGIs below $25k, 93.2% for AGIs $25k-50k, 179.1% for AGIs $50k-75k, 262.6% for AGIs $75k-100k, 463.1% for AGIs $100k-200k, 4087.5% for AGIs over 200k)
Charity contributions: $7,213 (reported on 3.8% of returns)
Here:
$7,213
State:
$13,548
(% of AGI for various income ranges: 4.0% for AGIs below $25k, 14.1% for AGIs $25k-50k, 26.0% for AGIs $50k-75k, 51.2% for AGIs $75k-100k, 117.8% for AGIs $100k-200k, 1615.0% for AGIs over 200k)
Taxes paid: $6,977 (reported on 5.0% of returns)
48026:
$6,977
State:
$7,972
(% of AGI for various income ranges: 8.0% for AGIs below $25k, 21.2% for AGIs $25k-50k, 57.3% for AGIs $50k-75k, 91.7% for AGIs $75k-100k, 143.6% for AGIs $100k-200k, 880.0% for AGIs over 200k)
Earned income credit: $2,001 (reported on 12.1% of returns)
Here:
$2,001
State:
$2,251
(% of AGI for various income ranges: 62.4% for AGIs below $25k, 53.7% for AGIs $25k-50k)
Percentage of individuals using paid preparers for their 2020 taxes: 92.5%
Here:
92%
State:
93%
(% for various income ranges: 91.7% for AGIs below $25k, 93.6% for AGIs $25k-50k, 91.2% for AGIs $50k-75k, 93.8% for AGIs $75k-100k, 92.9% for AGIs $100k-200k, 92.9% for AGIs over 200k)
Averages for the 2012 tax year for zip code 48026, filed in 2013:
Average Adjusted Gross Income (AGI) in 2012: $47,533 (Individual Income Tax Returns)
Here:
$47,533
State:
$55,609
Salary/wage: $42,970 (reported on 81.1% of returns)
Here:
$42,970
State:
$46,782
(% of AGI for various income ranges: 66.4% for AGIs below $25k, 76.0% for AGIs $25k-50k, 73.7% for AGIs $50k-75k, 77.7% for AGIs $75k-100k, 80.3% for AGIs $100k-200k, 47.4% for AGIs over 200k)
Taxable interest for individuals: $1,012 (reported on 34.5% of returns)
This zip code:
$1,012
Michigan:
$1,491
(% of AGI for various income ranges: 1.5% for AGIs below $25k, 0.8% for AGIs $25k-50k, 0.7% for AGIs $50k-75k, 0.5% for AGIs $75k-100k, 0.6% for AGIs $100k-200k, 0.5% for AGIs over 200k)
Ordinary dividends: $2,396 (reported on 19.8% of returns)
Here:
$2,396
State:
$6,225
(% of AGI for various income ranges: 1.5% for AGIs below $25k, 1.0% for AGIs $25k-50k, 0.9% for AGIs $50k-75k, 0.9% for AGIs $75k-100k, 0.7% for AGIs $100k-200k, 1.6% for AGIs over 200k)
Net capital gain/loss in AGI: +$1,795 (reported on 13.9% of returns)
Here:
+$1,795
State:
+$9,326
(% of AGI for various income ranges: 0.2% for AGIs $50k-75k, 0.1% for AGIs $75k-100k, 0.5% for AGIs $100k-200k, 4.4% for AGIs over 200k)
Profit/loss from business: +$10,966 (reported on 11.5% of returns)
Here:
+$10,966
State:
+$11,523
(% of AGI for various income ranges: 6.9% for AGIs below $25k, 2.0% for AGIs $25k-50k, 2.1% for AGIs $50k-75k, 1.8% for AGIs $75k-100k, 3.4% for AGIs $100k-200k)
Taxable individual retirement arrangement distribution: $11,674 (reported on 12.0% of returns)
48026:
$11,674
Michigan:
$15,298
(% of AGI for various income ranges: 4.1% for AGIs below $25k, 2.8% for AGIs $25k-50k, 3.1% for AGIs $50k-75k, 3.3% for AGIs $75k-100k, 3.4% for AGIs $100k-200k)
Total itemized deductions: $17,261 (19% of AGI, reported on 30.0% of returns)
Here:
$17,261
State:
$21,628
Here:
19.4% of AGI
State:
18.4% of AGI
(% of AGI for various income ranges: 8.0% for AGIs below $25k, 8.5% for AGIs $25k-50k, 11.3% for AGIs $50k-75k, 12.4% for AGIs $75k-100k, 12.9% for AGIs $100k-200k, 8.8% for AGIs over 200k)
Charity contributions: $2,756 (reported on 25.8% of returns)
Here:
$2,756
State:
$4,225
(% of AGI for various income ranges: 0.6% for AGIs below $25k, 1.0% for AGIs $25k-50k, 1.5% for AGIs $50k-75k, 1.6% for AGIs $75k-100k, 2.0% for AGIs $100k-200k, 1.7% for AGIs over 200k)
Taxes paid: $6,498 (reported on 29.9% of returns)
48026:
$6,498
State:
$8,327
(% of AGI for various income ranges: 1.7% for AGIs below $25k, 2.4% for AGIs $25k-50k, 3.6% for AGIs $50k-75k, 5.2% for AGIs $75k-100k, 5.5% for AGIs $100k-200k, 4.5% for AGIs over 200k)
Earned income credit: $2,068 (reported on 15.1% of returns)
Here:
$2,068
State:
$2,306
(% of AGI for various income ranges: 5.0% for AGIs below $25k, 0.9% for AGIs $25k-50k)
Percentage of individuals using paid preparers for their 2012 taxes: 57.9%
Here:
58%
State:
57%
(% for various income ranges: 54.2% for AGIs below $25k, 58.9% for AGIs $25k-50k, 60.7% for AGIs $50k-75k, 63.0% for AGIs $75k-100k, 60.0% for AGIs $100k-200k, 75.0% for AGIs over 200k)
Averages for the 2004 tax year for zip code 48026, filed in 2005:
Average Adjusted Gross Income (AGI) in 2004: $45,855 (Individual Income Tax Returns)
Here:
$45,855
State:
$48,204
Salary/wage: $42,292 (reported on 84.4% of returns)
Here:
$42,292
State:
$42,791
(% of AGI for various income ranges: 82.7% for AGIs below $10k, 68.3% for AGIs $10k-25k, 77.3% for AGIs $25k-50k, 81.2% for AGIs $50k-75k, 87.1% for AGIs $75k-100k, 72.4% for AGIs over 100k)
Taxable interest for individuals: $1,582 (reported on 53.9% of returns)
This zip code:
$1,582
Michigan:
$1,725
(% of AGI for various income ranges: 6.5% for AGIs below $10k, 3.2% for AGIs $10k-25k, 2.2% for AGIs $25k-50k, 1.3% for AGIs $50k-75k, 0.8% for AGIs $75k-100k, 2.1% for AGIs over 100k)
Taxable dividends: $2,130 (reported on 27.1% of returns)
Here:
$2,130
State:
$3,420
(% of AGI for various income ranges: 3.1% for AGIs below $10k, 1.7% for AGIs $10k-25k, 1.2% for AGIs $25k-50k, 0.7% for AGIs $50k-75k, 0.7% for AGIs $75k-100k, 1.8% for AGIs over 100k)
Net capital gain/loss: +$6,405 (reported on 19.6% of returns)
Here:
+$6,405
State:
+$8,532
(% of AGI for various income ranges: -2.8% for AGIs below $10k, -0.0% for AGIs $10k-25k, 0.1% for AGIs $25k-50k, 0.6% for AGIs $50k-75k, 0.7% for AGIs $75k-100k, 8.0% for AGIs over 100k)
Profit/loss from business: +$7,936 (reported on 10.7% of returns)
Here:
+$7,936
State:
+$9,547
(% of AGI for various income ranges: 4.7% for AGIs below $10k, 4.5% for AGIs $10k-25k, 2.5% for AGIs $25k-50k, 2.0% for AGIs $50k-75k, 1.1% for AGIs $75k-100k, 1.0% for AGIs over 100k)
IRA payment deduction: $2,821 (reported on 2.3% of returns)
48026:
$2,821
Michigan:
$2,875
(% of AGI for various income ranges: 0.2% for AGIs $10k-25k, 0.3% for AGIs $25k-50k, 0.1% for AGIs $50k-75k, 0.1% for AGIs $75k-100k, 0.1% for AGIs over 100k)
Self-employed pension: $6,385 (reported on 0.4% of returns)
Here:
$6,385
Michigan:
$13,826
Total itemized deductions: $16,082 (21% of AGI, reported on 40.7% of returns)
Here:
$16,082
State:
$18,509
Here:
20.6% of AGI
State:
20.7% of AGI
(% of AGI for various income ranges: 11.0% for AGIs below $10k, 8.8% for AGIs $10k-25k, 12.9% for AGIs $25k-50k, 17.3% for AGIs $50k-75k, 16.6% for AGIs $75k-100k, 13.2% for AGIs over 100k)
Charity contributions deductions: $2,285 (3% of AGI, reported on 37.8% of returns)
Here:
$2,285
State:
$3,365
Here:
2.9% of AGI
State:
3.6% of AGI
(% of AGI for various income ranges: 0.7% for AGIs below $10k, 0.8% for AGIs $10k-25k, 1.5% for AGIs $25k-50k, 2.0% for AGIs $50k-75k, 2.1% for AGIs $75k-100k, 2.2% for AGIs over 100k)
Total tax: $6,241 (reported on 78.8% of returns)
48026:
$6,241
State:
$7,691
(% of AGI for various income ranges: 2.3% for AGIs below $10k, 4.4% for AGIs $10k-25k, 7.5% for AGIs $25k-50k, 8.8% for AGIs $50k-75k, 10.0% for AGIs $75k-100k, 16.3% for AGIs over 100k)
Earned income credit: $1,541 (reported on 10.4% of returns)
Here:
$1,541
State:
$1,737
Percentage of individuals using paid preparers for their 2004 taxes: 59.4%
Here:
59%
State:
60%
(% for various income ranges: 52.6% for AGIs below $10k, 58.0% for AGIs $10k-25k, 61.0% for AGIs $25k-50k, 63.1% for AGIs $50k-75k, 64.7% for AGIs $75k-100k, 61.2% for AGIs over 100k)
Likely homosexual households (counted as self-reported same-sex unmarried-partner households)
Lesbian couples: 0.0% of all households
Gay men: 0.1% of all households
Household received Food Stamps/SNAP in the past 12 months: 849 Household did not receive Food Stamps/SNAP in the past 12 months: 5,808
Women who had a birth in the past 12 months: 141 (104 now married, 37 unmarried) Women who did not have a birth in the past 12 months: 3,266 (1,091 now married, 2,180 unmarried)
Housing units in zip code 48026 with a mortgage: 3,207 (168 second mortgage, 165 both second mortgage and home equity loan) Houses without a mortgage: 117
Median monthly owner costs for units with a mortgage: $1,357 Median monthly owner costs for units without a mortgage: $653
Residents with income below the poverty level in 2022:
This zip code:
10.7%
Whole state:
13.4%
Residents with income below 50% of the poverty level in 2022:
This zip code:
7.7%
Whole state:
6.9%
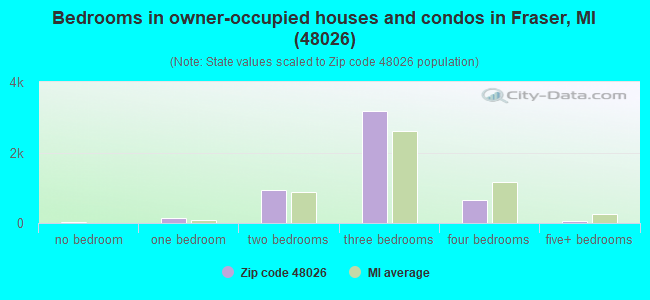
Median number of rooms in houses and condos:
Here:
5.8
State:
6.5
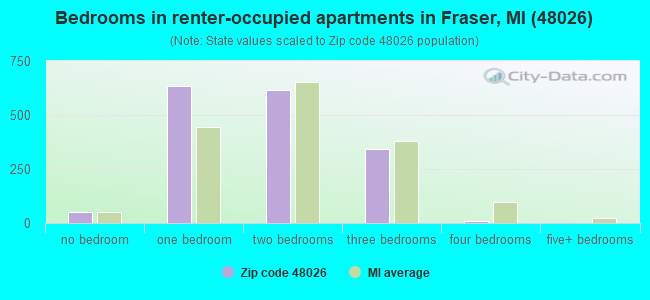
Median number of rooms in apartments:
Here:
4.3
State:
4.3
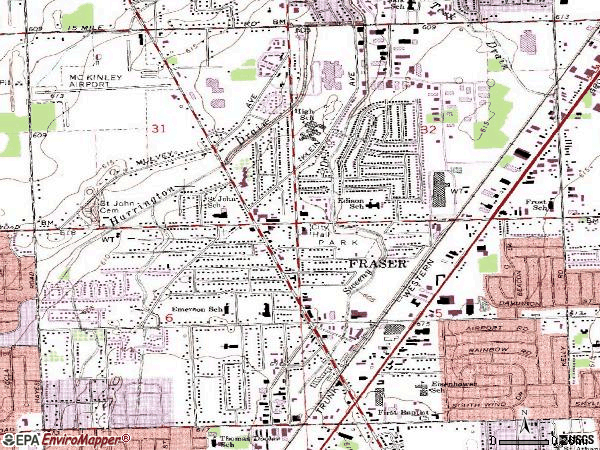
Notable locations in this zip code not listed on our city pages
Notable locations in zip code 48026: Fraser Station (A), Fraser Public Library (B), Fraser Police Department (C), Fraser Fire Department (D), Fraser Department of Public Safety Fire Station (E). Display/hide their locations on the map
Churches in zip code 48026 include: First Baptist Church (A), Christ United Methodist Church (B), Saint John Lutheran Church (C), Our Lady Queen of All Saints Church (D), Hope United Church of Christ (E), Warfield Greens Golf Club (F). Display/hide their locations on the map
Parks in zip code 48026 include: Baumgartner House Historical Marker (1), Walter C Steffens Park (2), McKinley Park (3). Display/hide their locations on the map
1,479 married couples with children.
1,046 single-parent households (429 men, 617 women).
89.2% of residents of 48026 zip code speak English at home.
1.0% of residents speak Spanish at home (100% very well).
5.6% of residents speak other Indo-European language at home (75% very well, 21% well, 4% not well).
0.7% of residents speak Asian or Pacific Island language at home (47% very well, 48% well, 4% not well).
3.9% of residents speak other language at home (39% very well, 28% well, 3% not well, 30% not at all).
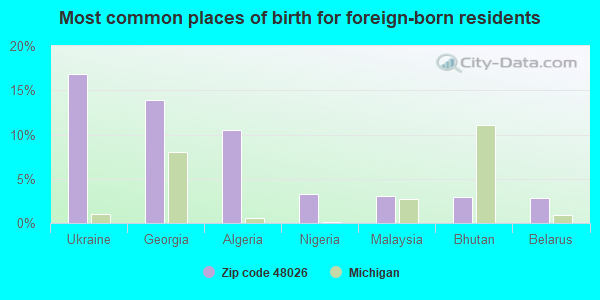
Foreign born population: 1,088 (7.4%) (53.9% of them are naturalized citizens)
This zip code:
7.4%
Whole state:
6.9%
17%Ukraine
14%Georgia
11%Algeria
3%Nigeria
3%Malaysia
3%Bhutan
3%Belarus
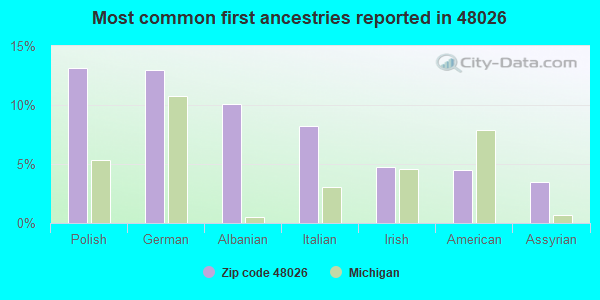
13%Polish
13%German
10%Albanian
8%Italian
5%Irish
4%American
4%Assyrian
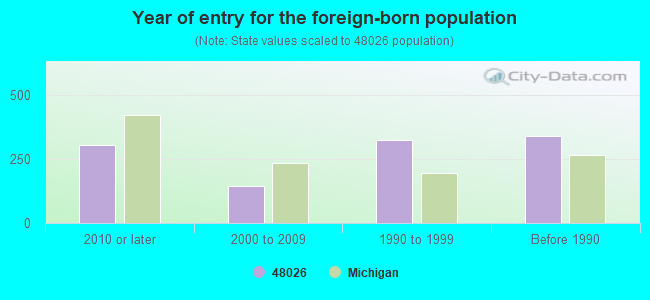
Year of entry for the foreign-born population
3062010 or later
1452000 to 2009
3241990 to 1999
340Before 1990
Major facilities with environmental interests located in this zip code:
FRASER HIGH SCHOOL (34270 GARFIELD ROAD in FRASER, MI)
(National Center for Education Statistics) - STATE ID-01308 Organizations: FRASER PUBLIC SCHOOLS (SCHOOL DISTRICT)
EISENHOWER ELEMENTARY SCHOOL (31275 EVENINGSIDE DRIVE in FRASER, MI)
(National Center for Education Statistics) - STATE ID-00978 Organizations: FRASER PUBLIC SCHOOLS (SCHOOL DISTRICT)
FALCON COLD FORMING INC (34260 JAMES J POMPO in FRASER, MI)
National Pollutant Discharge Elimination System NON-MAJOR (Tracking pollutant discharge elimination systems) - permit Conditionally Exempt Small Quantity Generators, less than 100 kg/month of hazardous waste (Resource Conservation and Recovery Act (tracking hazardous waste)) Business NAICS classification: NONFERROUS METAL (EXCEPT COPPER AND ALUMINUM) ROLLING, DRAWING, AND EXTRUDING. Organizations: GREGG EKBERG (CONTACT/OWNER)
AVR COLLISION (34155 KELLY RD in FRASER, MI)
(Resource Conservation and Recovery Act (tracking hazardous waste))
A1 ROLL CO (18380 MALYN in FRASER, MI)
(Resource Conservation and Recovery Act (tracking hazardous waste)) Organizations: FLORKA RICHARD (CONTACT/OWNER)
E AND E SPECIAL PRODUCTS (33901 RIVERIA in FRASER, MI)
(Resource Conservation and Recovery Act (tracking hazardous waste)) Organizations: HIRZEL MATT (CONTACT/OWNER)
ALCOLITE PRODUCTS CORP (32100 GROESBECK HWY in FRASER, MI)
(Resource Conservation and Recovery Act (tracking hazardous waste)) Organizations: WILLIAMSON DONALD (CONTACT/OPERATOR)
ALL AMERICAN CLEANERS (34533 UTICA RD in FRASER, MI)
(Resource Conservation and Recovery Act (tracking hazardous waste)) Organizations: JOHN SCHEFKE NGUYEN (CONTACT/OPERATOR)
FRASER ICE ARENA (34400 UTICA RD in FRASER, MI)
(Resource Conservation and Recovery Act (tracking hazardous waste)) Organizations: FRASER INVESTMENT CO (CONTACT/OWNER)
FRASER GRINDING (33300 GROESBECK HWY in FRASER, MI)
(Resource Conservation and Recovery Act (tracking hazardous waste)) Business NAICS classification: ELECTROPLATING, PLATING, POLISHING, ANODIZING, AND COLORING. Organizations: LIPSKI RUDY (CONTACT/OWNER)
GRANT INDUSTRY (33415 GROESBECK in FRASER, MI)
(Resource Conservation and Recovery Act (tracking hazardous waste)) Organizations: GRANT EDWARD W (CONTACT/OWNER)
APOLLO EDM CO (16601 13 MILE RD in FRASER, MI)
(Resource Conservation and Recovery Act (tracking hazardous waste)) Organizations: APOLLO ASSOC (CONTACT/OWNER)
GLOBAL AUTOMOTIVE SYSTEMS PLANT 2 (34401 COMMERCE ROAD in FRASER, MI)
CRITERIA AND HAZARDOUS AIR POLLUTANT INVENTORY (Inventory of air pollution sources) Small Quantity Generators, between 100 kg and 1000 kg of hazardous waste/month (Resource Conservation and Recovery Act (tracking hazardous waste)) - notification TRI REPORTER (Tracking of toxic chemicals releasing facilities) Business SIC classification: MOTOR VEHICLE PARTS AND ACCESSORIES Business NAICS classification: NONFERROUS METAL (EXCEPT COPPER AND ALUMINUM) ROLLING, DRAWING, AND EXTRUDING. Organizations: JACOBS INDUSTRIES INC (CONTACT/OPERATOR)
Alternative names: JACOBS INDS. INC., JACOBS INDS. PLANT 2
Housing units lacking complete plumbing facilities: 0.1% Housing units lacking complete kitchen facilities: 0.7%
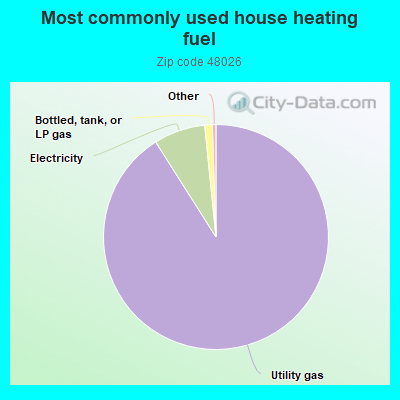
91.0%Utility gas
7.4%Electricity
1.1%Bottled, tank, or LP gas
Population in 1990: 20,605.
Place of birth for U.S.-born residents:
This state: 11,712
Northeast: 264
Midwest: 546
South: 679
West: 267
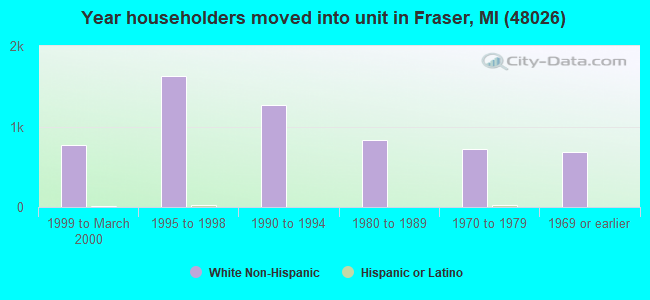
63% of the 48026 zip code residents lived in the same house 5 years ago. Out of people who lived in different houses, 74% lived in this county. Out of people who lived in different counties, 50% lived in Michigan.
92% of the 48026 zip code residents lived in the same house 1 year ago. Out of people who lived in different houses, 70% moved from this county. Out of people who lived in different houses, 13% moved from different county within same state. Out of people who lived in different houses, 14% moved from different state. Out of people who lived in different houses, 3% moved from abroad.
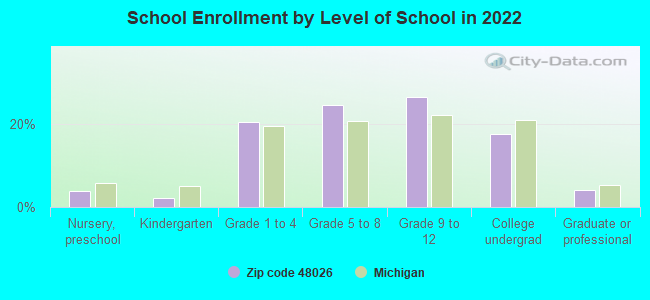
Private vs. public school enrollment:
Students in private schools in grades 1 to 8 (elementary and middle school): 96
Here:
8.8%
Michigan:
12.4%
Students in private schools in grades 9 to 12 (high school): 16
Here:
2.6%
Michigan:
9.8%
Students in private undergraduate colleges: 63
Here:
14.9%
Michigan:
14.9%
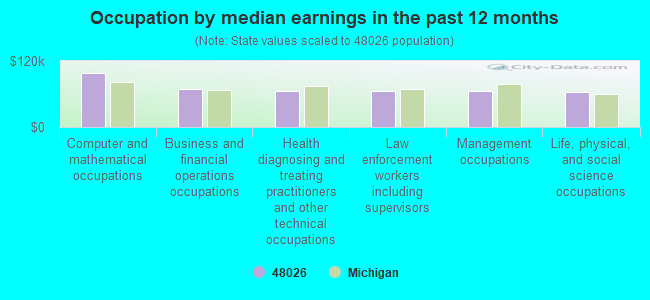
Occupation by median earnings in the past 12 months ($)
77,728Computer and mathematical occupations
77,307Life, physical, and social science occupations
76,220Business and financial operations occupations
73,131Management occupations
66,112Health diagnosing and treating practitioners and other technical occupations
64,514Law enforcement workers including supervisors
Companies with biggest federal contracts located in this zip code (FRASER, MI):
THE BELL COMPANY (33341 KELLY RD) : $10,160,271 in 32 contractsfrom 2000 to 2002
Contracts for Construction of Structures and Facilities -- Other Administrative Facilities and Service Buildings, Maintenance, Repair or Alteration of Real Property -- Highways, Roads, Streets, Bridges, and Railways (includes resurfacing), Maintenance, Repair or Alteration of Real Property -- Airport Terminals, Maintenance, Repair or Alteration of Real Property -- Office Buildings, and moreby Army Signed by year:2000: $9,840,803; 2001: $276,880; 2002: $42,588; 2003: $0; 2004: $0; 2005: $0; 2006: $0.
Biggest contracts:
$6,919,100 with Army for Construction of Structures and Facilities -- Other Administrative Facilities and Service Buildings. Signed on 2000-09-28. Completion date: 2002-06-04.
$1,725,000 with Army for Maintenance, Repair or Alteration of Real Property -- Highways, Roads, Streets, Bridges, and Railways (includes resurfacing). Signed on 2000-05-01. Completion date: 2001-01-31.
$662,425 with Army for Maintenance, Repair or Alteration of Real Property -- Airport Terminals. Signed on 2000-08-22. Completion date: 2000-09-16.
$270,000 with Army for Maintenance, Repair or Alteration of Real Property -- Office Buildings. Signed on 2000-08-30. Completion date: 2000-10-22.
SUPREME GEAR CO (17430 MALYN; small business) : $4,108,799 in 58 contractsfrom 1999 to 2006
Contracts for Miscellaneous Power Transmission Equipment, Packing and Gasket Materials, Vehicular Brake, Steering, Axle, Wheel, and Track Components, Miscellaneous Vehicular Components, and moreby Army, Defense Logistics Agency Signed by year:2000: $715,159; 2001: $198,533; 2002: $1,376,051; 2003: $547,515; 2004: $815,023; 2005: $305,886; 2006: $115,173.
Biggest contracts:
$535,019 with Army for Miscellaneous Power Transmission Equipment. Signed on 2000-12-08. Completion date: 2002-12-31.
$439,109 with Army for Packing and Gasket Materials. Signed on 2002-11-13. Completion date: 2007-02-28.
$400,493, same as above.Signed on 2002-03-07. Completion date: 2007-02-28.
$350,665, same as above.Signed on 2003-01-07. Completion date: 2007-02-28.
FAIRLANE TOOL COMPANY, INC (31790 GROESBECK HWY; small business) : $3,776,082 in 10 contractsfrom 2001 to 2005
Contracts for Diesel Engines and Components by Army Signed by year:2000: $0; 2001: $242,060; 2002: $468,000; 2003: $1,172,420; 2004: $749,639; 2005: $1,143,963; 2006: $0.
Biggest contracts:
$816,669 with Army for Diesel Engines and Components. Signed on 2005-08-01. Completion date: 2008-04-24.
$749,639, same as above.Signed on 2004-12-09. Completion date: 2008-04-24.
$579,500, same as above.Signed on 2003-07-24. Completion date: 2004-09-22.
$468,000, same as above.Signed on 2002-09-26. Completion date: 2003-07-30.
CARATRON INDUSTRIES INC (18559 MALYN BLVD; small business) : $2,219,614 in 50 contractsfrom 1999 to 2006
Contracts for Miscellaneous Power Transmission Equipment, Gears, Pulleys, Sprockets, and Transmission Chain, Gas Turbines and Jet Engines, Aircraft; Prime Moving, and Components, Torque Converters and Speed Changers, and moreby Defense Logistics Agency, Army, Navy Signed by year:2000: $263,340; 2001: $620,872; 2002: $543,686; 2003: $84,961; 2004: $172,197; 2005: $529,585; 2006: $41,163.
Biggest contracts:
$143,352 with Defense Logistics Agency for Miscellaneous Power Transmission Equipment. Signed on 2001-02-07. Completion date: 2001-10-17.
$116,693 with Defense Logistics Agency for Gears, Pulleys, Sprockets, and Transmission Chain. Signed on 2004-02-10. Completion date: 2004-08-20.
$98,582 with Defense Logistics Agency for Miscellaneous Power Transmission Equipment. Signed on 2005-10-15. Completion date: 2006-04-29.
$98,370, same as above.Signed on 2005-04-15. Completion date: 2005-10-29.
AMERICAN AIRCRAFT PARTS MANUFA (17917 MASONIC BLVD; small business) : $554,252 in 22 contractsfrom 2001 to 2006
Contracts for Nuts and Washers, Gas Turbines and Jet Engines, Aircraft; Prime Moving, and Components, Bearings, Antifriction, Unmounted, Bushings, Rings, Shims, and Spacers, and moreby Defense Logistics Agency, Air Force Signed by year:2000: $0; 2001: $55,372; 2002: $0; 2003: $0; 2004: $179,100; 2005: $266,560; 2006: $53,220.
Biggest contracts:
$94,080 with Defense Logistics Agency for Nuts and Washers. Signed on 2005-08-04. Completion date: 2006-09-08.
$83,000, same as above.Signed on 2004-02-25. Completion date: 2004-06-30.
$55,000, same as above.Signed on 2004-02-23. Completion date: 2005-02-23.
$52,206, same as above.Signed on 2005-07-22. Completion date: 2006-08-26.
ENTERPRISE LEASING COMPANY OF (33245 GROESBECK HWY; small business) : $173,795 in 14 contractsfrom 2002 to 2006
Contracts for Lease or Rental of Equipment -- Ground Effect Vehicles, Motor Vehicles, Trailers, and Cycles by Army, Air Force Signed by year:2000: $0; 2001: $0; 2002: $145,917; 2003: $8,140; 2004: $0; 2005: $5,959; 2006: $13,779.
Biggest contracts:
$116,075 with Army for Lease or Rental of Equipment -- Ground Effect Vehicles, Motor Vehicles, Trailers, and Cycles. Signed on 2002-03-08. Completion date: 2002-09-30.
$57,600, same as above.Signed on 2002-03-26. Completion date: 2002-03-24.
$29,617, same as above.Signed on 2002-03-08. Completion date: 2002-09-30.
$7,779 with Air Force for Lease or Rental of Equipment -- Ground Effect Vehicles, Motor Vehicles, Trailers, and Cycles. Taking place in VA. Signed on 2006-05-05. Completion date: 2006-05-11.
INDUSTRIAL SERVO HYDRAULICS IN (17650 MALYN BLVD; small business) : $105,701 in 8 contractsfrom 2003 to 2006
Contracts for Miscellaneous Items, Electrical Hardware and Supplies, Motors, Electrical, Aircraft Hydraulic, Vacuum, and De-icing System Components, and moreby Navy, NASA, Army Signed by year:2000: $0; 2001: $0; 2002: $0; 2003: $30,712; 2004: $18,851; 2005: $25,647; 2006: $30,491.
Biggest contracts:
$30,712 with Navy for Miscellaneous Items. Signed on 2003-03-10. Completion date: 2003-05-09.
$30,491 with Navy for Electrical Hardware and Supplies. Signed on 2006-03-10. Completion date: 2006-06-21.
$15,955 with Navy for Motors, Electrical. Taking place in VA. Signed on 2005-03-01. Completion date: 2005-03-16.
$15,356 with Navy for Miscellaneous Items. Signed on 2004-03-05. Completion date: 2004-06-01.
MP PUMPS INC. (34800 BENNETTDIRVE; small business)
$94,800 with Defense Logistics Agency for Engine Cooling System Components, Nonaircraft. Signed on 2000-05-09. Completion date: 2000-10-12.
COMMUNITY ASSESSMENT, REFERRAL (31900 UTICA RD; small business) : $93,226 in 10 contractsfrom 2001 to 2005
Contracts for Other Education and Training Services, Social Rehabilitation Services, Other Social Services, Other Management Support Services by Army Signed by year:2000: $0; 2001: $13,878; 2002: $18,702; 2003: $22,189; 2004: $18,270; 2005: $20,187; 2006: $0.
Biggest contracts:
$15,687 with Army for Other Education and Training Services. Signed on 2005-12-14. Completion date: 2006-12-14.
$14,202 with Army for Social Rehabilitation Services. Signed on 2002-10-02. Completion date: 2003-09-30.
$13,878, same as above.Signed on 2001-10-04. Completion date: 2002-09-30.
$13,770 with Army for Other Education and Training Services. Signed on 2004-10-01. Completion date: 2005-09-30.
BROACHES INCORPORATED (17921 MALYN BLVD; small business)
$29,610 with Army for Cutting Tools for Machine Tools. Signed on 2000-10-31. Completion date: 2001-08-01.
Top industries in this zip code by the number of employees in 2005:
People in group quarters in 2010:
89 people in nursing facilities/skilled-nursing facilities
6 people in residential treatment centers for adults
People in group quarters in 2000:
216 people in nursing homes
8 people in religious group quarters
5 people in homes for the mentally ill
Fatal accident statistics in 2012:
Fatal accident count: 1
Vehicles involved in fatal accidents: 2
Fatal accidents caused by drunken drivers: 1
Fatalities: 1
Persons involved in fatal accidents: 3
Pedestrians involved in fatal accidents: 0
Fatal accident statistics in 2011:
Fatal accident count: 2
Vehicles involved in fatal accidents: 2
Fatal accidents caused by drunken drivers: 0
Fatalities: 2
Persons involved in fatal accidents: 3
Pedestrians involved in fatal accidents: 1
Home Mortgage Disclosure Act Aggregated Statistics For Year 2009 (Based on 8 full tracts)
A) FHA, FSA/RHS & VA Home Purchase Loans
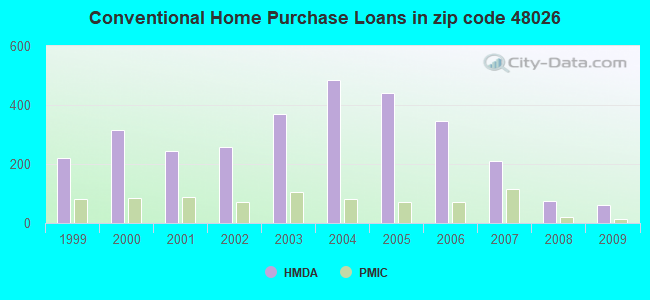
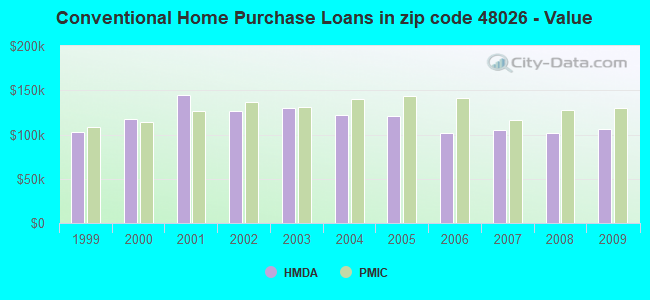
B) Conventional Home Purchase Loans
C) Refinancings
D) Home Improvement Loans
F) Non-occupant Loans on < 5 Family Dwellings (A B C & D)
G) Loans On Manufactured Home Dwelling (A B C & D)
Number
Average Value
Number
Average Value
Number
Average Value
Number
Average Value
Number
Average Value
Number
Average Value
LOANS ORIGINATED
147
$90,458
60
$106,118
293
$123,234
16
$40,862
16
$80,143
0
$0
APPLICATIONS APPROVED, NOT ACCEPTED
4
$67,822
4
$143,300
36
$119,418
8
$9,202
0
$0
0
$0
APPLICATIONS DENIED
26
$84,942
20
$113,170
129
$125,244
10
$9,757
8
$65,691
2
$30,785
APPLICATIONS WITHDRAWN
14
$70,731
2
$99,740
68
$124,390
2
$12,965
2
$99,740
0
$0
FILES CLOSED FOR INCOMPLETENESS
2
$145,970
0
$0
12
$111,322
0
$0
0
$0
0
$0
Aggregated Statistics For Year 2008 (Based on 8 full tracts)
A) FHA, FSA/RHS & VA Home Purchase Loans
B) Conventional Home Purchase Loans
C) Refinancings
D) Home Improvement Loans
F) Non-occupant Loans on < 5 Family Dwellings (A B C & D)
G) Loans On Manufactured Home Dwelling (A B C & D)
Number
Average Value
Number
Average Value
Number
Average Value
Number
Average Value
Number
Average Value
Number
Average Value
LOANS ORIGINATED
100
$116,047
74
$102,243
201
$129,115
36
$33,957
26
$82,685
0
$0
APPLICATIONS APPROVED, NOT ACCEPTED
2
$101,735
8
$37,106
22
$102,162
6
$42,148
6
$75,017
6
$20,265
APPLICATIONS DENIED
34
$127,492
18
$85,056
165
$129,366
24
$42,523
14
$108,866
8
$40,082
APPLICATIONS WITHDRAWN
6
$122,373
10
$123,147
68
$135,790
8
$33,869
2
$87,630
0
$0
FILES CLOSED FOR INCOMPLETENESS
4
$69,818
4
$163,475
12
$115,969
2
$6,960
0
$0
0
$0
Aggregated Statistics For Year 2007 (Based on 8 full tracts)
A) FHA, FSA/RHS & VA Home Purchase Loans
B) Conventional Home Purchase Loans
C) Refinancings
D) Home Improvement Loans
E) Loans on Dwellings For 5+ Families
F) Non-occupant Loans on < 5 Family Dwellings (A B C & D)
G) Loans On Manufactured Home Dwelling (A B C & D)
Number
Average Value
Number
Average Value
Number
Average Value
Number
Average Value
Number
Average Value
Number
Average Value
Number
Average Value
LOANS ORIGINATED
28
$122,241
211
$105,121
448
$116,762
52
$28,615
4
$901,150
36
$90,160
0
$0
APPLICATIONS APPROVED, NOT ACCEPTED
4
$127,350
18
$116,955
125
$103,694
6
$14,618
0
$0
8
$115,855
0
$0
APPLICATIONS DENIED
10
$114,448
48
$95,731
370
$133,421
56
$69,078
0
$0
10
$82,667
12
$42,146
APPLICATIONS WITHDRAWN
8
$118,151
10
$181,268
106
$143,505
6
$21,868
4
$2,124,462
0
$0
2
$67,715
FILES CLOSED FOR INCOMPLETENESS
2
$145,970
6
$128,388
38
$119,738
8
$19,646
0
$0
0
$0
0
$0
Aggregated Statistics For Year 2006 (Based on 8 full tracts)
A) FHA, FSA/RHS & VA Home Purchase Loans
B) Conventional Home Purchase Loans
C) Refinancings
D) Home Improvement Loans
E) Loans on Dwellings For 5+ Families
F) Non-occupant Loans on < 5 Family Dwellings (A B C & D)
G) Loans On Manufactured Home Dwelling (A B C & D)
Number
Average Value
Number
Average Value
Number
Average Value
Number
Average Value
Number
Average Value
Number
Average Value
Number
Average Value
LOANS ORIGINATED
44
$127,613
346
$101,950
633
$110,889
76
$55,504
2
$1,192,595
24
$74,008
2
$18,865
APPLICATIONS APPROVED, NOT ACCEPTED
0
$0
34
$147,635
114
$128,459
16
$31,361
0
$0
16
$156,977
0
$0
APPLICATIONS DENIED
6
$145,957
84
$97,400
444
$125,153
50
$39,740
0
$0
10
$96,300
6
$42,758
APPLICATIONS WITHDRAWN
6
$111,492
44
$98,975
177
$135,706
24
$71,336
0
$0
4
$97,662
0
$0
FILES CLOSED FOR INCOMPLETENESS
2
$169,080
16
$97,511
66
$145,569
6
$27,513
0
$0
0
$0
0
$0
Aggregated Statistics For Year 2005 (Based on 8 full tracts)
A) FHA, FSA/RHS & VA Home Purchase Loans
B) Conventional Home Purchase Loans
C) Refinancings
D) Home Improvement Loans
E) Loans on Dwellings For 5+ Families
F) Non-occupant Loans on < 5 Family Dwellings (A B C & D)
G) Loans On Manufactured Home Dwelling (A B C & D)
Number
Average Value
Number
Average Value
Number
Average Value
Number
Average Value
Number
Average Value
Number
Average Value
Number
Average Value
LOANS ORIGINATED
34
$137,440
440
$120,895
745
$120,986
74
$42,435
6
$931,505
50
$97,904
0
$0
APPLICATIONS APPROVED, NOT ACCEPTED
8
$139,159
58
$99,830
147
$127,003
20
$30,492
0
$0
4
$74,060
0
$0
APPLICATIONS DENIED
22
$132,965
74
$132,024
416
$134,799
86
$57,967
2
$1,493,700
18
$107,053
6
$117,948
APPLICATIONS WITHDRAWN
2
$106,550
32
$130,218
257
$140,326
30
$86,242
0
$0
6
$97,525
0
$0
FILES CLOSED FOR INCOMPLETENESS
2
$110,225
10
$96,834
145
$141,984
4
$62,322
0
$0
4
$99,440
0
$0
Aggregated Statistics For Year 2004 (Based on 8 full tracts)
A) FHA, FSA/RHS & VA Home Purchase Loans
B) Conventional Home Purchase Loans
C) Refinancings
D) Home Improvement Loans
E) Loans on Dwellings For 5+ Families
F) Non-occupant Loans on < 5 Family Dwellings (A B C & D)
G) Loans On Manufactured Home Dwelling (A B C & D)
Number
Average Value
Number
Average Value
Number
Average Value
Number
Average Value
Number
Average Value
Number
Average Value
Number
Average Value
LOANS ORIGINATED
50
$119,850
484
$121,500
1,063
$123,858
70
$51,860
0
$0
64
$79,608
4
$37,388
APPLICATIONS APPROVED, NOT ACCEPTED
8
$107,244
70
$116,999
179
$123,614
2
$9,945
0
$0
4
$106,360
2
$9,945
APPLICATIONS DENIED
16
$134,924
60
$98,695
422
$140,997
84
$38,310
2
$85,775
18
$80,446
6
$36,532
APPLICATIONS WITHDRAWN
2
$132,655
26
$141,377
199
$145,586
10
$129,835
0
$0
6
$104,848
0
$0
FILES CLOSED FOR INCOMPLETENESS
2
$141,005
6
$168,313
137
$141,300
4
$39,332
0
$0
2
$107,415
0
$0
Aggregated Statistics For Year 2003 (Based on 8 full tracts)
A) FHA, FSA/RHS & VA Home Purchase Loans
B) Conventional Home Purchase Loans
C) Refinancings
D) Home Improvement Loans
E) Loans on Dwellings For 5+ Families
F) Non-occupant Loans on < 5 Family Dwellings (A B C & D)
Number
Average Value
Number
Average Value
Number
Average Value
Number
Average Value
Number
Average Value
Number
Average Value
LOANS ORIGINATED
102
$136,617
368
$130,299
2,636
$119,446
72
$25,178
2
$504,445
68
$82,693
APPLICATIONS APPROVED, NOT ACCEPTED
2
$164,840
34
$101,725
283
$126,458
12
$28,650
0
$0
12
$90,082
APPLICATIONS DENIED
22
$131,375
64
$116,769
546
$122,994
52
$12,749
2
$169,805
26
$78,990
APPLICATIONS WITHDRAWN
6
$73,062
16
$99,993
261
$131,914
4
$18,388
0
$0
4
$106,052
FILES CLOSED FOR INCOMPLETENESS
6
$125,860
16
$125,951
88
$112,928
0
$0
0
$0
0
$0
Aggregated Statistics For Year 2002 (Based on 6 full tracts)
A) FHA, FSA/RHS & VA Home Purchase Loans
B) Conventional Home Purchase Loans
C) Refinancings
D) Home Improvement Loans
E) Loans on Dwellings For 5+ Families
F) Non-occupant Loans on < 5 Family Dwellings (A B C & D)
Number
Average Value
Number
Average Value
Number
Average Value
Number
Average Value
Number
Average Value
Number
Average Value
LOANS ORIGINATED
70
$115,980
259
$127,091
1,275
$120,414
83
$22,602
2
$970,905
40
$67,500
APPLICATIONS APPROVED, NOT ACCEPTED
0
$0
24
$118,192
151
$129,856
8
$21,138
0
$0
4
$107,048
APPLICATIONS DENIED
2
$87,385
32
$76,430
203
$111,903
20
$16,917
0
$0
4
$66,680
APPLICATIONS WITHDRAWN
2
$113,520
16
$118,128
155
$139,337
2
$14,895
0
$0
8
$91,262
FILES CLOSED FOR INCOMPLETENESS
0
$0
4
$109,748
44
$113,106
2
$79,440
0
$0
2
$79,440
Aggregated Statistics For Year 2001 (Based on 6 full tracts)
A) FHA, FSA/RHS & VA Home Purchase Loans
B) Conventional Home Purchase Loans
C) Refinancings
D) Home Improvement Loans
E) Loans on Dwellings For 5+ Families
F) Non-occupant Loans on < 5 Family Dwellings (A B C & D)
Number
Average Value
Number
Average Value
Number
Average Value
Number
Average Value
Number
Average Value
Number
Average Value
LOANS ORIGINATED
93
$113,485
245
$144,172
999
$120,270
91
$23,827
4
$751,255
36
$80,748
APPLICATIONS APPROVED, NOT ACCEPTED
0
$0
44
$93,424
93
$116,483
16
$17,412
0
$0
4
$45,280
APPLICATIONS DENIED
6
$107,755
40
$66,971
187
$104,427
28
$11,077
0
$0
4
$34,258
APPLICATIONS WITHDRAWN
0
$0
8
$131,004
155
$128,923
8
$13,912
0
$0
0
$0
FILES CLOSED FOR INCOMPLETENESS
0
$0
0
$0
36
$124,468
2
$6,950
0
$0
0
$0
Aggregated Statistics For Year 2000 (Based on 6 full tracts)
A) FHA, FSA/RHS & VA Home Purchase Loans
B) Conventional Home Purchase Loans
C) Refinancings
D) Home Improvement Loans
E) Loans on Dwellings For 5+ Families
F) Non-occupant Loans on < 5 Family Dwellings (A B C & D)
Number
Average Value
Number
Average Value
Number
Average Value
Number
Average Value
Number
Average Value
Number
Average Value
LOANS ORIGINATED
62
$108,347
316
$117,045
245
$98,203
97
$20,481
2
$994,600
14
$62,430
APPLICATIONS APPROVED, NOT ACCEPTED
4
$90,472
28
$71,416
36
$89,831
32
$20,466
0
$0
2
$39,830
APPLICATIONS DENIED
4
$125,118
38
$64,268
99
$81,705
46
$19,018
0
$0
4
$129,090
APPLICATIONS WITHDRAWN
6
$66,663
10
$132,798
58
$80,541
4
$16,395
0
$0
2
$53,620
FILES CLOSED FOR INCOMPLETENESS
0
$0
2
$107,415
20
$104,638
0
$0
0
$0
0
$0
Aggregated Statistics For Year 1999 (Based on 5 full tracts)
A) FHA, FSA/RHS & VA Home Purchase Loans
B) Conventional Home Purchase Loans
C) Refinancings
D) Home Improvement Loans
F) Non-occupant Loans on < 5 Family Dwellings (A B C & D)
2002 - 2018 National Fire Incident Reporting System (NFIRS) incidents
Based on the data from the years 2002 - 2018 the average number of fires per year is 15. The highest number of fires - 31 took place in 2016, and the least - 0 in 2013. The data has a dropping trend.
When looking into fire subcategories, the most reports belonged to: Structure Fires (47.5%), and Mobile Property/Vehicle Fires (20.5%).
Fire incident types reported to NFIRS in Zip Code 48026


 Nearest zip codes: 48066, 48088, 48035, 48082, 48312, 48081.
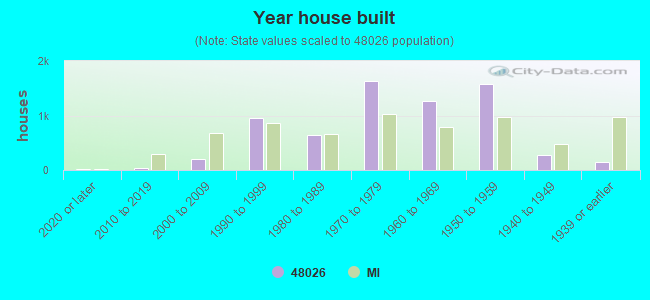


 Based on the data from the years 2002 - 2018 the average number of fires per year is 15. The highest number of fires - 31 took place in 2016, and the least - 0 in 2013. The data has a dropping trend.
 When looking into fire subcategories, the most reports belonged to: Structure Fires (47.5%), and Mobile Property/Vehicle Fires (20.5%).