Estimated zip code population in 2022: 4,404 Zip code population in 2010: 4,561 Zip code population in 2000: 4,330
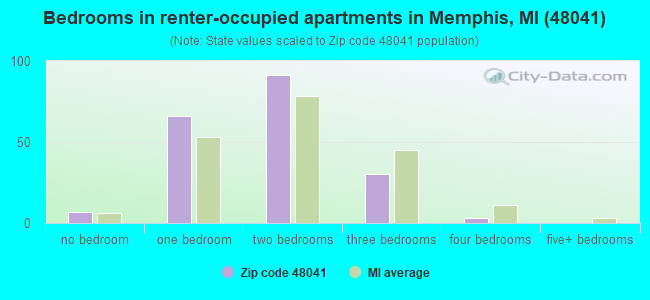
Houses and condos: 1,912 Renter-occupied apartments: 197
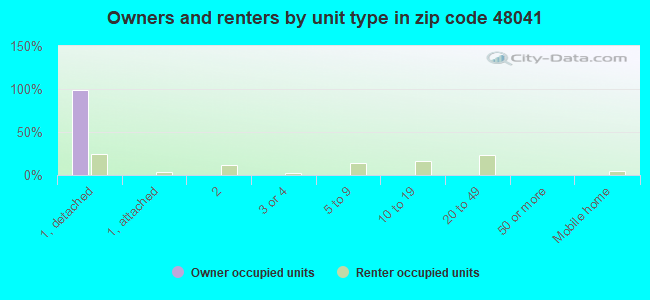
% of renters here:
11%
State:
27%
March 2022 cost of living index in zip code 48041: 90.9 (less than average, U.S. average is 100)
Land area: 40.0 sq. mi. Water area: 0.1 sq. mi.
Population density: 110 people per square mile
(very low).
OSM Map
General Map
Google Map
MSN Map
OSM Map
General Map
Google Map
MSN Map
OSM Map
General Map
Google Map
MSN Map
OSM Map
General Map
Google Map
MSN Map
Please wait while loading the map...
Real estate property taxes paid for housing units in 2022:
This zip code:
0.9% ($2,652)
Michigan:
1.2% ($2,746)
Median real estate property taxes paid for housing units with mortgages in 2022: $2,581 (0.8%) Median real estate property taxes paid for housing units with no mortgage in 2022: $2,775 (1.0%)
Business Search- 14 Million verified businesses
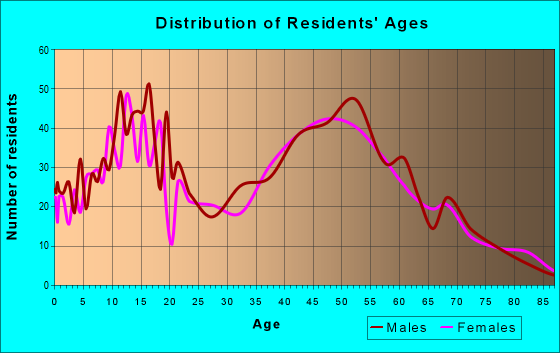
Males: 2,314
(52.5%)
Females: 2,090
(47.5%)
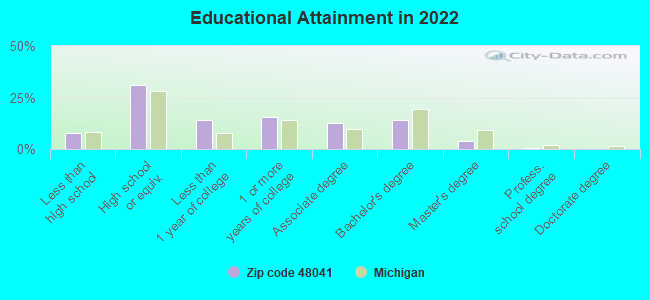
For population 25 years and over in 48041:
High school or higher: 91.5%
Bachelor's degree or higher: 18.4%
Graduate or professional degree: 4.2%
Unemployed: 3.4%
Mean travel time to work (commute): 35.6 minutes
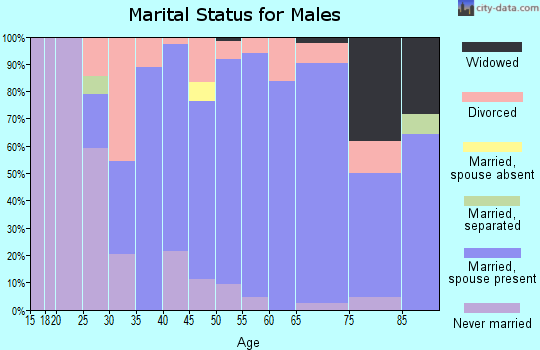
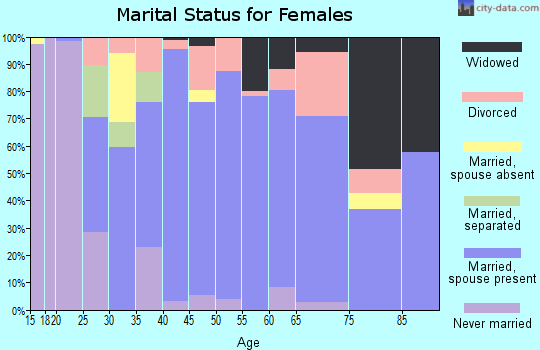
For population 15 years and over in 48041:
Never married: 27.4%
Now married: 56.9%
Separated: 0.2%
Widowed: 5.8%
Divorced: 9.6%
Zip code 48041 compared to state average:
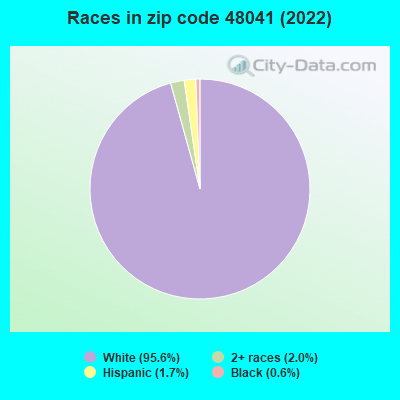
Black race population percentage significantly below state average.
Hispanic race population percentage significantly below state average.
Median age above state average.
Foreign-born population percentage significantly below state average.
Renting percentage significantly below state average.
Length of stay since moving in significantly above state average.
Percentage of population with a bachelor's degree or higher below state average.
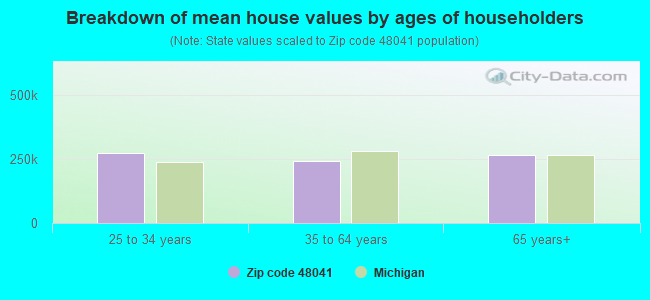
Estimated median house/condo value in 2022: $289,901
48041:
$289,901
Michigan:
$224,400
According to our research of Michigan and other state lists, there were 7 registered sex offenders living in 48041 zip code as of April 19, 2024. The ratio of all residents to sex offenders in zip code 48041 is 657 to 1. The ratio of registered sex offenders to all residents in this zip code is lower than the state average.
Median resident age:
This zip code:
46.3 years
Michigan median age:
40.3 years
Average household size:
This zip code:
2.4 people
Michigan:
2.4 people
Averages for the 2020 tax year for zip code 48041, filed in 2021:
Average Adjusted Gross Income (AGI) in 2020: $61,917 (Individual Income Tax Returns)
Here:
$61,917
State:
$68,945
Salary/wage: $57,716 (reported on 80.0% of returns)
Here:
$57,716
State:
$57,142
(% of AGI for various income ranges: 1073.1% for AGIs below $25k, 3367.2% for AGIs $25k-50k, 6273.2% for AGIs $50k-75k, 8759.5% for AGIs $75k-100k, 15524.6% for AGIs $100k-200k, 36813.3% for AGIs over 200k)
Taxable interest for individuals: $807 (reported on 31.4% of returns)
This zip code:
$807
Michigan:
$1,630
(% of AGI for various income ranges: 24.6% for AGIs below $25k, 25.6% for AGIs $25k-50k, 31.1% for AGIs $50k-75k, 36.7% for AGIs $75k-100k, 55.4% for AGIs $100k-200k, 213.3% for AGIs over 200k)
Ordinary dividends: $2,151 (reported on 17.7% of returns)
Here:
$2,151
State:
$6,972
(% of AGI for various income ranges: 18.7% for AGIs below $25k, 24.4% for AGIs $25k-50k, 58.9% for AGIs $50k-75k, 47.1% for AGIs $75k-100k, 169.6% for AGIs $100k-200k)
Net capital gain/loss in AGI: +$4,206 (reported on 15.9% of returns)
Here:
+$4,206
State:
+$20,064
(% of AGI for various income ranges: 30.5% for AGIs $25k-50k, 35.4% for AGIs $50k-75k, 53.3% for AGIs $75k-100k, 475.8% for AGIs $100k-200k)
Profit/loss from business: +$7,103 (reported on 13.2% of returns)
Here:
+$7,103
State:
+$11,172
(% of AGI for various income ranges: 115.9% for AGIs below $25k, 117.9% for AGIs $25k-50k, 173.2% for AGIs $50k-75k, 78.1% for AGIs $75k-100k, 207.9% for AGIs $100k-200k)
Taxable individual retirement arrangement distribution: $14,962 (reported on 9.5% of returns)
48041:
$14,962
Michigan:
$19,803
(% of AGI for various income ranges: 78.7% for AGIs below $25k, 157.9% for AGIs $25k-50k, 196.1% for AGIs $50k-75k, 203.3% for AGIs $75k-100k, 517.9% for AGIs $100k-200k)
Total itemized deductions: $24,030 (reported on 4.5% of returns)
Here:
$24,030
State:
$34,117
(% of AGI for various income ranges: 156.2% for AGIs below $25k, 216.1% for AGIs $50k-75k, 495.4% for AGIs $100k-200k)
Charity contributions: $4,700 (reported on 3.6% of returns)
Here:
$4,700
State:
$13,548
(% of AGI for various income ranges: 14.9% for AGIs $25k-50k, 132.5% for AGIs $100k-200k)
Taxes paid: $7,270 (reported on 4.5% of returns)
48041:
$7,270
State:
$7,972
(% of AGI for various income ranges: 36.7% for AGIs below $25k, 66.4% for AGIs $50k-75k, 165.8% for AGIs $100k-200k)
Earned income credit: $1,795 (reported on 8.6% of returns)
Here:
$1,795
State:
$2,251
(% of AGI for various income ranges: 55.9% for AGIs below $25k, 31.5% for AGIs $25k-50k)
Percentage of individuals using paid preparers for their 2020 taxes: 92.7%
Here:
93%
State:
93%
(% for various income ranges: 90.6% for AGIs below $25k, 94.1% for AGIs $25k-50k, 91.9% for AGIs $50k-75k, 92.9% for AGIs $75k-100k, 94.3% for AGIs $100k-200k, 100.0% for AGIs over 200k)
Averages for the 2012 tax year for zip code 48041, filed in 2013:
Average Adjusted Gross Income (AGI) in 2012: $51,006 (Individual Income Tax Returns)
Here:
$51,006
State:
$55,609
Salary/wage: $47,270 (reported on 83.7% of returns)
Here:
$47,270
State:
$46,782
(% of AGI for various income ranges: 65.8% for AGIs below $25k, 68.0% for AGIs $25k-50k, 77.8% for AGIs $50k-75k, 83.1% for AGIs $75k-100k, 97.9% for AGIs $100k-200k)
Taxable interest for individuals: $737 (reported on 36.1% of returns)
This zip code:
$737
Michigan:
$1,491
(% of AGI for various income ranges: 1.4% for AGIs below $25k, 1.0% for AGIs $25k-50k, 0.3% for AGIs $50k-75k, 0.3% for AGIs $75k-100k, 0.4% for AGIs $100k-200k)
Ordinary dividends: $1,410 (reported on 19.2% of returns)
Here:
$1,410
State:
$6,225
(% of AGI for various income ranges: 1.2% for AGIs below $25k, 1.1% for AGIs $25k-50k, 0.4% for AGIs $50k-75k, 0.2% for AGIs $75k-100k, 0.5% for AGIs $100k-200k)
Profit/loss from business: +$7,777 (reported on 12.5% of returns)
Here:
+$7,777
State:
+$11,523
(% of AGI for various income ranges: 5.9% for AGIs below $25k, 4.7% for AGIs $25k-50k, 1.4% for AGIs $50k-75k, 0.2% for AGIs $75k-100k, 1.3% for AGIs $100k-200k)
Taxable individual retirement arrangement distribution: $12,304 (reported on 12.0% of returns)
48041:
$12,304
Michigan:
$15,298
(% of AGI for various income ranges: 3.9% for AGIs below $25k, 3.8% for AGIs $25k-50k, 2.4% for AGIs $50k-75k, 2.1% for AGIs $75k-100k, 3.7% for AGIs $100k-200k)
Total itemized deductions: $17,507 (21% of AGI, reported on 34.1% of returns)
Here:
$17,507
State:
$21,628
Here:
20.6% of AGI
State:
18.4% of AGI
(% of AGI for various income ranges: 9.3% for AGIs below $25k, 10.3% for AGIs $25k-50k, 12.2% for AGIs $50k-75k, 12.3% for AGIs $75k-100k, 13.1% for AGIs $100k-200k, 8.6% for AGIs over 200k)
Charity contributions: $2,060 (reported on 27.4% of returns)
Here:
$2,060
State:
$4,225
(% of AGI for various income ranges: 0.4% for AGIs below $25k, 0.8% for AGIs $25k-50k, 0.9% for AGIs $50k-75k, 1.2% for AGIs $75k-100k, 1.8% for AGIs $100k-200k)
Taxes paid: $5,976 (reported on 34.1% of returns)
48041:
$5,976
State:
$8,327
(% of AGI for various income ranges: 1.9% for AGIs below $25k, 2.8% for AGIs $25k-50k, 3.5% for AGIs $50k-75k, 4.1% for AGIs $75k-100k, 5.2% for AGIs $100k-200k, 5.2% for AGIs over 200k)
Earned income credit: $1,893 (reported on 13.5% of returns)
Here:
$1,893
State:
$2,306
(% of AGI for various income ranges: 4.4% for AGIs below $25k, 0.9% for AGIs $25k-50k)
Percentage of individuals using paid preparers for their 2012 taxes: 62.5%
Here:
62%
State:
57%
(% for various income ranges: 57.7% for AGIs below $25k, 65.1% for AGIs $25k-50k, 66.7% for AGIs $50k-75k, 66.7% for AGIs $75k-100k, 68.0% for AGIs $100k-200k)
Averages for the 2004 tax year for zip code 48041, filed in 2005:
Average Adjusted Gross Income (AGI) in 2004: $47,153 (Individual Income Tax Returns)
Here:
$47,153
State:
$48,204
Salary/wage: $45,768 (reported on 87.7% of returns)
Here:
$45,768
State:
$42,791
(% of AGI for various income ranges: 137.2% for AGIs below $10k, 69.6% for AGIs $10k-25k, 79.5% for AGIs $25k-50k, 86.3% for AGIs $50k-75k, 91.2% for AGIs $75k-100k, 83.0% for AGIs over 100k)
Taxable interest for individuals: $835 (reported on 55.8% of returns)
This zip code:
$835
Michigan:
$1,725
(% of AGI for various income ranges: 4.9% for AGIs below $10k, 3.1% for AGIs $10k-25k, 1.3% for AGIs $25k-50k, 0.7% for AGIs $50k-75k, 0.7% for AGIs $75k-100k, 0.7% for AGIs over 100k)
Taxable dividends: $1,105 (reported on 23.0% of returns)
Here:
$1,105
State:
$3,420
(% of AGI for various income ranges: 3.8% for AGIs below $10k, 1.1% for AGIs $10k-25k, 0.6% for AGIs $25k-50k, 0.4% for AGIs $50k-75k, 0.6% for AGIs $75k-100k, 0.3% for AGIs over 100k)
Net capital gain/loss: +$4,348 (reported on 14.8% of returns)
Here:
+$4,348
State:
+$8,532
(% of AGI for various income ranges: 1.9% for AGIs below $10k, 0.3% for AGIs $10k-25k, 0.7% for AGIs $25k-50k, 0.5% for AGIs $50k-75k, 0.5% for AGIs $75k-100k, 3.8% for AGIs over 100k)
Profit/loss from business: +$4,367 (reported on 14.0% of returns)
Here:
+$4,367
State:
+$9,547
(% of AGI for various income ranges: 10.2% for AGIs below $10k, 3.2% for AGIs $10k-25k, 3.1% for AGIs $25k-50k, 1.6% for AGIs $50k-75k, -0.0% for AGIs $75k-100k, 0.4% for AGIs over 100k)
IRA payment deduction: $2,682 (reported on 2.2% of returns)
48041:
$2,682
Michigan:
$2,875
Total itemized deductions: $16,308 (22% of AGI, reported on 46.3% of returns)
Here:
$16,308
State:
$18,509
Here:
22.4% of AGI
State:
20.7% of AGI
(% of AGI for various income ranges: 21.7% for AGIs below $10k, 11.7% for AGIs $10k-25k, 16.5% for AGIs $25k-50k, 17.6% for AGIs $50k-75k, 17.1% for AGIs $75k-100k, 13.9% for AGIs over 100k)
Charity contributions deductions: $1,914 (3% of AGI, reported on 42.3% of returns)
Here:
$1,914
State:
$3,365
Here:
2.6% of AGI
State:
3.6% of AGI
(% of AGI for various income ranges: 1.0% for AGIs below $10k, 1.1% for AGIs $10k-25k, 1.2% for AGIs $25k-50k, 1.7% for AGIs $50k-75k, 1.9% for AGIs $75k-100k, 2.0% for AGIs over 100k)
Total tax: $5,634 (reported on 79.1% of returns)
48041:
$5,634
State:
$7,691
(% of AGI for various income ranges: 4.8% for AGIs below $10k, 4.4% for AGIs $10k-25k, 6.6% for AGIs $25k-50k, 8.0% for AGIs $50k-75k, 9.6% for AGIs $75k-100k, 14.2% for AGIs over 100k)
Earned income credit: $1,480 (reported on 9.9% of returns)
Here:
$1,480
State:
$1,737
Percentage of individuals using paid preparers for their 2004 taxes: 64.1%
Here:
64%
State:
60%
(% for various income ranges: 53.8% for AGIs below $10k, 63.6% for AGIs $10k-25k, 69.6% for AGIs $25k-50k, 67.2% for AGIs $50k-75k, 64.4% for AGIs $75k-100k, 67.1% for AGIs over 100k)
Household received Food Stamps/SNAP in the past 12 months: 115 Household did not receive Food Stamps/SNAP in the past 12 months: 1,667
Women who had a birth in the past 12 months: 61 (44 now married, 17 unmarried) Women who did not have a birth in the past 12 months: 919 (419 now married, 498 unmarried)
Housing units in zip code 48041 with a mortgage: 895 (166 second mortgage, 108 both second mortgage and home equity loan) Houses without a mortgage: 20
Median monthly owner costs for units with a mortgage: $1,596 Median monthly owner costs for units without a mortgage: $532
Residents with income below the poverty level in 2022:
This zip code:
10.4%
Whole state:
13.4%
Residents with income below 50% of the poverty level in 2022:
This zip code:
7.2%
Whole state:
6.9%
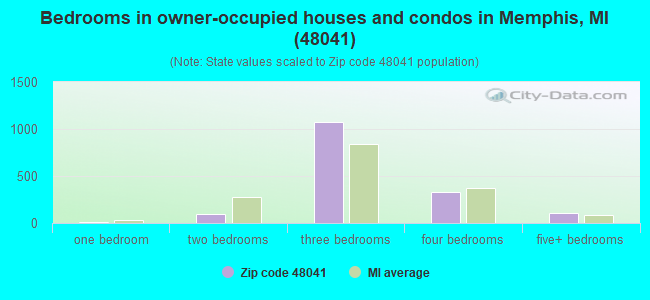
Median number of rooms in houses and condos:
Here:
6.5
State:
6.5
Median number of rooms in apartments:
Here:
3.4
State:
4.3
Notable locations in this zip code not listed on our city pages
Notable locations in zip code 48041: Belle River Golf and Country Club (A), Memphis Public Library (B), Memphis Volunteer Fire Department (C). Display/hide their locations on the map
Churches in zip code 48041 include: All Saints Church (A), First United Methodist Church (B), Saint Andrew Lutheran Church (C), Free Methodist Church (D), Fellowship Baptist Church (E). Display/hide their locations on the map
Streams, rivers, and creeks: Loomis Drain (A), Tallmadge Drain (B), Sumner Drain (C), Sage Creek (D), Burgess Drain (E). Display/hide their locations on the map
613 married couples with children.
138 single-parent households (16 men, 122 women).
97.9% of residents of 48041 zip code speak English at home.
0.4% of residents speak Spanish at home (100% very well).
0.6% of residents speak other Indo-European language at home (50% very well, 50% well).
0.1% of residents speak Asian or Pacific Island language at home (20% very well, 80% well).
0.3% of residents speak other language at home (100% very well).
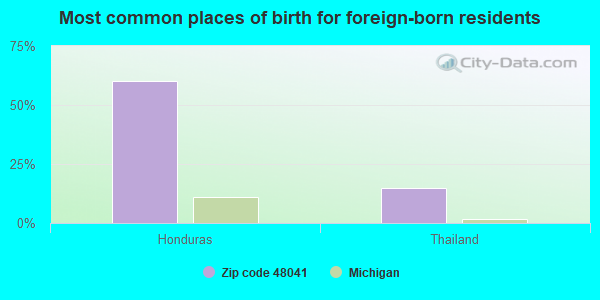
Foreign born population: 19 (0.4%) (20.8% of them are naturalized citizens)
This zip code:
0.4%
Whole state:
6.9%
60%Honduras
15%Thailand
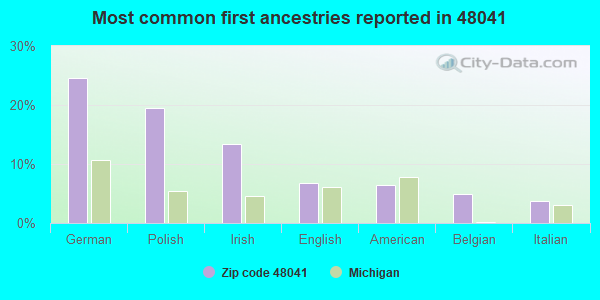
25%German
19%Polish
13%Irish
7%English
6%American
5%Belgian
4%Italian
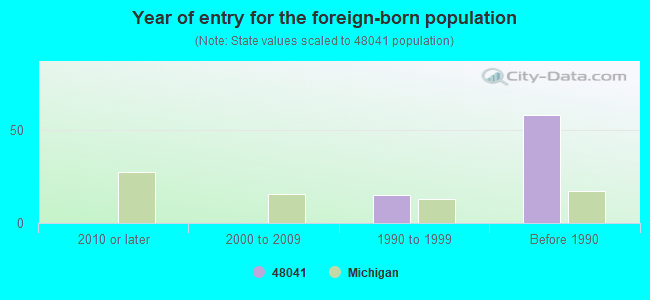
Year of entry for the foreign-born population
02010 or later
02000 to 2009
151990 to 1999
58Before 1990
Facilities with environmental interests located in this zip code:
MEMPHIS ELEMENTARY SCHOOL (34165 BORDMAN ROAD in MEMPHIS, MI)
(National Center for Education Statistics) - STATE ID-06672 Organizations: MEMPHIS COMMUNITY SCHOOLS (SCHOOL DISTRICT)
MEMPHIS HIGH SCHOOL (34130 BORDMAN ROAD in MEMPHIS, MI)
(National Center for Education Statistics) - STATE ID-05673 Organizations: MEMPHIS COMMUNITY SCHOOLS (SCHOOL DISTRICT)
MEMPHIS JUNIOR HIGH SCHOOL (34130 BORDMAN ROAD in MEMPHIS, MI)
(National Center for Education Statistics) - STATE ID-02510 Organizations: MEMPHIS COMMUNITY SCHOOLS (SCHOOL DISTRICT)
MEMPHIS AUTO CENTER (35065 BORDMAN ST in MEMPHIS, MI)
(Resource Conservation and Recovery Act (tracking hazardous waste)) Organizations: HARRY FEYERS (CONTACT/OWNER)
MEMPHIS WWSL (PARK ST in MEMPHIS, MI)
National Pollutant Discharge Elimination System NON-MAJOR (Tracking pollutant discharge elimination systems) - permit Business SIC classification: SEWERAGE SYSTEMS
MI DEPT/TRANSPORTATION BRIDGE B01-77011 (M 19 OVER BELLE RIBER in MEMPHIS, MI)
(Resource Conservation and Recovery Act (tracking hazardous waste)) Organizations: MICH DEPT OF TRANSPORTATION (CONTACT/OPERATOR)
GRACE ENGINEERING CORP (81620 BELLE RIVER RD in MEMPHIS, MI)
Small Quantity Generators, between 100 kg and 1000 kg of hazardous waste/month (Resource Conservation and Recovery Act (tracking hazardous waste)) Business NAICS classification: PRECISION TURNED PRODUCT MANUFACTURING. Organizations: GRACE LOUIS JR (CONTACT/OPERATOR)
, LOUIS GRACE (CONTACT/OWNER)
EMPIRE TOOL COMPANY (11500 LAMBS RD in MEMPHIS, MI)
Conditionally Exempt Small Quantity Generators, less than 100 kg/month of hazardous waste (Resource Conservation and Recovery Act (tracking hazardous waste)) Business NAICS classification: MACHINE TOOL (METAL CUTTING TYPES) MANUFACTURING. Organizations: JON C WHITEMAN (CONTACT/OPERATOR)
Housing units lacking complete plumbing facilities: 0.5% Housing units lacking complete kitchen facilities: 3.3%
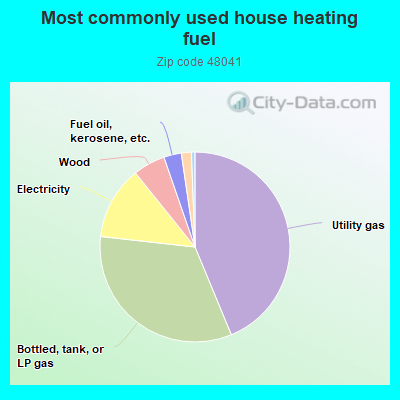
43.9%Utility gas
33.1%Bottled, tank, or LP gas
12.5%Electricity
5.5%Wood
3.0%Fuel oil, kerosene, etc.
1.7%No fuel used
0.6%Other fuel
Population in 1990: 3,328. Population change in the 1990s: +1,002 (+30.1%).
Place of birth for U.S.-born residents:
This state: 3,982
Northeast: 80
Midwest: 66
South: 92
West: 96
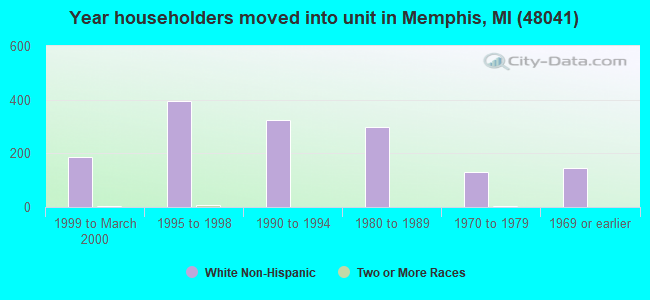
67% of the 48041 zip code residents lived in the same house 5 years ago. Out of people who lived in different houses, 33% lived in this county. Out of people who lived in different counties, 50% lived in Michigan.
96% of the 48041 zip code residents lived in the same house 1 year ago. Out of people who lived in different houses, 31% moved from this county. Out of people who lived in different houses, 72% moved from different county within same state. Out of people who lived in different houses, 3% moved from different state.
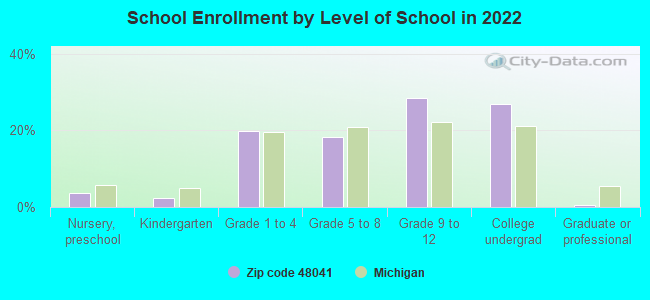
Private vs. public school enrollment:
Students in private schools in grades 1 to 8 (elementary and middle school): 63
Here:
16.6%
Michigan:
12.4%
Students in private schools in grades 9 to 12 (high school): 71
Here:
25.2%
Michigan:
9.8%
Students in private undergraduate colleges: 15
Here:
5.6%
Michigan:
14.9%
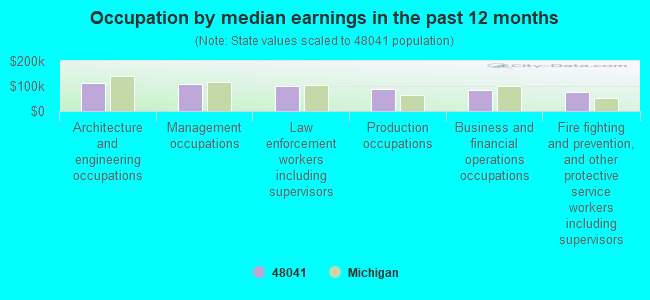
Occupation by median earnings in the past 12 months ($)
113,553Architecture and engineering occupations
106,942Management occupations
101,084Law enforcement workers including supervisors
88,055Production occupations
85,657Business and financial operations occupations
76,269Fire fighting and prevention, and other protective service workers including supervisors
Top industries in this zip code by the number of employees in 2005:
Health Care and Social Assistance: Residential Mental Health and Substance Abuse Facilities (100-249 employees: 1 establishment)
Accommodation and Food Services: Full-Service Restaurants (10-19: 3, 1-4: 1)
Health Care and Social Assistance: Homes for the Elderly (10-19: 1, 1-4: 1)
Other Services (except Public Administration): Religious Organizations (5-9: 1, 1-4: 2)
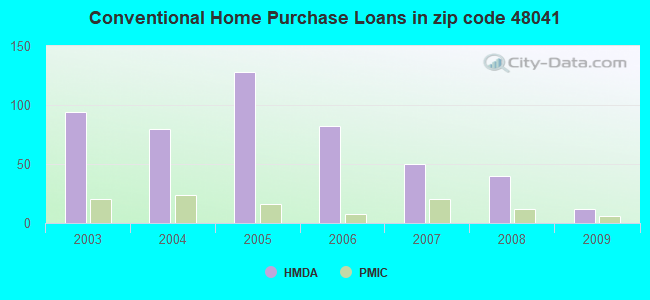
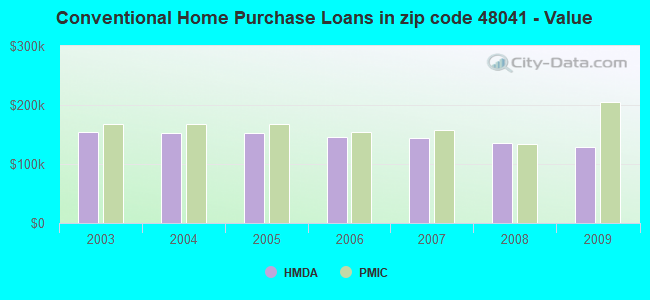
Detailed PMIC statistics for the following Tracts:6585.00
2002 - 2018 National Fire Incident Reporting System (NFIRS) incidents
Based on the data from the years 2002 - 2018 the average number of fire incidents per year is 16. The highest number of reported fire incidents - 25 took place in 2009, and the least - 8 in 2004. The data has a dropping trend.
When looking into fire subcategories, the most reports belonged to: Structure Fires (50.4%), and Outside Fires (28.8%).
Fire incident types reported to NFIRS in Zip Code 48041


 Nearest zip codes: 48022, 48062, 48002, 48027, 48063, 48005.


 Based on the data from the years 2002 - 2018 the average number of fire incidents per year is 16. The highest number of reported fire incidents - 25 took place in 2009, and the least - 8 in 2004. The data has a dropping trend.
 When looking into fire subcategories, the most reports belonged to: Structure Fires (50.4%), and Outside Fires (28.8%).