Estimated zip code population in 2022: 26,880 Zip code population in 2010: 32,262 Zip code population in 2000: 38,895
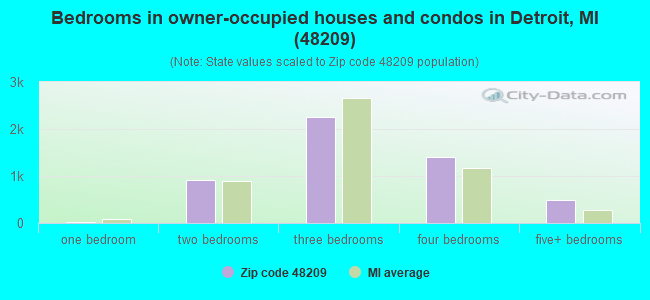
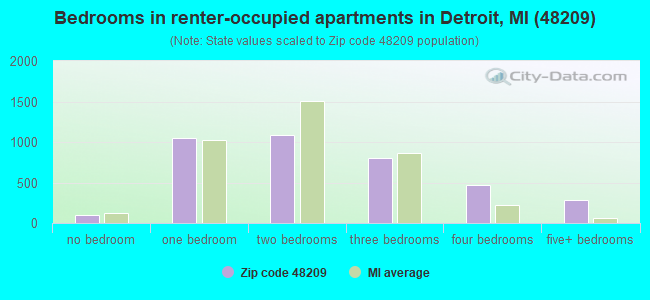
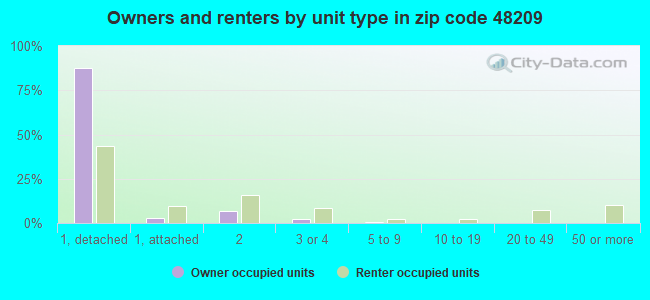
Houses and condos: 10,883 Renter-occupied apartments: 3,744
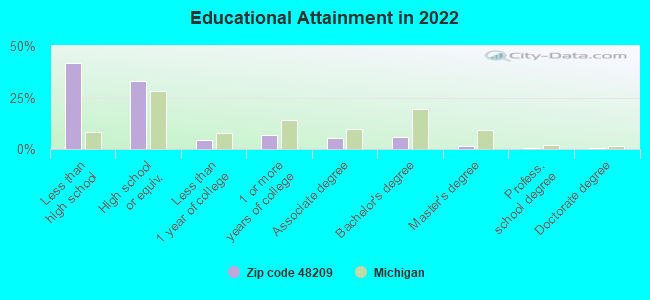
% of renters here:
42%
State:
27%
March 2022 cost of living index in zip code 48209: 93.5 (less than average, U.S. average is 100)
Land area: 6.8 sq. mi. Water area: 0.1 sq. mi.
Population density: 3,978 people per square mile
(average).
OSM Map
General Map
Google Map
MSN Map
OSM Map
General Map
Google Map
MSN Map
OSM Map
General Map
Google Map
MSN Map
OSM Map
General Map
Google Map
MSN Map
Please wait while loading the map...
Real estate property taxes paid for housing units in 2022:
This zip code:
1.6% ($1,253)
Michigan:
1.2% ($2,746)
Median real estate property taxes paid for housing units with mortgages in 2022: $1,320 (2.0%) Median real estate property taxes paid for housing units with no mortgage in 2022: $1,224 (1.5%)
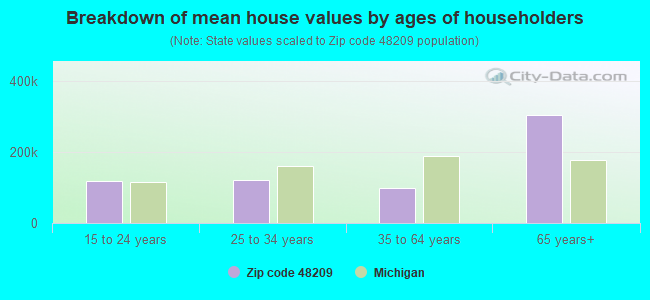
Estimated median house/condo value in 2022: $76,883
48209:
$76,883
Michigan:
$224,400
According to our research of Michigan and other state lists, there were 66 registered sex offenders living in 48209 zip code as of April 23, 2024. The ratio of all residents to sex offenders in zip code 48209 is 505 to 1. The ratio of registered sex offenders to all residents in this zip code is lower than the state average.
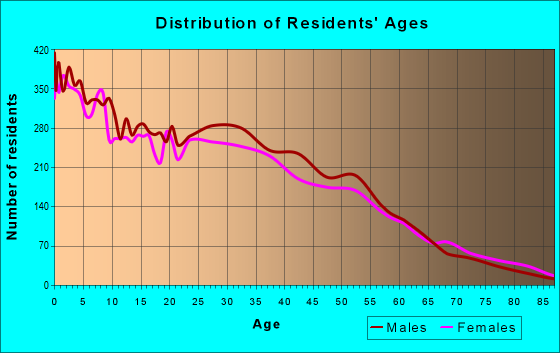
Median resident age:
This zip code:
30.2 years
Michigan median age:
40.3 years
Average household size:
This zip code:
3.0 people
Michigan:
2.4 people
Averages for the 2020 tax year for zip code 48209, filed in 2021:
Average Adjusted Gross Income (AGI) in 2020: $29,467 (Individual Income Tax Returns)
Here:
$29,467
State:
$68,945
Salary/wage: $28,837 (reported on 77.7% of returns)
Here:
$28,837
State:
$57,142
(% of AGI for various income ranges: 1067.4% for AGIs below $25k, 3405.1% for AGIs $25k-50k, 6611.6% for AGIs $50k-75k, 9574.1% for AGIs $75k-100k, 15434.5% for AGIs $100k-200k)
Taxable interest for individuals: $222 (reported on 7.5% of returns)
This zip code:
$222
Michigan:
$1,630
(% of AGI for various income ranges: 0.9% for AGIs below $25k, 2.3% for AGIs $25k-50k, 3.0% for AGIs $50k-75k, 15.5% for AGIs $75k-100k, 10.0% for AGIs $100k-200k)
Ordinary dividends: $1,068 (reported on 2.1% of returns)
Here:
$1,068
State:
$6,972
(% of AGI for various income ranges: 1.6% for AGIs below $25k, 0.8% for AGIs $25k-50k, 5.8% for AGIs $50k-75k, 19.5% for AGIs $75k-100k, 37.3% for AGIs $100k-200k)
Net capital gain/loss in AGI: +$4,435 (reported on 2.2% of returns)
Here:
+$4,435
State:
+$20,064
(% of AGI for various income ranges: 1.5% for AGIs below $25k, 5.1% for AGIs $25k-50k, 29.9% for AGIs $50k-75k, 444.5% for AGIs $100k-200k)
Profit/loss from business: +$8,172 (reported on 20.1% of returns)
Here:
+$8,172
State:
+$11,172
(% of AGI for various income ranges: 250.1% for AGIs below $25k, 194.3% for AGIs $25k-50k, 150.9% for AGIs $50k-75k, 214.1% for AGIs $75k-100k, 384.5% for AGIs $100k-200k)
Taxable individual retirement arrangement distribution: $7,522 (reported on 1.0% of returns)
48209:
$7,522
Michigan:
$19,803
(% of AGI for various income ranges: 3.0% for AGIs below $25k, 8.4% for AGIs $25k-50k, 49.5% for AGIs $50k-75k)
Total itemized deductions: $19,820 (reported on 0.5% of returns)
Here:
$19,820
State:
$34,117
(% of AGI for various income ranges: 11.2% for AGIs below $25k, 81.3% for AGIs $50k-75k)
Charity contributions: $5,250 (reported on 0.2% of returns)
Here:
$5,250
State:
$13,548
(% of AGI for various income ranges: 13.8% for AGIs $50k-75k)
Taxes paid: $4,580 (reported on 0.5% of returns)
48209:
$4,580
State:
$7,972
(% of AGI for various income ranges: 30.1% for AGIs $50k-75k)
Earned income credit: $2,834 (reported on 33.6% of returns)
Here:
$2,834
State:
$2,251
(% of AGI for various income ranges: 175.1% for AGIs below $25k, 119.0% for AGIs $25k-50k, 4.7% for AGIs $50k-75k)
Percentage of individuals using paid preparers for their 2020 taxes: 82.1%
Here:
82%
State:
93%
(% for various income ranges: 82.4% for AGIs below $25k, 82.5% for AGIs $25k-50k, 78.4% for AGIs $50k-75k, 82.8% for AGIs $75k-100k, 88.2% for AGIs $100k-200k)
Averages for the 2012 tax year for zip code 48209, filed in 2013:
Average Adjusted Gross Income (AGI) in 2012: $22,859 (Individual Income Tax Returns)
Here:
$22,859
State:
$55,609
Salary/wage: $22,247 (reported on 84.4% of returns)
Here:
$22,247
State:
$46,782
(% of AGI for various income ranges: 75.9% for AGIs below $25k, 88.8% for AGIs $25k-50k, 84.3% for AGIs $50k-75k, 82.4% for AGIs $75k-100k, 64.1% for AGIs $100k-200k)
Taxable interest for individuals: $415 (reported on 6.9% of returns)
This zip code:
$415
Michigan:
$1,491
(% of AGI for various income ranges: 0.1% for AGIs below $25k, 0.2% for AGIs $50k-75k, 0.6% for AGIs $100k-200k)
Ordinary dividends: $1,406 (reported on 1.6% of returns)
Here:
$1,406
State:
$6,225
(% of AGI for various income ranges: 0.1% for AGIs $25k-50k, 0.3% for AGIs $75k-100k)
Net capital gain/loss in AGI: +$3,682 (reported on 1.1% of returns)
Here:
+$3,682
State:
+$9,326
(% of AGI for various income ranges: 1.3% for AGIs $50k-75k)
Profit/loss from business: +$9,634 (reported on 17.4% of returns)
Here:
+$9,634
State:
+$11,523
(% of AGI for various income ranges: 16.3% for AGIs below $25k, 2.2% for AGIs $25k-50k, 1.6% for AGIs $50k-75k)
Taxable individual retirement arrangement distribution: $11,743 (reported on 1.4% of returns)
48209:
$11,743
Michigan:
$15,298
(% of AGI for various income ranges: 0.3% for AGIs below $25k, 0.2% for AGIs $25k-50k, 1.5% for AGIs $50k-75k, 7.2% for AGIs $75k-100k)
Total itemized deductions: $15,386 (29% of AGI, reported on 4.3% of returns)
Here:
$15,386
State:
$21,628
Here:
29.4% of AGI
State:
18.4% of AGI
(% of AGI for various income ranges: 0.9% for AGIs below $25k, 2.6% for AGIs $25k-50k, 6.5% for AGIs $50k-75k, 5.9% for AGIs $75k-100k, 10.0% for AGIs $100k-200k)
Charity contributions: $2,438 (reported on 2.4% of returns)
Here:
$2,438
State:
$4,225
(% of AGI for various income ranges: 0.2% for AGIs $25k-50k, 0.6% for AGIs $50k-75k, 0.5% for AGIs $75k-100k, 0.8% for AGIs $100k-200k)
Taxes paid: $4,219 (reported on 4.3% of returns)
48209:
$4,219
State:
$8,327
(% of AGI for various income ranges: 0.2% for AGIs below $25k, 0.6% for AGIs $25k-50k, 1.8% for AGIs $50k-75k, 2.6% for AGIs $75k-100k, 4.1% for AGIs $100k-200k)
Earned income credit: $3,106 (reported on 37.1% of returns)
Here:
$3,106
State:
$2,306
(% of AGI for various income ranges: 11.2% for AGIs below $25k, 1.8% for AGIs $25k-50k)
Percentage of individuals using paid preparers for their 2012 taxes: 60.9%
Here:
61%
State:
57%
(% for various income ranges: 60.8% for AGIs below $25k, 60.5% for AGIs $25k-50k, 66.0% for AGIs $50k-75k, 54.5% for AGIs $75k-100k, 50.0% for AGIs $100k-200k)
Averages for the 2004 tax year for zip code 48209, filed in 2005:
Average Adjusted Gross Income (AGI) in 2004: $24,291 (Individual Income Tax Returns)
Here:
$24,291
State:
$48,204
Salary/wage: $23,343 (reported on 90.0% of returns)
Here:
$23,343
State:
$42,791
(% of AGI for various income ranges: 83.4% for AGIs below $10k, 83.7% for AGIs $10k-25k, 89.1% for AGIs $25k-50k, 88.4% for AGIs $50k-75k, 81.7% for AGIs $75k-100k, 76.1% for AGIs over 100k)
Taxable interest for individuals: $745 (reported on 16.9% of returns)
This zip code:
$745
Michigan:
$1,725
(% of AGI for various income ranges: 1.4% for AGIs below $10k, 0.7% for AGIs $10k-25k, 0.4% for AGIs $25k-50k, 0.4% for AGIs $50k-75k, 0.4% for AGIs $75k-100k, 0.5% for AGIs over 100k)
Taxable dividends: $1,086 (reported on 4.2% of returns)
Here:
$1,086
State:
$3,420
(% of AGI for various income ranges: 0.6% for AGIs below $10k, 0.2% for AGIs $10k-25k, 0.1% for AGIs $25k-50k, 0.3% for AGIs $50k-75k, 0.2% for AGIs $75k-100k, 0.1% for AGIs over 100k)
Net capital gain/loss: +$4,291 (reported on 2.6% of returns)
Here:
+$4,291
State:
+$8,532
(% of AGI for various income ranges: -0.2% for AGIs below $10k, 0.1% for AGIs $10k-25k, 0.3% for AGIs $25k-50k, 0.6% for AGIs $50k-75k, 2.9% for AGIs $75k-100k, 0.7% for AGIs over 100k)
Profit/loss from business: +$5,734 (reported on 8.5% of returns)
Here:
+$5,734
State:
+$9,547
(% of AGI for various income ranges: 5.6% for AGIs below $10k, 4.4% for AGIs $10k-25k, 1.3% for AGIs $25k-50k, 0.3% for AGIs $50k-75k, -0.0% for AGIs $75k-100k)
IRA payment deduction: $2,615 (reported on 0.4% of returns)
48209:
$2,615
Michigan:
$2,875
Total itemized deductions: $13,259 (27% of AGI, reported on 8.8% of returns)
Here:
$13,259
State:
$18,509
Here:
27.2% of AGI
State:
20.7% of AGI
(% of AGI for various income ranges: 2.1% for AGIs below $10k, 1.8% for AGIs $10k-25k, 4.9% for AGIs $25k-50k, 7.2% for AGIs $50k-75k, 8.0% for AGIs $75k-100k, 12.0% for AGIs over 100k)
Charity contributions deductions: $2,028 (4% of AGI, reported on 7.1% of returns)
Here:
$2,028
State:
$3,365
Here:
4.0% of AGI
State:
3.6% of AGI
(% of AGI for various income ranges: 0.1% for AGIs below $10k, 0.3% for AGIs $10k-25k, 0.5% for AGIs $25k-50k, 1.0% for AGIs $50k-75k, 1.2% for AGIs $75k-100k, 1.1% for AGIs over 100k)
Total tax: $2,404 (reported on 48.3% of returns)
48209:
$2,404
State:
$7,691
(% of AGI for various income ranges: 2.2% for AGIs below $10k, 2.5% for AGIs $10k-25k, 3.7% for AGIs $25k-50k, 7.5% for AGIs $50k-75k, 10.7% for AGIs $75k-100k, 15.1% for AGIs over 100k)
Earned income credit: $1,949 (reported on 32.6% of returns)
Here:
$1,949
State:
$1,737
Percentage of individuals using paid preparers for their 2004 taxes: 71.5%
Here:
71%
State:
60%
(% for various income ranges: 68.2% for AGIs below $10k, 72.6% for AGIs $10k-25k, 72.1% for AGIs $25k-50k, 74.0% for AGIs $50k-75k, 70.5% for AGIs $75k-100k, 69.5% for AGIs over 100k)
Likely homosexual households (counted as self-reported same-sex unmarried-partner households)
Lesbian couples: 0.1% of all households
Gay men: 0.0% of all households
Household received Food Stamps/SNAP in the past 12 months: 2,891 Household did not receive Food Stamps/SNAP in the past 12 months: 6,134
Women who had a birth in the past 12 months: 396 (239 now married, 155 unmarried) Women who did not have a birth in the past 12 months: 5,859 (2,369 now married, 3,488 unmarried)
Housing units in zip code 48209 with a mortgage: 1,037 (28 second mortgage, 5 both second mortgage and home equity loan) Houses without a mortgage: 43
Median monthly owner costs for units with a mortgage: $978 Median monthly owner costs for units without a mortgage: $504
Residents with income below the poverty level in 2022:
This zip code:
37.0%
Whole state:
13.4%
Residents with income below 50% of the poverty level in 2022:
This zip code:
19.4%
Whole state:
6.9%
Median number of rooms in houses and condos:
Here:
6.3
State:
6.5
Median number of rooms in apartments:
Here:
5.0
State:
4.3
Notable locations in this zip code not listed on our city pages
Notable locations in zip code 48209: Detroit Marine Terminal (A), Forman Playground (B), City of Detroit Fire Department Emergency Medical Services Medic 9 / Medic 19 (C), City of Detroit Public Lighting Commission (D), City of Detroit Fire Department Engine 27 Ladder 8 (E), City of Detroit Fire Department Engine 29 (F), City of Detroit Fire Department Engine 33 Ladder 13 (G), City of Detroit Fire Department Engine 37 (H), Detroit Southwest City Hall (I), Precinct 4 Police Station (J), James Valentine Campbell Library (K). Display/hide their locations on the map
Churches in zip code 48209 include: New Greater Love Missionary Baptist Church (A), Trinity-Saint Mark's United Church of Christ (B), Old Landmark Church of God in Christ (C), Paul the Apostle Lutheran Church (D), Peter's Rock Missionary Baptist Church (E), Military Avenue Church (F), Shiloh Free Will Baptist Church (G), Solvey Church of God in Christ (H), Southwest United Presbyterian Church (I). Display/hide their locations on the map
Parks in zip code 48209 include: Weiss Playground (1), Boyer Playground (2), Clark Park (3), Detroit Copper and Brass Historical Marker (4), Ford Hunger March Historical Marker (5), Fort Wayne Historical Marker (6), Patton Memorial Park (7), Riverside Park (8). Display/hide their locations on the map
Tourist attraction (not listed on the city page) : Infiniter Press (Cultural Attractions- Events- & Facilities; 2104 McKinstry Street).
In group quarters: 46 (-1 institutionalized population)
Size of family households: 1,386 2-persons, 1,297 3-persons, 1,214 4-persons, 712 5-persons, 666 6-persons, 326 7-or-more-persons
Size of nonfamily households: 2,800 1-person, 403 2-persons, 37 3-persons
4,452 married couples with children.
2,778 single-parent households (831 men, 1,947 women).
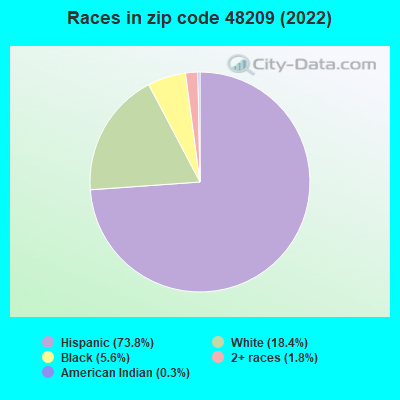
39.0% of residents of 48209 zip code speak English at home.
62.3% of residents speak Spanish at home (49% very well, 25% well, 16% not well, 9% not at all).
0.1% of residents speak other Indo-European language at home (70% very well, 30% well).
0.2% of residents speak Asian or Pacific Island language at home (50% very well, 29% well, 21% not well).
1.0% of residents speak other language at home (46% very well, 30% well, 24% not well).
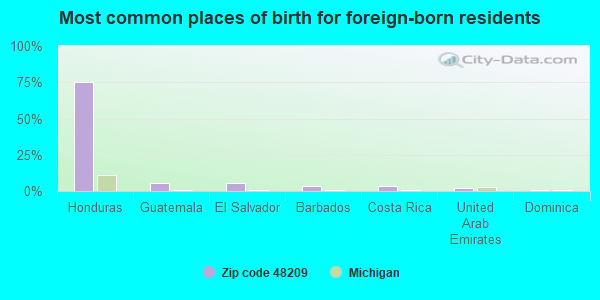
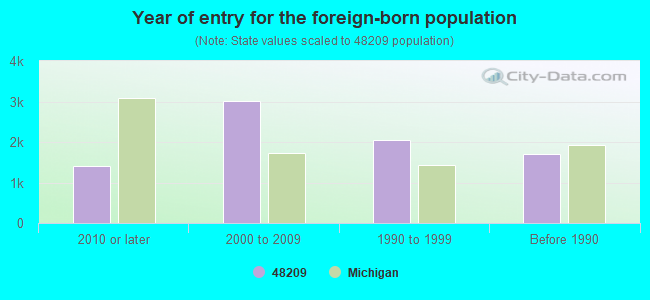
Foreign born population: 6,885 (25.6%) (22.8% of them are naturalized citizens)
Major facilities with environmental interests located in this zip code:
DETROIT WASTEWATER TREATMENT PLANT (9300 WEST JEFFERSON AVENUE in DETROIT, MI)
AIR MAJOR (AIRS/AFS) (Integrated Compliance Information System) - ICIS-05-1977-0007, FORMAL ENFORCEMENT ACTION, ICIS-05-1978-0030, ICIS-05-1982-0056, COMPLIANCE ACTIVITY (Tracking inspections of insecticide, fungicide, and rodenticide, and toxic substances) CRITERIA AND HAZARDOUS AIR POLLUTANT INVENTORY (Inventory of air pollution sources) National Pollutant Discharge Elimination System MAJOR (Tracking pollutant discharge elimination systems) - permit - ICIS-, ENFORCEMENT/COMPLIANCE ACTIVITY (Resource Conservation and Recovery Act (tracking hazardous waste)) Business SIC classification: SEWERAGE SYSTEMS; REFUSE SYSTEMS Business NAICS classification: SEWAGE TREATMENT FACILITIES. Organizations: DETROIT WASTEWATER TRMT PLT (CONTACT/OPERATOR)
, DETROIT WATER & SEWERAGE DEPAR (CONTACT/OWNER)
Alternative names: CITY OF DETROIT WASTE WATER SEWAGE TRMT, CITY OF DETROIT WATER AND SEWAGE, DETROIT WASTEWATER TRMT PLT, DETROIT WATER AND SEWERAGE DEPT, DETROIT WWTP
DETROIT COKE CORPORATION (7819 W JEFFERSON in DETROIT, MI)
(Integrated Compliance Information System) - ICIS-05-1991-0136, FORMAL ENFORCEMENT ACTION, ICIS-05-1989-0169, ICIS-05-1987-0491, ICIS-05-1986-0112, CRITERIA AND HAZARDOUS AIR POLLUTANT INVENTORY (Inventory of air pollution sources) AIR MAJOR ("Best Available" air pollution technologies tracking) Large Quantity Generators, more that 1000 kg of hazardous waste/month (Resource Conservation and Recovery Act (tracking hazardous waste)) TSD (Resource Conservation and Recovery Act (tracking hazardous waste)) - notification TRI REPORTER (Tracking of toxic chemicals releasing facilities) Business SIC classification: PRODUCTS OF PETROLEUM AND COAL; MINERALS AND EARTHS, GROUND OR OTHERWISE TREATED; STEEL WORKS, BLAST FURNACES (INCLUDING COKE OVENS), AND ROLLING MILLS; REFUSE SYSTEMS Business NAICS classification: SOLID WASTE LANDFILL. Organizations: HONEYWELL INTERNATIONAL INC. (CONTACT/OPERATOR)
Alternative names: MINERGY DETROIT LLC, MINERGY DETROIT, LLC
DETROIT EDISON, DELRAY POWER PLANT (6603 W. JEFFERSON in DETROIT, MI)
AIR MAJOR (AIRS/AFS) AIR PROGRAM (Clean Air Markets Division Business System) (Integrated Compliance Information System) - ICIS-05-1994-0016, FORMAL ENFORCEMENT ACTION, ICIS-05-1985-0464, CRITERIA AND HAZARDOUS AIR POLLUTANT INVENTORY (Inventory of air pollution sources) Conditionally Exempt Small Quantity Generators, less than 100 kg/month of hazardous waste (Resource Conservation and Recovery Act (tracking hazardous waste)) - notification Business SIC classification: ELECTRIC SERVICES; STEAM AND AIR-CONDITIONING SUPPLY; NONCLASSIFIABLE ESTABLISHMENTS Organizations: DETROIT EDISON COMPANY (CONTACT/OPERATOR)
Alternative names: DETROIT EDISON CO DELRAY PWR PLT
EDW C LEVY COMPANY PLANT 1 (8800 DIX AVE in DETROIT, MI)
AIR MINOR (AIRS/AFS) (Integrated Compliance Information System) - ICIS-05-2003-0012, FORMAL ENFORCEMENT ACTION COMPLIANCE ACTIVITY (Tracking inspections of insecticide, fungicide, and rodenticide, and toxic substances) CRITERIA AND HAZARDOUS AIR POLLUTANT INVENTORY (Inventory of air pollution sources) Conditionally Exempt Small Quantity Generators, less than 100 kg/month of hazardous waste (Resource Conservation and Recovery Act (tracking hazardous waste)) - notification Business SIC classification: MINERALS AND EARTHS, GROUND OR OTHERWISE TREATED Alternative names: EDWARD C LEVY CO, LEVY EDW C CO PLT 1
DETROIT PUBLIC SCHOOLS (6921 W FORT in DETROIT, MI)
(Geographic Names Information System) (National Center for Education Statistics) - STATE ID-03555 Conditionally Exempt Small Quantity Generators, less than 100 kg/month of hazardous waste (Resource Conservation and Recovery Act (tracking hazardous waste)) Organizations: DETROIT CITY SCHOOL DISTRICT (SCHOOL DISTRICT)
Alternative names: SOUTHWESTERN HIGH SCHOOL
EARHART MIDDLE SCHOOL (1000 SCOTTEN in DETROIT, MI)
(National Center for Education Statistics) - STATE ID-00082 Conditionally Exempt Small Quantity Generators, less than 100 kg/month of hazardous waste (Resource Conservation and Recovery Act (tracking hazardous waste)) Organizations: DETROIT PUBLIC SCHOOLS (CONTACT/OWNER)
, DETROIT CITY SCHOOL DISTRICT (SCHOOL DISTRICT)
BOSTWICK DRUMS (6771 BOSTWICK in DETROIT, MI)
SUPERFUND (Superfund database) (Integrated Compliance Information System) - ICIS-05-1998-0797, FORMAL ENFORCEMENT ACTION Business SIC classification: REFUSE SYSTEMS
CESAR CHAVEZ ACADEMY (8126 W. VERNOR HIGHWAY in DETROIT, MI)
(National Center for Education Statistics) - STATE ID-08347
BEARD ELEMENTARY SCHOOL (1551 BEARD in DETROIT, MI)
(National Center for Education Statistics) - STATE ID-00238 Organizations: DETROIT CITY SCHOOL DISTRICT (SCHOOL DISTRICT)
BEARD ELEMENTARY EARLY CHILDHOOD CENTER (840 WATERMAN in DETROIT, MI)
(National Center for Education Statistics) - STATE ID-08987 Organizations: DETROIT CITY SCHOOL DISTRICT (SCHOOL DISTRICT)
DETROIT COKE (PO BOX 09229 in DETROIT, MI)
(Integrated Compliance Information System) - ICIS-05-1998-0072, FORMAL ENFORCEMENT ACTION Business SIC classification: STEEL WORKS, BLAST FURNACES (INCLUDING COKE OVENS), AND ROLLING MILLS
CHEMSERVE CORP (9505 COPLAND in DETROIT, MI)
ENFORCEMENT/COMPLIANCE ACTIVITY (Integrated Compliance Information System) COMPLIANCE ACTIVITY (Tracking inspections of insecticide, fungicide, and rodenticide, and toxic substances) Alternative names: CHEM SERV CORP
ARVIN MERITOR OE LLC (6401 W FORT ST in DETROIT, MI)
Conditionally Exempt Small Quantity Generators, less than 100 kg/month of hazardous waste (Resource Conservation and Recovery Act (tracking hazardous waste)) TSD (Resource Conservation and Recovery Act (tracking hazardous waste)) Organizations: GMC FISHER BODY FORT STREET (CONTACT/OPERATOR)
, ATLANTIC FINANCIAL GRP LTD (CONTACT/OWNER)
, SL EQUITIES INC (STUART LICHTER PRES) (CONTACT/OWNER)
Alternative names: SL WAREHOUSING DETROIT LTD
Housing units lacking complete plumbing facilities: 6.5% Housing units lacking complete kitchen facilities: 9.2%
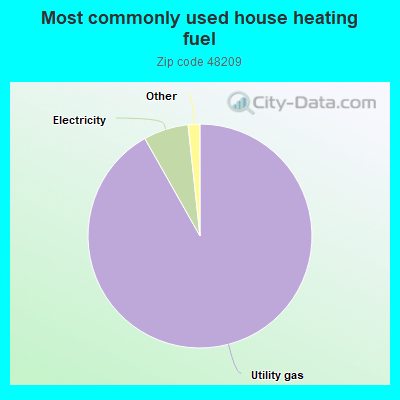
91.9%Utility gas
6.5%Electricity
0.8%Bottled, tank, or LP gas
0.5%Wood
Population in 1990: 38,839. Population change in the 1990s: +56 (+0.1%).
Place of birth for U.S.-born residents:
This state: 15,088
Northeast: 287
Midwest: 515
South: 1,523
West: 997
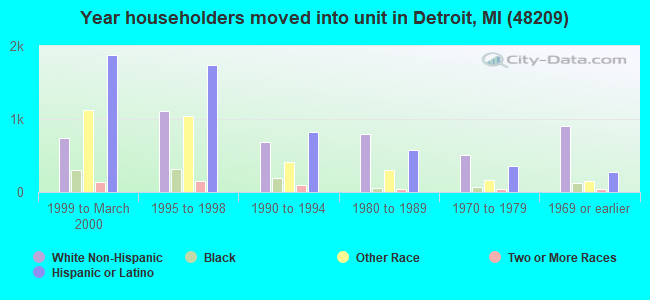
57% of the 48209 zip code residents lived in the same house 5 years ago. Out of people who lived in different houses, 74% lived in this county. Out of people who lived in different counties, 50% lived in Michigan.
95% of the 48209 zip code residents lived in the same house 1 year ago. Out of people who lived in different houses, 57% moved from this county. Out of people who lived in different houses, 27% moved from different county within same state. Out of people who lived in different houses, 15% moved from different state. Out of people who lived in different houses, 4% moved from abroad.
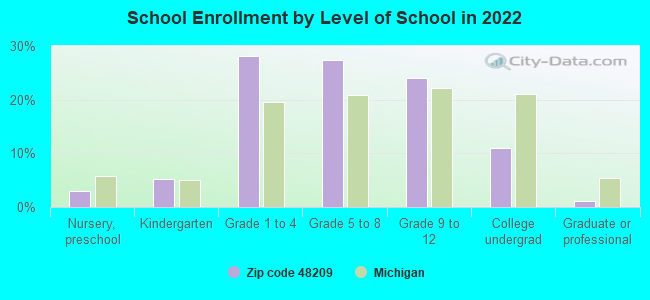
Private vs. public school enrollment:
Students in private schools in grades 1 to 8 (elementary and middle school): 303
Here:
7.0%
Michigan:
12.4%
Students in private schools in grades 9 to 12 (high school): 348
Here:
18.3%
Michigan:
9.8%
Students in private undergraduate colleges: 94
Here:
10.9%
Michigan:
14.9%
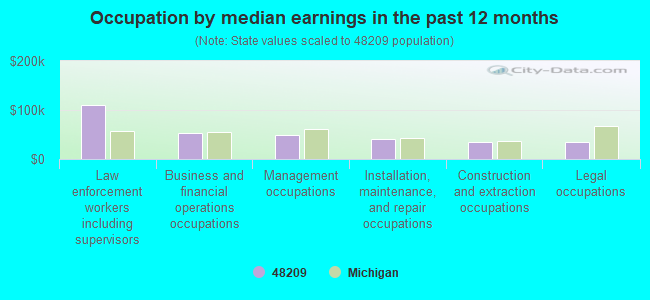
Occupation by median earnings in the past 12 months ($)
110,186Law enforcement workers including supervisors
52,272Business and financial operations occupations
48,700Management occupations
39,806Installation, maintenance, and repair occupations
34,580Construction and extraction occupations
34,248Legal occupations
Companies with federal contracts located in this zip code:
WOLVERINE TURF DEVELOPMENT, IN (8046 W VERNOR in DETROIT, MI; small business) : $443,510 in 6 contractsin 2004
Contracts for Maintenance, Repair or Alteration of Real Property -- Miscellaneous Buildings, Construction of Structures and Facilities -- Family Housing Facilities, Maintenance, Repair or Alteration of Real Property -- Tank Automotive Facilities by Army Signed by year:2000: $0; 2001: $0; 2002: $0; 2003: $0; 2004: $443,510; 2005: $0; 2006: $0.
Biggest contracts:
$150,000 with Army for Maintenance, Repair or Alteration of Real Property -- Miscellaneous Buildings. Signed on 2004-09-24. Completion date: 2005-01-31.
$97,160, same as above.Signed on 2004-09-24. Completion date: 2005-04-01.
$82,000, same as above.Signed on 2004-09-24. Completion date: 2005-01-28.
$61,500 with Army for Construction of Structures and Facilities -- Family Housing Facilities. Signed on 2004-09-24. Completion date: 2005-01-28.
IDEAL SHIELD LLC (2525 CLARK ST in DETROIT, MI; small business) : $78,563 in 7 contractsfrom 2002 to 2006
Contracts for Structural Shapes, Hardware, Commercial, Machining Centers and Way-Type Machines by Bureau of Land Management, Army Signed by year:2000: $0; 2001: $0; 2002: $6,192; 2003: $26,495; 2004: $35,615; 2005: $0; 2006: $10,261.
Biggest contracts:
$34,826 with Bureau of Land Management for Structural Shapes. Signed on 2004-03-02. Completion date: 2004-05-01.
$14,464 with Army for Hardware, Commercial. Taking place in OK. Signed on 2003-09-16. Completion date: 2003-10-30.
$10,261 with Army for Machining Centers and Way-Type Machines. Signed on 2006-02-08. Completion date: 2006-03-30.
$6,192 with Army for Hardware, Commercial. Signed on 2002-09-25. Completion date: 2002-10-24.
LOCKEMAN''S HARDWARE & BOATS I (7630 W JEFFERSON AVE in DETROIT, MI; small business)
$3,842 with U.S. Army Corps of Engineers - civil program financing only for Installation of Equipment -- Engines, Turbines, and Components. Signed on 2003-01-16. Completion date: 2002-12-23.
Top industries in this zip code by the number of employees in 2005:
Administrative and Support and Waste Management and Remediation Services: Temporary Help Services (250-499 employees: 1 establishment, 50-99 employees: 1 establishment)
Wholesale Trade: Fresh Fruit and Vegetable Merchant Wholesalers (50-99: 1, 20-49: 4, 10-19: 4, 5-9: 5, 1-4: 1)
2002 - 2018 National Fire Incident Reporting System (NFIRS) incidents
Based on the data from the years 2002 - 2018 the average number of fire incidents per year is 322. The highest number of fires - 597 took place in 2010, and the least - 0 in 2007. The data has a growing trend.
When looking into fire subcategories, the most incidents belonged to: Structure Fires (50.0%), and Outside Fires (25.2%).
Fire incident types reported to NFIRS in Zip Code 48209
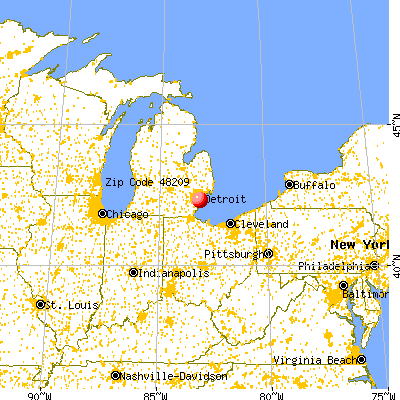


 Nearest zip codes: 48210, 48218, 48216, 48217, 48208, 48233.


 Based on the data from the years 2002 - 2018 the average number of fire incidents per year is 322. The highest number of fires - 597 took place in 2010, and the least - 0 in 2007. The data has a growing trend.
 When looking into fire subcategories, the most incidents belonged to: Structure Fires (50.0%), and Outside Fires (25.2%).