Estimated zip code population in 2022: 26,484 Zip code population in 2010: 31,017 Zip code population in 2000: 39,671
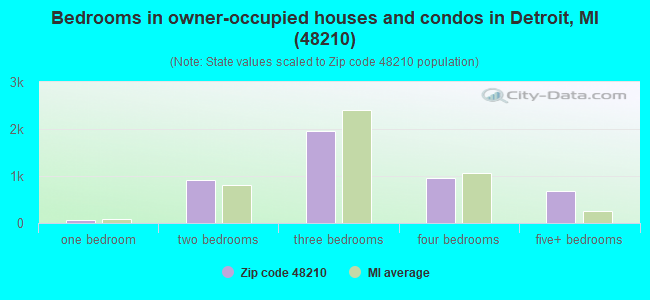
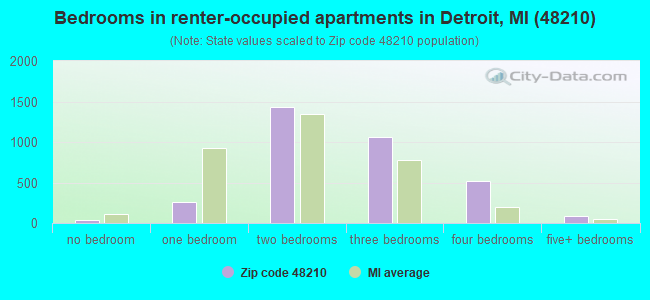
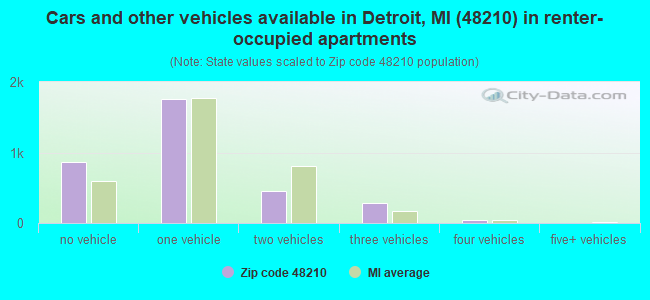
Houses and condos: 10,568 Renter-occupied apartments: 3,405
% of renters here:
43%
State:
27%
March 2022 cost of living index in zip code 48210: 93.5 (less than average, U.S. average is 100)
Land area: 5.0 sq. mi. Water area: 0.0 sq. mi.
Population density: 5,253 people per square mile
(average).
OSM Map
General Map
Google Map
MSN Map
OSM Map
General Map
Google Map
MSN Map
OSM Map
General Map
Google Map
MSN Map
OSM Map
General Map
Google Map
MSN Map
Please wait while loading the map...
Real estate property taxes paid for housing units in 2022:
This zip code:
2.0% ($1,208)
Michigan:
1.2% ($2,746)
Median real estate property taxes paid for housing units with mortgages in 2022: $1,294 (2.1%) Median real estate property taxes paid for housing units with no mortgage in 2022: $1,182 (2.0%)
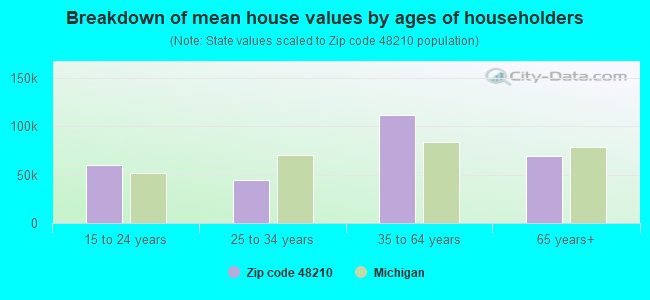
Estimated median house/condo value in 2022: $60,368
48210:
$60,368
Michigan:
$224,400
According to our research of Michigan and other state lists, there were 78 registered sex offenders living in 48210 zip code as of April 23, 2024. The ratio of all residents to sex offenders in zip code 48210 is 402 to 1. The ratio of registered sex offenders to all residents in this zip code is lower than the state average.
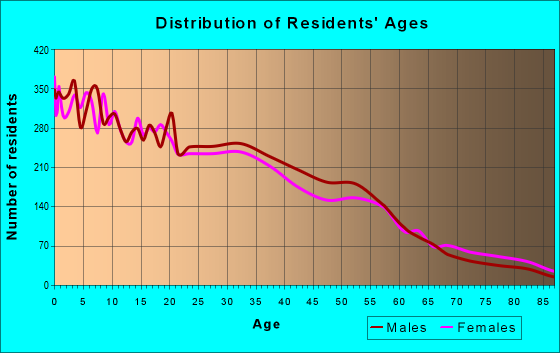
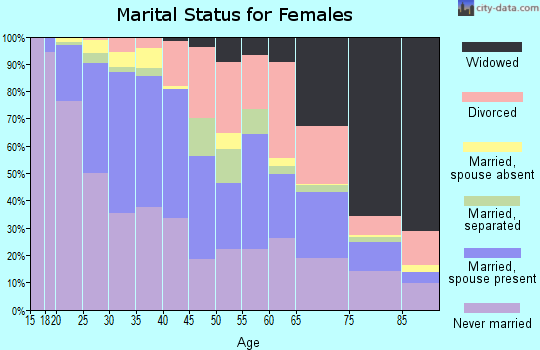
Median resident age:
This zip code:
29.4 years
Michigan median age:
40.3 years
Average household size:
This zip code:
3.3 people
Michigan:
2.4 people
Averages for the 2020 tax year for zip code 48210, filed in 2021:
Average Adjusted Gross Income (AGI) in 2020: $27,479 (Individual Income Tax Returns)
Here:
$27,479
State:
$68,945
Salary/wage: $26,203 (reported on 77.2% of returns)
Here:
$26,203
State:
$57,142
(% of AGI for various income ranges: 987.8% for AGIs below $25k, 3325.6% for AGIs $25k-50k, 6545.9% for AGIs $50k-75k, 9929.4% for AGIs $75k-100k, 15918.3% for AGIs $100k-200k)
Taxable interest for individuals: $276 (reported on 7.1% of returns)
This zip code:
$276
Michigan:
$1,630
(% of AGI for various income ranges: 1.2% for AGIs below $25k, 3.4% for AGIs $25k-50k, 3.7% for AGIs $50k-75k, 11.8% for AGIs $75k-100k, 10.0% for AGIs $100k-200k)
Ordinary dividends: $873 (reported on 1.7% of returns)
Here:
$873
State:
$6,972
(% of AGI for various income ranges: 1.4% for AGIs below $25k, 1.6% for AGIs $25k-50k, 4.4% for AGIs $50k-75k, 10.0% for AGIs $75k-100k)
Net capital gain/loss in AGI: +$2,317 (reported on 2.0% of returns)
Here:
+$2,317
State:
+$20,064
(% of AGI for various income ranges: 2.9% for AGIs below $25k, 2.6% for AGIs $25k-50k, 8.3% for AGIs $50k-75k, 119.4% for AGIs $75k-100k)
Profit/loss from business: +$5,762 (reported on 22.4% of returns)
Here:
+$5,762
State:
+$11,172
(% of AGI for various income ranges: 220.1% for AGIs below $25k, 103.3% for AGIs $25k-50k, 143.4% for AGIs $50k-75k, 260.0% for AGIs $75k-100k)
Taxable individual retirement arrangement distribution: $9,090 (reported on 1.1% of returns)
48210:
$9,090
Michigan:
$19,803
(% of AGI for various income ranges: 5.8% for AGIs below $25k, 8.7% for AGIs $25k-50k, 83.4% for AGIs $50k-75k)
Total itemized deductions: $21,012 (reported on 0.9% of returns)
Here:
$21,012
State:
$34,117
(% of AGI for various income ranges: 48.9% for AGIs $25k-50k, 289.4% for AGIs $75k-100k)
Charity contributions: $7,267 (reported on 0.7% of returns)
Here:
$7,267
State:
$13,548
(% of AGI for various income ranges: 10.4% for AGIs $25k-50k, 107.6% for AGIs $75k-100k)
Taxes paid: $4,650 (reported on 0.9% of returns)
48210:
$4,650
State:
$7,972
(% of AGI for various income ranges: 9.5% for AGIs $25k-50k, 83.5% for AGIs $75k-100k)
Earned income credit: $3,054 (reported on 37.5% of returns)
Here:
$3,054
State:
$2,251
(% of AGI for various income ranges: 189.5% for AGIs below $25k, 146.3% for AGIs $25k-50k, 4.1% for AGIs $50k-75k)
Percentage of individuals using paid preparers for their 2020 taxes: 83.7%
Here:
84%
State:
93%
(% for various income ranges: 83.9% for AGIs below $25k, 83.2% for AGIs $25k-50k, 82.1% for AGIs $50k-75k, 82.6% for AGIs $75k-100k, 100.0% for AGIs $100k-200k)
Averages for the 2012 tax year for zip code 48210, filed in 2013:
Average Adjusted Gross Income (AGI) in 2012: $21,744 (Individual Income Tax Returns)
Here:
$21,744
State:
$55,609
Salary/wage: $21,136 (reported on 82.1% of returns)
Here:
$21,136
State:
$46,782
(% of AGI for various income ranges: 72.3% for AGIs below $25k, 87.9% for AGIs $25k-50k, 84.6% for AGIs $50k-75k, 82.1% for AGIs $75k-100k, 56.3% for AGIs $100k-200k)
Taxable interest for individuals: $508 (reported on 7.9% of returns)
This zip code:
$508
Michigan:
$1,491
(% of AGI for various income ranges: 0.2% for AGIs below $25k, 0.2% for AGIs $25k-50k, 0.1% for AGIs $75k-100k)
Ordinary dividends: $1,588 (reported on 2.0% of returns)
Here:
$1,588
State:
$6,225
(% of AGI for various income ranges: 0.1% for AGIs below $25k, 0.2% for AGIs $25k-50k, 0.1% for AGIs $50k-75k)
Profit/loss from business: +$9,188 (reported on 19.6% of returns)
Here:
+$9,188
State:
+$11,523
(% of AGI for various income ranges: 18.2% for AGIs below $25k, 1.5% for AGIs $25k-50k, 2.0% for AGIs $50k-75k)
Taxable individual retirement arrangement distribution: $8,747 (reported on 1.8% of returns)
48210:
$8,747
Michigan:
$15,298
(% of AGI for various income ranges: 0.4% for AGIs below $25k, 0.7% for AGIs $25k-50k, 2.1% for AGIs $50k-75k)
Total itemized deductions: $14,057 (27% of AGI, reported on 4.4% of returns)
Here:
$14,057
State:
$21,628
Here:
26.8% of AGI
State:
18.4% of AGI
(% of AGI for various income ranges: 0.9% for AGIs below $25k, 3.0% for AGIs $25k-50k, 4.9% for AGIs $50k-75k, 8.4% for AGIs $75k-100k, 9.7% for AGIs $100k-200k)
Charity contributions: $3,535 (reported on 3.1% of returns)
Here:
$3,535
State:
$4,225
(% of AGI for various income ranges: 0.1% for AGIs below $25k, 0.6% for AGIs $25k-50k, 0.8% for AGIs $50k-75k, 1.0% for AGIs $75k-100k, 2.8% for AGIs $100k-200k)
Taxes paid: $4,622 (reported on 4.3% of returns)
48210:
$4,622
State:
$8,327
(% of AGI for various income ranges: 0.2% for AGIs below $25k, 0.8% for AGIs $25k-50k, 1.6% for AGIs $50k-75k, 3.6% for AGIs $75k-100k, 4.5% for AGIs $100k-200k)
Earned income credit: $3,130 (reported on 43.7% of returns)
Here:
$3,130
State:
$2,306
(% of AGI for various income ranges: 13.4% for AGIs below $25k, 2.0% for AGIs $25k-50k)
Percentage of individuals using paid preparers for their 2012 taxes: 62.6%
Here:
63%
State:
57%
(% for various income ranges: 61.4% for AGIs below $25k, 64.4% for AGIs $25k-50k, 68.3% for AGIs $50k-75k, 70.0% for AGIs $75k-100k, 75.0% for AGIs $100k-200k)
Averages for the 2004 tax year for zip code 48210, filed in 2005:
Average Adjusted Gross Income (AGI) in 2004: $22,549 (Individual Income Tax Returns)
Here:
$22,549
State:
$48,204
Salary/wage: $21,637 (reported on 87.7% of returns)
Here:
$21,637
State:
$42,791
(% of AGI for various income ranges: 75.7% for AGIs below $10k, 81.8% for AGIs $10k-25k, 88.0% for AGIs $25k-50k, 87.4% for AGIs $50k-75k, 84.2% for AGIs $75k-100k, 56.7% for AGIs over 100k)
Taxable interest for individuals: $1,023 (reported on 16.5% of returns)
This zip code:
$1,023
Michigan:
$1,725
(% of AGI for various income ranges: 1.2% for AGIs below $10k, 0.7% for AGIs $10k-25k, 0.4% for AGIs $25k-50k, 1.5% for AGIs $50k-75k, 1.1% for AGIs $75k-100k, 0.2% for AGIs over 100k)
Taxable dividends: $972 (reported on 4.7% of returns)
Here:
$972
State:
$3,420
(% of AGI for various income ranges: 0.3% for AGIs below $10k, 0.1% for AGIs $10k-25k, 0.2% for AGIs $25k-50k, 0.1% for AGIs $50k-75k, 0.3% for AGIs $75k-100k, 1.0% for AGIs over 100k)
Net capital gain/loss: +$2,330 (reported on 2.3% of returns)
Here:
+$2,330
State:
+$8,532
(% of AGI for various income ranges: -0.1% for AGIs below $10k, 0.0% for AGIs $10k-25k, 0.2% for AGIs $25k-50k, 0.1% for AGIs $50k-75k, 1.8% for AGIs $75k-100k, 1.7% for AGIs over 100k)
Profit/loss from business: +$6,880 (reported on 10.8% of returns)
Here:
+$6,880
State:
+$9,547
(% of AGI for various income ranges: 17.3% for AGIs below $10k, 6.0% for AGIs $10k-25k, 1.2% for AGIs $25k-50k, 0.1% for AGIs $50k-75k, 0.4% for AGIs $75k-100k)
IRA payment deduction: $1,538 (reported on 0.5% of returns)
48210:
$1,538
Michigan:
$2,875
Total itemized deductions: $13,189 (29% of AGI, reported on 10.3% of returns)
Here:
$13,189
State:
$18,509
Here:
28.8% of AGI
State:
20.7% of AGI
(% of AGI for various income ranges: 2.5% for AGIs below $10k, 2.2% for AGIs $10k-25k, 6.6% for AGIs $25k-50k, 8.4% for AGIs $50k-75k, 10.3% for AGIs $75k-100k, 21.6% for AGIs over 100k)
Charity contributions deductions: $3,015 (6% of AGI, reported on 8.5% of returns)
Here:
$3,015
State:
$3,365
Here:
6.4% of AGI
State:
3.6% of AGI
(% of AGI for various income ranges: 0.2% for AGIs below $10k, 0.3% for AGIs $10k-25k, 1.2% for AGIs $25k-50k, 1.8% for AGIs $50k-75k, 2.2% for AGIs $75k-100k, 3.7% for AGIs over 100k)
Total tax: $2,361 (reported on 49.2% of returns)
48210:
$2,361
State:
$7,691
(% of AGI for various income ranges: 3.0% for AGIs below $10k, 2.6% for AGIs $10k-25k, 4.4% for AGIs $25k-50k, 8.9% for AGIs $50k-75k, 11.6% for AGIs $75k-100k, 14.2% for AGIs over 100k)
Earned income credit: $2,137 (reported on 40.6% of returns)
Here:
$2,137
State:
$1,737
Percentage of individuals using paid preparers for their 2004 taxes: 73.4%
Here:
73%
State:
60%
(% for various income ranges: 72.7% for AGIs below $10k, 75.3% for AGIs $10k-25k, 72.2% for AGIs $25k-50k, 70.8% for AGIs $50k-75k, 68.2% for AGIs $75k-100k, 66.7% for AGIs over 100k)
Likely homosexual households (counted as self-reported same-sex unmarried-partner households)
Lesbian couples: 0.3% of all households
Gay men: 0.0% of all households
Household received Food Stamps/SNAP in the past 12 months: 3,127 Household did not receive Food Stamps/SNAP in the past 12 months: 5,058
Women who had a birth in the past 12 months: 397 (143 now married, 245 unmarried) Women who did not have a birth in the past 12 months: 6,686 (2,391 now married, 4,300 unmarried)
Housing units in zip code 48210 with a mortgage: 678 (59 second mortgage, 58 both second mortgage and home equity loan) Houses without a mortgage: 21
Median monthly owner costs for units with a mortgage: $950 Median monthly owner costs for units without a mortgage: $488
Residents with income below the poverty level in 2022:
This zip code:
40.0%
Whole state:
13.4%
Residents with income below 50% of the poverty level in 2022:
This zip code:
19.7%
Whole state:
6.9%
Median number of rooms in houses and condos:
Here:
6.4
State:
6.5
Median number of rooms in apartments:
Here:
5.2
State:
4.3
Notable locations in this zip code not listed on our city pages
Notable locations in zip code 48210: Edwin F Conely Library (A), City of Detroit Fire Department Engine 34 (B), City of Detroit Fire Department Engine 66 Ladder 22 (C). Display/hide their locations on the map
Churches in zip code 48210 include: Christ Cathedral Baptist Church (A), Church of God of Anderson Indiana (B), New Memories Baptist Church (C), Reformation Church of God (D), Saint Francis D'Assisi Hall (E), Saint Johns Ukrainian Catholic Church (F), Saint Phillips Missionary Baptist Church (G), Saint Stephen's Mary Mother of the Church (H), Second True Vine Church (I). Display/hide their locations on the map
Parks in zip code 48210 include: Watson Playground (1), Wilson Playground (2), Atkinson Park (3), Dover Park (4), Zion Lutheran Church Historical Marker (5), Malish Playground (6). Display/hide their locations on the map
5,004 married couples with children.
2,575 single-parent households (640 men, 1,935 women).
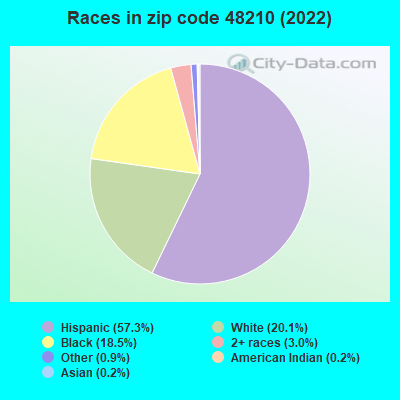
37.1% of residents of 48210 zip code speak English at home.
53.3% of residents speak Spanish at home (49% very well, 22% well, 18% not well, 10% not at all).
0.5% of residents speak other Indo-European language at home (87% very well, 13% well).
0.2% of residents speak Asian or Pacific Island language at home (6% very well, 94% well).
11.6% of residents speak other language at home (51% very well, 22% well, 17% not well, 10% not at all).
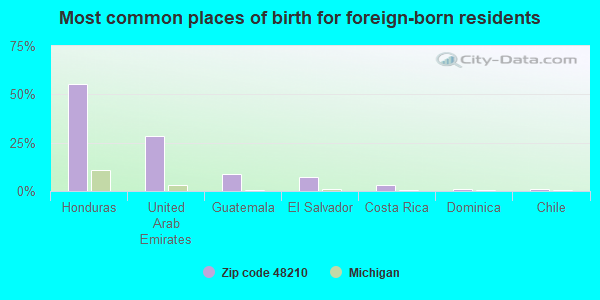
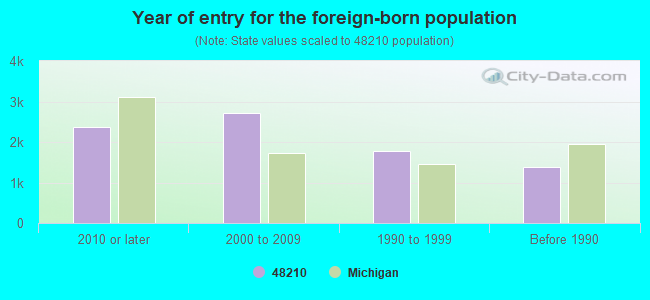
Foreign born population: 7,222 (27.3%) (31.9% of them are naturalized citizens)
Major facilities with environmental interests located in this zip code:
CHADSEY HIGH SCHOOL (5335 MARTIN in DETROIT, MI)
(Geographic Names Information System) (National Center for Education Statistics) - STATE ID-00631 Conditionally Exempt Small Quantity Generators, less than 100 kg/month of hazardous waste (Resource Conservation and Recovery Act (tracking hazardous waste)) HAZARDOUS WASTE BIENNIAL REPORTER (Resource Conservation and Recovery Act (tracking hazardous waste)) Organizations: DETROIT PUBLIC SCHOOLS (CONTACT/OPERATOR)
, DETROIT CITY SCHOOL DISTRICT (SCHOOL DISTRICT)
BASF CORP (5935 MILFORD AVE in DETROIT, MI)
AIR MINOR (AIRS/AFS) COMPLIANCE ACTIVITY (Tracking inspections of insecticide, fungicide, and rodenticide, and toxic substances) HAZARDOUS WASTE BIENNIAL REPORTER (Resource Conservation and Recovery Act (tracking hazardous waste)) Large Quantity Generators, more that 1000 kg of hazardous waste/month (Resource Conservation and Recovery Act (tracking hazardous waste)) - notification TSD (Resource Conservation and Recovery Act (tracking hazardous waste)) - notification TRI REPORTER (Tracking of toxic chemicals releasing facilities) Business SIC classification: PLASTICS MATERIALS, SYNTHETIC RESINS, AND NONVULCANIZABLE ELASTOMERS; PAINTS, VARNISHES, LACQUERS, ENAMELS, AND ALLIED PRODUCTS Business NAICS classification: PLASTICS MATERIAL AND RESIN MANUFACTURING. Organizations: BASF CORPORATION (CONTACT/OPERATOR)
Alternative names: BASF CORP-INMONT DIVISION, BASF CORP MILFORD AVE PLT
DETROIT EDISON COMPANY WARREN SERVICE CTR (7940 LIVERNOIS AVE in DETROIT, MI)
COMPLIANCE ACTIVITY (Tracking inspections of insecticide, fungicide, and rodenticide, and toxic substances) HAZARDOUS WASTE BIENNIAL REPORTER (Resource Conservation and Recovery Act (tracking hazardous waste)) Small Quantity Generators, between 100 kg and 1000 kg of hazardous waste/month (Resource Conservation and Recovery Act (tracking hazardous waste)) TSD (Resource Conservation and Recovery Act (tracking hazardous waste)) USED OIL PROGRAM (Resource Conservation and Recovery Act (tracking hazardous waste)) Business NAICS classification: ELECTRIC POWER DISTRIBUTION. Alternative names: DETROIT EDISON WARREN SERVICE CONTRACT, DETROIT EDISON / WARREN SERVICE CTR
ACADEMY OF THE AMERICAS (5680 KONKEL STREET in DETROIT, MI)
(National Center for Education Statistics) - STATE ID-07793 Organizations: DETROIT CITY SCHOOL DISTRICT (SCHOOL DISTRICT)
CHARLOTTE FORTEN ACADEMY (5690 CECIL STREET in DETROIT, MI)
(National Center for Education Statistics) - STATE ID-08605
FERROUS PROCESSING & TRADING (9100 JOHN KRONK STREET in DETROIT, MI)
AIR MINOR (AIRS/AFS) COMPLIANCE ACTIVITY (Tracking inspections of insecticide, fungicide, and rodenticide, and toxic substances) Business SIC classification: NONCLASSIFIABLE ESTABLISHMENTS
E DONALD RICHARDS (7151 EDWARD in DETROIT, MI)
(Resource Conservation and Recovery Act (tracking hazardous waste))
ANR FREIGHT SYSTEM INC (3685 CENTRAL AVE in DETROIT, MI)
(Resource Conservation and Recovery Act (tracking hazardous waste))
AVES LAUNDROMAT AND DRY CLEANERS (6563 W WARREN in DETROIT, MI)
(Resource Conservation and Recovery Act (tracking hazardous waste)) Organizations: DELAFUENTE MARIA (CONTACT/OWNER)
ENVIRONMENTAL TECHNOLOGIES LLC (4815 CABOT in DETROIT, MI)
(Resource Conservation and Recovery Act (tracking hazardous waste)) Organizations: CHARLES D LONG (CONTACT/OPERATOR)
MI DEPT/TRANSPORTATION BRIDGE (M-10 UNDER WARREN AVE in DETROIT, MI)
(Resource Conservation and Recovery Act (tracking hazardous waste)) Organizations: MICH DEPT OF TRANSPORTATION (CONTACT/OPERATOR)
Alternative names: MIDOT BRIDGE M-10 UNDER WARREN
METROPOLITAN COMMUNITY HOUSING DEV ORG (6349 30TH in DETROIT, MI)
(Resource Conservation and Recovery Act (tracking hazardous waste))
MI DEPT/TRANSPORTATION (I96 FROM WARREN AVE TO ROOSEVE in DETROIT, MI)
(Resource Conservation and Recovery Act (tracking hazardous waste)) Organizations: MICH DEPT OF TRANSPORTATION (CONTACT/OPERATOR)
Housing units lacking complete plumbing facilities: 17.1% Housing units lacking complete kitchen facilities: 18.8%
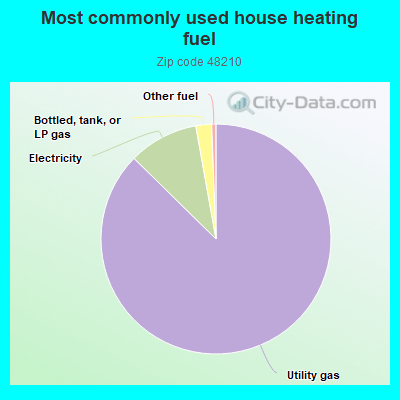
87.2%Utility gas
9.8%Electricity
2.2%Bottled, tank, or LP gas
0.6%Other fuel
Population in 1990: 39,833.
Place of birth for U.S.-born residents:
This state: 15,531
Northeast: 337
Midwest: 243
South: 1,154
West: 812
62% of the 48210 zip code residents lived in the same house 5 years ago. Out of people who lived in different houses, 80% lived in this county. Out of people who lived in different counties, 50% lived in Michigan.
92% of the 48210 zip code residents lived in the same house 1 year ago. Out of people who lived in different houses, 69% moved from this county. Out of people who lived in different houses, 2% moved from different county within same state. Out of people who lived in different houses, 11% moved from different state. Out of people who lived in different houses, 21% moved from abroad.
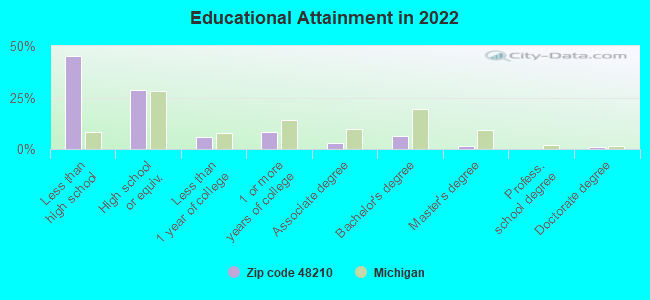
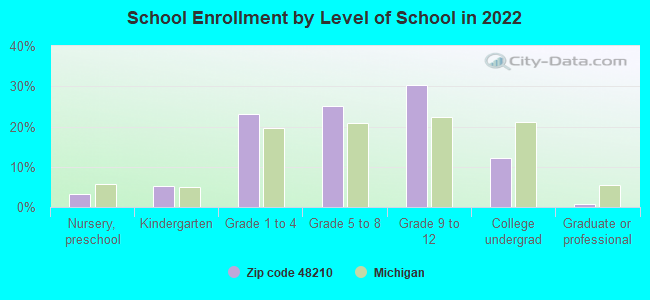
Private vs. public school enrollment:
Students in private schools in grades 1 to 8 (elementary and middle school): 324
Here:
8.1%
Michigan:
12.4%
Students in private schools in grades 9 to 12 (high school): 266
Here:
10.5%
Michigan:
9.8%
Students in private undergraduate colleges: 143
Here:
14.0%
Michigan:
14.9%
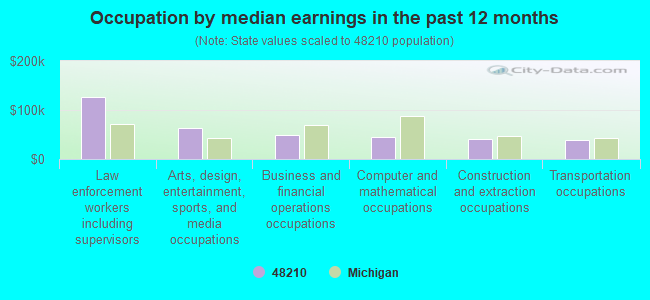
Occupation by median earnings in the past 12 months ($)
125,733Law enforcement workers including supervisors
62,311Arts, design, entertainment, sports, and media occupations
49,402Business and financial operations occupations
44,354Computer and mathematical occupations
40,491Construction and extraction occupations
38,348Transportation occupations
Companies with federal contracts located in this zip code:
SUPERIOR DIESEL AND EQUIPMENT (3735 CENTRAL ST in DETROIT, MI; small business) : $25,124 in 3 contractsfrom 2002 to 2004
$12,724 with Army for Maintenance, Repair and Rebuilding of Equipment -- Engines, Turbines, and Components. Signed on 2002-04-18. Completion date: 2002-04-22.
$11,100 with Army for Maintenance, Repair and Rebuilding of Equipment -- Fire Control Equipment. Signed on 2004-03-09. Completion date: 2004-03-23.
$1,300, same as above.Signed on 2004-04-08. Completion date: 2004-03-23.
SUPERIOR DIESEL REPAIR CO (3735 CENTRAL ST in DETROIT, MI; small business) : $6,873 in 5 contractsfrom 2005 to 2006
Contracts for Engine Cooling System Components, Nonaircraft by Army Signed by year:2000: $0; 2001: $0; 2002: $0; 2003: $0; 2004: $0; 2005: $5,759; 2006: $1,114.
Biggest contracts:
$1,618 with Army for Engine Cooling System Components, Nonaircraft. Signed on 2005-07-27. Completion date: 2005-09-29.
$1,618, same as above.Signed on 2005-07-27. Completion date: 2005-08-21.
$1,409, same as above.Signed on 2005-07-28. Completion date: 2005-08-21.
$1,114, same as above.Signed on 2006-01-12. Completion date: 2005-08-21.
Top industries in this zip code by the number of employees in 2005:
Health Care and Social Assistance: Vocational Rehabilitation Services (250-499 employees: 2 establishments, 50-99 employees: 1 establishment, 5-9 employees: 1 establishment)
Other Services (except Public Administration): General Automotive Repair (250-499: 1, 20-49: 1, 10-19: 1, 5-9: 4, 1-4: 7)
Utilities: Electric Power Distribution (250-499: 1)
Wholesale Trade: Metal Service Centers and Other Metal Merchant Wholesalers (100-249: 1, 50-99: 2, 10-19: 1)
2002 - 2018 National Fire Incident Reporting System (NFIRS) incidents
According to the data from the years 2002 - 2018 the average number of fires per year is 306. The highest number of fires - 592 took place in 2012, and the least - 0 in 2006. The data has an increasing trend.
When looking into fire subcategories, the most incidents belonged to: Structure Fires (55.2%), and Outside Fires (24.2%).
Fire incident types reported to NFIRS in Zip Code 48210
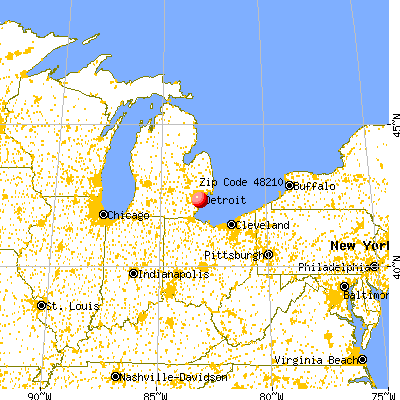


 Nearest zip codes: 48209, 48204, 48208, 48206, 48216, 48126.


 According to the data from the years 2002 - 2018 the average number of fires per year is 306. The highest number of fires - 592 took place in 2012, and the least - 0 in 2006. The data has an increasing trend.
 When looking into fire subcategories, the most incidents belonged to: Structure Fires (55.2%), and Outside Fires (24.2%).