Estimated zip code population in 2022: 6,909 Zip code population in 2010: 5,302 Zip code population in 2000: 6,138
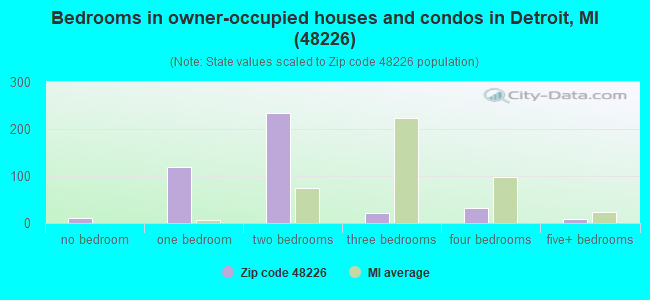
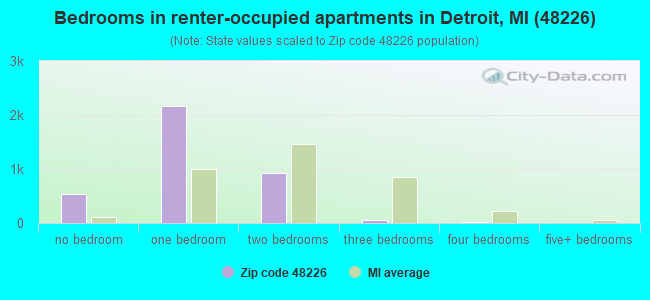
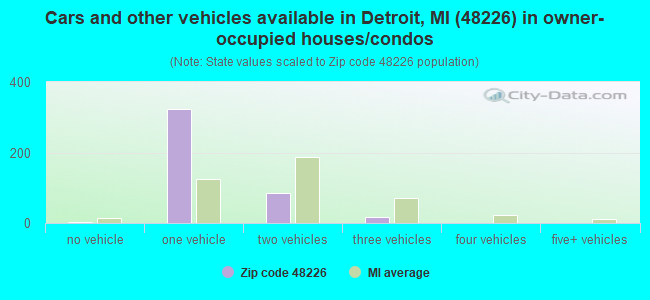
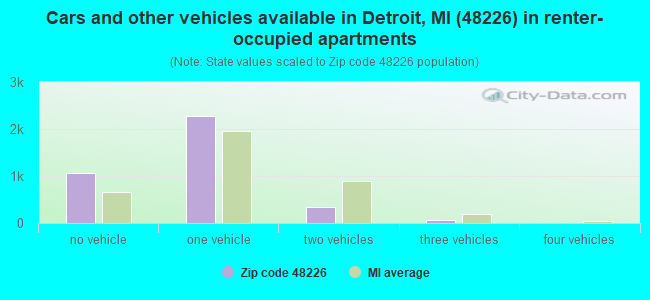
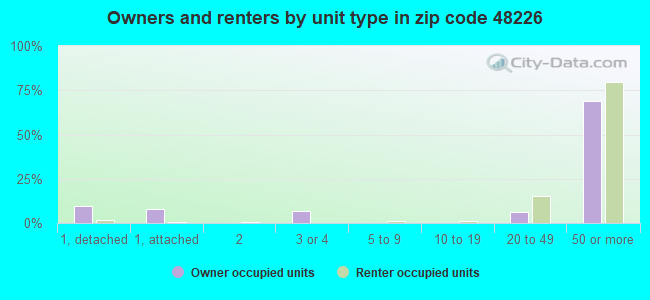
Houses and condos: 5,013 Renter-occupied apartments: 3,738
% of renters here:
90%
State:
27%
March 2022 cost of living index in zip code 48226: 100.0 (near average, U.S. average is 100)
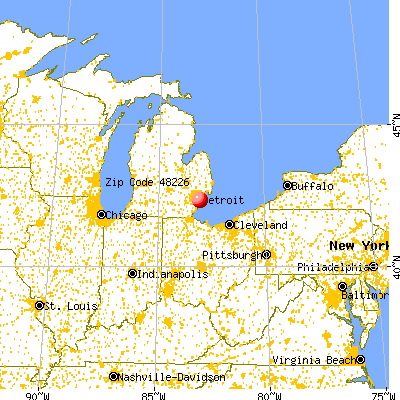
Land area: 1.2 sq. mi. Water area: 0.0 sq. mi.
Population density: 5,596 people per square mile
(average).
OSM Map
General Map
Google Map
MSN Map
OSM Map
General Map
Google Map
MSN Map
OSM Map
General Map
Google Map
MSN Map
OSM Map
General Map
Google Map
MSN Map
Please wait while loading the map...
Real estate property taxes paid for housing units in 2022:
This zip code:
0.7% ($2,445)
Michigan:
1.2% ($2,746)
Median real estate property taxes paid for housing units with mortgages in 2022: $2,629 (0.8%) Median real estate property taxes paid for housing units with no mortgage in 2022: $1,918 (0.6%)
Averages for the 2020 tax year for zip code 48226, filed in 2021:
Average Adjusted Gross Income (AGI) in 2020: $178,760 (Individual Income Tax Returns)
Here:
$178,760
State:
$68,945
Salary/wage: $88,829 (reported on 82.7% of returns)
Here:
$88,829
State:
$57,142
(% of AGI for various income ranges: 1181.1% for AGIs below $25k, 3919.2% for AGIs $25k-50k, 7837.1% for AGIs $50k-75k, 11868.1% for AGIs $75k-100k, 22377.6% for AGIs $100k-200k, 213643.3% for AGIs over 200k)
Taxable interest for individuals: $35,462 (reported on 27.2% of returns)
This zip code:
$35,462
Michigan:
$1,630
(% of AGI for various income ranges: 6.0% for AGIs below $25k, 5.6% for AGIs $25k-50k, 13.9% for AGIs $50k-75k, 27.1% for AGIs $75k-100k, 81.9% for AGIs $100k-200k, 76973.3% for AGIs over 200k)
Ordinary dividends: $97,223 (reported on 25.5% of returns)
Here:
$97,223
State:
$6,972
(% of AGI for various income ranges: 51.4% for AGIs below $25k, 53.3% for AGIs $25k-50k, 100.6% for AGIs $50k-75k, 79.5% for AGIs $75k-100k, 227.6% for AGIs $100k-200k, 196496.7% for AGIs over 200k)
Net capital gain/loss in AGI: +$151,307 (reported on 25.1% of returns)
Here:
+$151,307
State:
+$20,064
(% of AGI for various income ranges: 50.6% for AGIs below $25k, 49.2% for AGIs $25k-50k, 85.8% for AGIs $50k-75k, 206.2% for AGIs $75k-100k, 460.0% for AGIs $100k-200k, 300926.7% for AGIs over 200k)
Profit/loss from business: +$9,011 (reported on 15.2% of returns)
Here:
+$9,011
State:
+$11,172
(% of AGI for various income ranges: 49.7% for AGIs below $25k, 111.9% for AGIs $25k-50k, 96.1% for AGIs $50k-75k, 65.2% for AGIs $75k-100k, 486.2% for AGIs $100k-200k, 4336.7% for AGIs over 200k)
Taxable individual retirement arrangement distribution: $20,618 (reported on 4.5% of returns)
48226:
$20,618
Michigan:
$19,803
(% of AGI for various income ranges: 72.8% for AGIs $25k-50k, 211.6% for AGIs $50k-75k, 642.9% for AGIs $100k-200k)
Total itemized deductions: $88,317 (reported on 11.9% of returns)
Here:
$88,317
State:
$34,117
(% of AGI for various income ranges: 376.9% for AGIs $25k-50k, 441.9% for AGIs $75k-100k, 989.5% for AGIs $100k-200k, 70830.0% for AGIs over 200k)
Charity contributions: $62,404 (reported on 9.5% of returns)
Here:
$62,404
State:
$13,548
(% of AGI for various income ranges: 91.7% for AGIs $25k-50k, 103.8% for AGIs $75k-100k, 198.6% for AGIs $100k-200k, 44626.7% for AGIs over 200k)
Taxes paid: $8,041 (reported on 11.9% of returns)
48226:
$8,041
State:
$7,972
(% of AGI for various income ranges: 64.4% for AGIs $25k-50k, 106.2% for AGIs $75k-100k, 332.9% for AGIs $100k-200k, 3926.7% for AGIs over 200k)
Earned income credit: $1,400 (reported on 6.6% of returns)
Here:
$1,400
State:
$2,251
(% of AGI for various income ranges: 48.9% for AGIs below $25k, 14.7% for AGIs $25k-50k)
Percentage of individuals using paid preparers for their 2020 taxes: 91.4%
Here:
91%
State:
93%
(% for various income ranges: 89.3% for AGIs below $25k, 91.8% for AGIs $25k-50k, 93.3% for AGIs $50k-75k, 93.8% for AGIs $75k-100k, 87.8% for AGIs $100k-200k, 95.0% for AGIs over 200k)
Averages for the 2012 tax year for zip code 48226, filed in 2013:
Average Adjusted Gross Income (AGI) in 2012: $130,517 (Individual Income Tax Returns)
Here:
$130,517
State:
$55,609
Salary/wage: $57,758 (reported on 79.0% of returns)
Here:
$57,758
State:
$46,782
(% of AGI for various income ranges: 70.8% for AGIs below $25k, 80.6% for AGIs $25k-50k, 83.0% for AGIs $50k-75k, 80.6% for AGIs $75k-100k, 78.7% for AGIs $100k-200k, 15.3% for AGIs over 200k)
Taxable interest for individuals: $19,285 (reported on 25.2% of returns)
This zip code:
$19,285
Michigan:
$1,491
(% of AGI for various income ranges: 0.7% for AGIs below $25k, 0.5% for AGIs $25k-50k, 0.5% for AGIs $50k-75k, 0.4% for AGIs $75k-100k, 0.2% for AGIs $100k-200k, 5.2% for AGIs over 200k)
Ordinary dividends: $114,992 (reported on 16.8% of returns)
Here:
$114,992
State:
$6,225
(% of AGI for various income ranges: 2.2% for AGIs below $25k, 1.6% for AGIs $25k-50k, 0.9% for AGIs $50k-75k, 1.2% for AGIs $75k-100k, 4.0% for AGIs $100k-200k, 20.4% for AGIs over 200k)
Net capital gain/loss in AGI: +$258,172 (reported on 13.4% of returns)
Here:
+$258,172
State:
+$9,326
(% of AGI for various income ranges: 0.1% for AGIs below $25k, 1.7% for AGIs $100k-200k, 38.2% for AGIs over 200k)
Profit/loss from business: +$11,405 (reported on 15.5% of returns)
Here:
+$11,405
State:
+$11,523
(% of AGI for various income ranges: 6.2% for AGIs below $25k, 2.1% for AGIs $25k-50k, 1.7% for AGIs $50k-75k, 2.6% for AGIs $100k-200k, 0.9% for AGIs over 200k)
Taxable individual retirement arrangement distribution: $30,157 (reported on 5.9% of returns)
48226:
$30,157
Michigan:
$15,298
(% of AGI for various income ranges: 1.5% for AGIs below $25k, 1.3% for AGIs $25k-50k, 3.0% for AGIs $50k-75k, 11.7% for AGIs $100k-200k)
Total itemized deductions: $72,437 (19% of AGI, reported on 28.6% of returns)
Here:
$72,437
State:
$21,628
Here:
19.2% of AGI
State:
18.4% of AGI
(% of AGI for various income ranges: 9.7% for AGIs below $25k, 8.6% for AGIs $25k-50k, 8.9% for AGIs $50k-75k, 12.2% for AGIs $75k-100k, 13.2% for AGIs $100k-200k, 18.2% for AGIs over 200k)
Charity contributions: $32,524 (reported on 20.6% of returns)
Here:
$32,524
State:
$4,225
(% of AGI for various income ranges: 0.5% for AGIs below $25k, 1.2% for AGIs $25k-50k, 1.4% for AGIs $50k-75k, 2.2% for AGIs $75k-100k, 1.8% for AGIs $100k-200k, 6.7% for AGIs over 200k)
Taxes paid: $24,322 (reported on 27.3% of returns)
48226:
$24,322
State:
$8,327
(% of AGI for various income ranges: 1.1% for AGIs below $25k, 1.7% for AGIs $25k-50k, 2.3% for AGIs $50k-75k, 4.5% for AGIs $75k-100k, 5.6% for AGIs $100k-200k, 5.9% for AGIs over 200k)
Earned income credit: $1,617 (reported on 14.7% of returns)
Here:
$1,617
State:
$2,306
(% of AGI for various income ranges: 4.4% for AGIs below $25k, 0.2% for AGIs $25k-50k)
Percentage of individuals using paid preparers for their 2012 taxes: 50.8%
Here:
51%
State:
57%
(% for various income ranges: 49.0% for AGIs below $25k, 49.2% for AGIs $25k-50k, 41.2% for AGIs $50k-75k, 50.0% for AGIs $75k-100k, 60.0% for AGIs $100k-200k, 90.9% for AGIs over 200k)
Averages for the 2004 tax year for zip code 48226, filed in 2005:
Average Adjusted Gross Income (AGI) in 2004: $54,230 (Individual Income Tax Returns)
Here:
$54,230
State:
$48,204
Salary/wage: $47,170 (reported on 80.7% of returns)
Here:
$47,170
State:
$42,791
(% of AGI for various income ranges: 71.3% for AGIs below $10k, 77.9% for AGIs $10k-25k, 84.0% for AGIs $25k-50k, 83.0% for AGIs $50k-75k, 80.5% for AGIs $75k-100k, 59.4% for AGIs over 100k)
Taxable interest for individuals: $2,979 (reported on 33.4% of returns)
This zip code:
$2,979
Michigan:
$1,725
(% of AGI for various income ranges: 6.5% for AGIs below $10k, 1.9% for AGIs $10k-25k, 1.3% for AGIs $25k-50k, 1.6% for AGIs $50k-75k, 1.2% for AGIs $75k-100k, 2.1% for AGIs over 100k)
Taxable dividends: $8,281 (reported on 18.8% of returns)
Here:
$8,281
State:
$3,420
(% of AGI for various income ranges: 6.0% for AGIs below $10k, 2.2% for AGIs $10k-25k, 1.5% for AGIs $25k-50k, 1.8% for AGIs $50k-75k, 2.3% for AGIs $75k-100k, 3.7% for AGIs over 100k)
Net capital gain/loss: +$23,732 (reported on 13.6% of returns)
Here:
+$23,732
State:
+$8,532
(% of AGI for various income ranges: -3.0% for AGIs below $10k, -0.0% for AGIs $10k-25k, 1.1% for AGIs $25k-50k, 1.2% for AGIs $50k-75k, 1.1% for AGIs $75k-100k, 10.8% for AGIs over 100k)
Profit/loss from business: +$11,434 (reported on 9.3% of returns)
Here:
+$11,434
State:
+$9,547
(% of AGI for various income ranges: 6.8% for AGIs below $10k, 2.6% for AGIs $10k-25k, 0.9% for AGIs $25k-50k, 2.9% for AGIs $50k-75k, 2.1% for AGIs over 100k)
Self-employed pension: $32,545 (reported on 0.5% of returns)
Here:
$32,545
Michigan:
$13,826
Total itemized deductions: $22,082 (20% of AGI, reported on 29.6% of returns)
Here:
$22,082
State:
$18,509
Here:
19.9% of AGI
State:
20.7% of AGI
(% of AGI for various income ranges: 18.7% for AGIs below $10k, 13.3% for AGIs $10k-25k, 10.3% for AGIs $25k-50k, 12.2% for AGIs $50k-75k, 13.4% for AGIs $75k-100k, 11.9% for AGIs over 100k)
Charity contributions deductions: $7,220 (6% of AGI, reported on 20.0% of returns)
Here:
$7,220
State:
$3,365
Here:
5.7% of AGI
State:
3.6% of AGI
(% of AGI for various income ranges: 1.1% for AGIs $10k-25k, 2.0% for AGIs $25k-50k, 2.5% for AGIs $50k-75k, 2.9% for AGIs $75k-100k, 3.2% for AGIs over 100k)
Total tax: $10,939 (reported on 74.1% of returns)
48226:
$10,939
State:
$7,691
(% of AGI for various income ranges: 1.9% for AGIs below $10k, 4.3% for AGIs $10k-25k, 8.4% for AGIs $25k-50k, 13.4% for AGIs $50k-75k, 14.7% for AGIs $75k-100k, 19.5% for AGIs over 100k)
Earned income credit: $1,569 (reported on 17.9% of returns)
Here:
$1,569
State:
$1,737
Percentage of individuals using paid preparers for their 2004 taxes: 61.4%
Here:
61%
State:
60%
(% for various income ranges: 54.9% for AGIs below $10k, 64.7% for AGIs $10k-25k, 54.2% for AGIs $25k-50k, 56.2% for AGIs $50k-75k, 59.2% for AGIs $75k-100k, 84.3% for AGIs over 100k)
Likely homosexual households (counted as self-reported same-sex unmarried-partner households)
Lesbian couples: 0.4% of all households
Gay men: 0.0% of all households
Household received Food Stamps/SNAP in the past 12 months: 394 Household did not receive Food Stamps/SNAP in the past 12 months: 3,834
Women who had a birth in the past 12 months: 23 (15 now married, 8 unmarried) Women who did not have a birth in the past 12 months: 1,951 (345 now married, 1,615 unmarried)
Housing units in zip code 48226 with a mortgage: 303 (36 second mortgage, 37 both second mortgage and home equity loan) Median monthly owner costs for units with a mortgage: $1,944 Median monthly owner costs for units without a mortgage: $664
Residents with income below the poverty level in 2022:
This zip code:
14.8%
Whole state:
13.4%
Residents with income below 50% of the poverty level in 2022:
This zip code:
7.9%
Whole state:
6.9%
Median number of rooms in houses and condos:
Here:
4.1
State:
6.5
Median number of rooms in apartments:
Here:
2.9
State:
4.3
Notable locations in this zip code not listed on our city pages
Notable locations in zip code 48226: Millender Center Station (A), Michigan Station (B), Cadillac Square (C), Joe Louis Arena Station (D), Cobo Center (E), Union Station (F), Renaissance Center Station (G), Cobo Center Station (H), Cadillac Station (I), Bricktown Station (J), Hart Plaza (K), Greektown Station (L), Grand Circus Station (M), Fort Cass Station (N), City of Detroit Fire Department Emergency Medical Services Headquarters (O), Wayne County Administration Buiding (P), Wayne County Supreme Courthouse (Q), Cobo Conference Exhibition Center (R), Detroit City Hall Adminstrative Office (S), Detroit City Hall Central (T). Display/hide their locations on the map
Churches in zip code 48226 include: Mariners Church (A), Saint Peter and Paul Jesuit Church (B), Second Baptist Church of Detroit (C), Swords Into Plow Shares Peace Center (D), Archdiocese of Detroit (E). Display/hide their locations on the map
Parks in zip code 48226 include: Ford Field (1), Comerica Park (2), Joe Louis Arena (3), Elton Park (4), Birth of Kiwanis Historical Marker (5), Birthplace of Ford Automobile Historical Marker (6), Central United Methodist Church Historical Marker (7), Chapoton House Historical Marker (8), Chicago Road Historical Marker (9). Display/hide their locations on the map
In group quarters: 1,323 (-1 institutionalized population)
Size of family households: 460 2-persons, 86 3-persons, 54 4-persons
Size of nonfamily households: 3,247 1-person, 447 2-persons, 14 3-persons
36 married couples with children.
32 single-parent households (32 women).
90.2% of residents of 48226 zip code speak English at home.
2.1% of residents speak Spanish at home (80% very well, 11% well, 9% not well).
4.3% of residents speak other Indo-European language at home (100% very well).
2.3% of residents speak Asian or Pacific Island language at home (60% very well, 30% well, 10% not well).
0.7% of residents speak other language at home (100% very well).
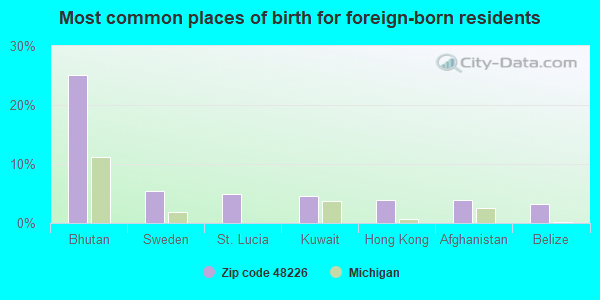
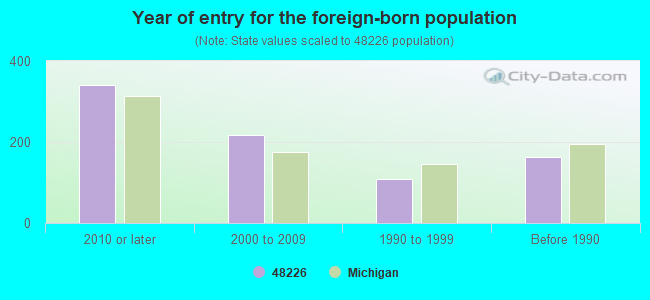
Foreign born population: 681 (9.9%) (33.2% of them are naturalized citizens)
Major facilities with environmental interests located in this zip code:
DETROIT EDISON COMPANY CONNERS CREEK PLANT (200 LYCASTE AVENUE in DETROIT, MI)
AIR MAJOR (AIRS/AFS) AIR PROGRAM (Clean Air Markets Division Business System) (Integrated Compliance Information System) - ICIS-05-1998-0715, FORMAL ENFORCEMENT ACTION CRITERIA AND HAZARDOUS AIR POLLUTANT INVENTORY (Inventory of air pollution sources) National Pollutant Discharge Elimination System MAJOR (Tracking pollutant discharge elimination systems) - permit AIR MAJOR ("Best Available" air pollution technologies tracking) Conditionally Exempt Small Quantity Generators, less than 100 kg/month of hazardous waste (Resource Conservation and Recovery Act (tracking hazardous waste)) USED OIL PROGRAM (Resource Conservation and Recovery Act (tracking hazardous waste)) Business SIC classification: ELECTRIC SERVICES Business NAICS classification: ELECTRIC BULK POWER TRANSMISSION AND CONTROL. Organizations: TOWN 2S (CONTACT/OPERATOR)
Alternative names: DECO-CONNERS CREEK PLT, DETROIT EDISON CO CONNOR CREEK PWR PLT, DETROIT EDISON CONNERS CRE, DETROIT EDISON CONNERS CREEK PLANT, DETROIT EDISON CONNERS CREEK PLANT
CHEMCENTRAL FARR STREET PROPERTY (6468 FARR STREET in DETROIT, MI)
SUPERFUND (Superfund database) (Integrated Compliance Information System) - ICIS-05-2001-0028, FORMAL ENFORCEMENT ACTION (Resource Conservation and Recovery Act (tracking hazardous waste)) Organizations: CHEMCENTRAL CORPORATION (CONTACT/OPERATOR)
, CITY OF DETROIT (CONTACT/OWNER)
Alternative names: CHEMCENTRAL CORP
DETROIT DEPT OF PUBLIC WORKS (12339 SOUTHFIELD RD in DETROIT, MI)
AIR MINOR (AIRS/AFS) (Integrated Compliance Information System) - ICIS-05-1997-0409, FORMAL ENFORCEMENT ACTION, ICIS-05-1998-0804, Business SIC classification: REFUSE SYSTEMS; GENERAL AUTOMOTIVE REPAIR SHOPS
AMERITECH CORP (1365 CASS AVE in DETROIT, MI)
(Integrated Compliance Information System) - ICIS-05-1985-0058, FORMAL ENFORCEMENT ACTION (Resource Conservation and Recovery Act (tracking hazardous waste)) Business SIC classification: TELEPHONE AND TELEGRAPH APPARATUS
FIRST NATIONAL BUILDING (660 WOODWARD in DETROIT, MI)
COMPLIANCE ACTIVITY (Tracking inspections of insecticide, fungicide, and rodenticide, and toxic substances) (Resource Conservation and Recovery Act (tracking hazardous waste)) Organizations: STRATFORD BUSINESS CORP (CONTACT/OPERATOR)
BENJAMIN CARSON ACADEMY (1326 ST. ANTOINE in DETROIT, MI)
(National Center for Education Statistics) - STATE ID-08604
DETROIT EDISON CO (555 BALTIMORE in DETROIT, MI)
AIR MINOR (AIRS/AFS) CRITERIA AND HAZARDOUS AIR POLLUTANT INVENTORY (Inventory of air pollution sources) Conditionally Exempt Small Quantity Generators, less than 100 kg/month of hazardous waste (Resource Conservation and Recovery Act (tracking hazardous waste)) Business SIC classification: ELECTRIC SERVICES; STEAM AND AIR-CONDITIONING SUPPLY Business NAICS classification: STEAM AND AIR-CONDITIONING SUPPLY. Organizations: THERMAL VENTURES II LP (CONTACT/OPERATOR)
Alternative names: DETROIT EDISON CO BOULEVARD HEATING PLT
DETROIT EDISON SUPERIOR (600 FIRST ST in DETROIT, MI)
AIR SYNTHETIC MINOR (AIRS/AFS) Conditionally Exempt Small Quantity Generators, less than 100 kg/month of hazardous waste (Resource Conservation and Recovery Act (tracking hazardous waste)) - notification (Resource Conservation and Recovery Act (tracking hazardous waste)) Business SIC classification: ELECTRIC SERVICES Business NAICS classification: FOSSIL FUEL ELECTRIC POWER GENERATION.; ELECTRIC POWER DISTRIBUTION. Organizations: DETROIT EDISON COMPANY (CONTACT/OPERATOR)
Alternative names: DETROIT EDISON CO ANN ARBOR, DETROIT EDISON CO SUPERIOR PEAKING UNIT
BEACON HEATING (541 MADISON STREET in DETROIT, MI)
AIR MAJOR (AIRS/AFS) AIR PROGRAM (Clean Air Markets Division Business System) CRITERIA AND HAZARDOUS AIR POLLUTANT INVENTORY (Inventory of air pollution sources) Conditionally Exempt Small Quantity Generators, less than 100 kg/month of hazardous waste (Resource Conservation and Recovery Act (tracking hazardous waste)) Business SIC classification: ELECTRIC SERVICES; STEAM AND AIR-CONDITIONING SUPPLY Organizations: THERMAL VENTURES II LP (CONTACT/OPERATOR)
Alternative names: DETROIT EDISON COMPANY, DETROIT EDISON CO BEACON HEATING PLT, DETROIT EDISON BEACON HEATING PLAN
DETROIT THERMAL HENRY HEATING (2401 FOURTH AVE in DETROIT, MI)
AIR MINOR (AIRS/AFS) CRITERIA AND HAZARDOUS AIR POLLUTANT INVENTORY (Inventory of air pollution sources) Conditionally Exempt Small Quantity Generators, less than 100 kg/month of hazardous waste (Resource Conservation and Recovery Act (tracking hazardous waste)) Business SIC and NAICS classification: STEAM AND AIR-CONDITIONING SUPPLY Organizations: DETROIT THERMAL LLC (CONTACT/OPERATOR)
Alternative names: DETROIT EDISON, DETROIT EDISON CO HENRY HEATING PLANT
BLUE CROSS BLUE SHIELD (600 LAFAYETTE in DETROIT, MI)
COMPLIANCE ACTIVITY (Tracking inspections of insecticide, fungicide, and rodenticide, and toxic substances) (Resource Conservation and Recovery Act (tracking hazardous waste)) Organizations: BLUE CROSS BLUE SHIELD OF MICHIGAN (CONTACT/OWNER)
DETROIT CITY OF FIRE DEPT (250 WEST LARNED STREET in DETROIT, MI)
(Resource Conservation and Recovery Act (tracking hazardous waste)) Organizations: DETROIT CITY OF DPW (CONTACT/OWNER)
Alternative names: DETROIT FIRE HEADQUARTERS CITY OF
ANR PIPELINE COMPANY (500 RENAISSANCE CENTER in DETROIT, MI)
AIR SYNTHETIC MINOR (AIRS/AFS) COMPLIANCE ACTIVITY (Tracking inspections of insecticide, fungicide, and rodenticide, and toxic substances) AIR MAJOR ("Best Available" air pollution technologies tracking) Conditionally Exempt Small Quantity Generators, less than 100 kg/month of hazardous waste (Resource Conservation and Recovery Act (tracking hazardous waste)) - notification Business SIC classification: ELECTRIC SERVICES; NATURAL GAS DISTRIBUTION Alternative names: ANR PIPELINE CO RENAISSANCE CENTER, BLUE LAKE GAS STORAGE CO., BLUE LAKE GAS STORAGE CO.
Housing units lacking complete plumbing facilities: 0.4% Housing units lacking complete kitchen facilities: 1.7%
50.2%Utility gas
47.7%Electricity
1.4%No fuel used
0.6%Other fuel
Population in 1990: 5,502. Population change in the 1990s: +636 (+11.6%).
Place of birth for U.S.-born residents:
This state: 4,441
Northeast: 260
Midwest: 557
South: 471
West: 376
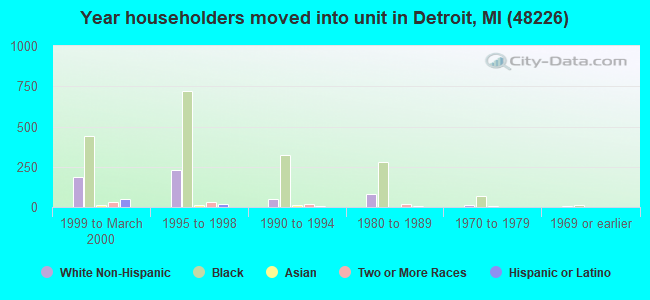
31% of the 48226 zip code residents lived in the same house 5 years ago. Out of people who lived in different houses, 53% lived in this county. Out of people who lived in different counties, 50% lived in Michigan.
67% of the 48226 zip code residents lived in the same house 1 year ago. Out of people who lived in different houses, 61% moved from this county. Out of people who lived in different houses, 19% moved from different county within same state. Out of people who lived in different houses, 15% moved from different state. Out of people who lived in different houses, 1% moved from abroad.
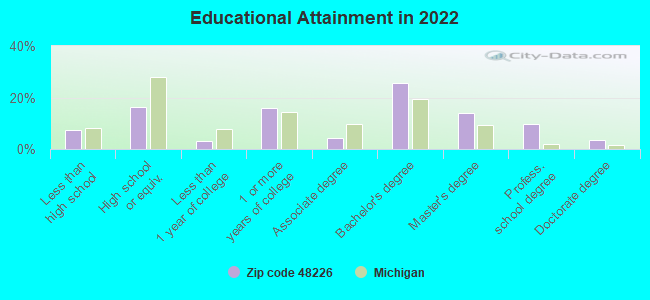
Private vs. public school enrollment:
Students in private schools in grades 1 to 8 (elementary and middle school): 8
Here:
14.8%
Michigan:
12.4%
Students in private schools in grades 9 to 12 (high school):
Here:
0.0%
Michigan:
9.8%
Students in private undergraduate colleges: 26
Here:
9.9%
Michigan:
14.9%
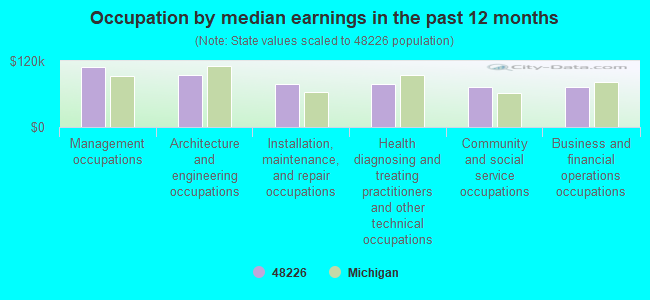
Occupation by median earnings in the past 12 months ($)
108,555Management occupations
94,347Architecture and engineering occupations
77,896Installation, maintenance, and repair occupations
77,461Health diagnosing and treating practitioners and other technical occupations
72,895Community and social service occupations
72,480Business and financial operations occupations
Companies with biggest federal contracts located in this zip code (DETROIT, MI):
WALBRIDGE ALDINGER CO (613 ABBOTT STREET) : $52,252,838 in 56 contractsfrom 1999 to 2006
Contracts for Construction of Structures and Facilities -- Airport Terminals, Construction of Structures and Facilities -- Other Administrative Facilities and Service Buildings, Lease or Rental of Facilities -- Office Buildings, Maintenance, Repair or Alteration of Real Property -- Other Administrative Facilities and Service Buildings, and moreby Navy, Army, Public Buildings Service Signed by year:2000: $57,000; 2001: $0; 2002: $79,152; 2003: $329,800; 2004: $9,700,080; 2005: $420,356; 2006: $41,609,450.
Biggest contracts:
$41,440,971 with Navy for Construction of Structures and Facilities -- Airport Terminals. Taking place in FL. Signed on 2006-03-21. Completion date: 2009-10-11.
$9,660,504 with Army for Construction of Structures and Facilities -- Other Administrative Facilities and Service Buildings. Signed on 2004-09-24. Completion date: 2006-01-17.
$125,000, same as above.Signed on 2005-06-25. Completion date: 2006-01-17.
$77,741, same as above.Signed on 2006-01-31. Completion date: 2006-01-17.
WALBRIDGE DOSTER (613 ABBOTT ST) : $29,439,950 in 10 contractsfrom 2005 to 2006
Contracts for Construction of Structures and Facilities -- Other Industrial Buildings by Army Signed by year:2000: $0; 2001: $0; 2002: $0; 2003: $0; 2004: $0; 2005: $29,391,000; 2006: $48,950.
Biggest contracts:
$29,391,000 with Army for Construction of Structures and Facilities -- Other Industrial Buildings. Taking place in KY. Signed on 2005-03-30. Completion date: 2007-06-30.
$44,100, same as above.Signed on 2006-05-02. Completion date: 2007-06-30.
$36,583, same as above.Signed on 2006-06-16. Completion date: 2007-06-30.
$25,250, same as above.Signed on 2006-01-31. Completion date: 2007-06-30.
STS ACQUISITION COMPANY (1502 RANDOLPH STREET, STE) : $3,344,167 in 43 contractsfrom 2000 to 2006
Contracts for Other Architect and Engineering Services, Inspection Services (including commercial testing and lab services, except medical/dental) -- Water Purification and Sewage Treatment Equipment by U.S. Army Corps of Engineers - civil program financing only, Army Signed by year:2000: $38,489; 2001: $120,841; 2002: $1,862,605; 2003: $729,104; 2004: $131,688; 2005: $464,232; 2006: -$2,792.
Biggest contracts:
$1,500,000 with U.S. Army Corps of Engineers - civil program financing only for Other Architect and Engineering Services. Signed on 2002-05-09. Completion date: 2003-05-08.
$499,980, same as above.Signed on 2003-08-22. Completion date: 2003-12-19.
$116,521, same as above.Signed on 2005-04-29. Completion date: 2005-07-29.
$116,521 with Army for Other Architect and Engineering Services. Signed on 2005-04-29. Completion date: 2005-07-29.
LAKE REGION OFFICE SUPPLY INC (211 W FORT ST; small business) : $2,940,934 in 42 contractsfrom 2000 to 2006
Contracts for Kitchen Equipment and Appliances, Miscellaneous Household and Commercial Furnishings and Appliances, Refrigeration Equipment, Laundry and Dry Cleaning Equipment, and moreby Army, Air Force, Navy, Department of State, and others Signed by year:2000: $170,378; 2001: $62,790; 2002: $1,922,408; 2003: $301,076; 2004: $178,001; 2005: $262,281; 2006: $44,000.
Biggest contracts:
$600,920 with Army for Kitchen Equipment and Appliances. Signed on 2002-09-25. Completion date: 2003-02-28.
$270,000 with Army for Miscellaneous Household and Commercial Furnishings and Appliances. Signed on 2002-06-14. Completion date: 2002-07-31.
$175,932 with Army for Kitchen Equipment and Appliances. Signed on 2002-09-27. Completion date: 2003-02-28.
$175,932, same as above.Signed on 2002-09-27. Completion date: 2003-02-28.
NTH WTA JOINT VENTURE (277 GRATIOT) : $2,741,860 in 43 contractsfrom 2000 to 2005
Contracts for Other Architect and Engineering Services, Architect - Engineer Services (including landscaping, interior layout, and designing), Power and Hand Pumps, Marine Architect and Engineering Services by Army, U.S. Army Corps of Engineers - civil program financing only, Defense Logistics Agency Signed by year:2000: $78,644; 2001: $252,722; 2002: $414,501; 2003: $553,331; 2004: $925,746; 2005: $516,916; 2006: $0.
Biggest contracts:
$357,717 with Army for Other Architect and Engineering Services. Signed on 2004-05-07. Completion date: 2004-04-15.
$357,717 with U.S. Army Corps of Engineers - civil program financing only for Other Architect and Engineering Services. Signed on 2004-05-07. Completion date: 2004-04-15.
$205,000, same as above.Signed on 2003-02-21. Completion date: 2003-08-21.
$169,750 with U.S. Army Corps of Engineers - civil program financing only for Architect - Engineer Services (including landscaping, interior layout, and designing). Signed on 2002-04-30. Completion date: 2002-09-30.
ANGELIC CARE CHILD CARE CENTER (1505 WOODWARD AVE 5TH FLO; small business) : $1,954,727 in 6 contractsfrom 2004 to 2005
Contracts for Educational Services, Miscellaneous Items, Other Professional Services by Defense Logistics Agency, Bureau of the Census Signed by year:2000: $0; 2001: $0; 2002: $0; 2003: $0; 2004: $1,265,827; 2005: $688,900; 2006: $0.
Biggest contracts:
$688,900 with Defense Logistics Agency for Educational Services. Taking place in OH. Signed on 2005-05-02. Completion date: 2006-05-01.
$540,000, same as above.Signed on 2004-04-05. Completion date: 2005-05-01.
$520,827 with Defense Logistics Agency for Miscellaneous Items. Taking place in FL. Signed on 2004-10-01. Completion date: 2004-10-30.
$205,000 with Defense Logistics Agency for Miscellaneous Items. Taking place in OH. Signed on 2004-10-01. Completion date: 2004-10-30.
HOWARD STREET ASSOCIATES LLC (211 W 4TH ST STE 1604; small business) 14 employees, $610000 revenue. : $1,822,251 in 43 contractsfrom 2001 to 2006
Contracts for Lease or Rental of Facilities -- Office Buildings by Public Buildings Service Signed by year:2000: $0; 2001: $166,000; 2002: $417,868; 2003: $701,576; 2004: $84,759; 2005: $339,036; 2006: $113,012.
Biggest contracts:
$84,289 with Public Buildings Service for Lease or Rental of Facilities -- Office Buildings. Signed on 2003-09-15. Completion date: 2003-09-15.
$84,289, same as above.Signed on 2003-06-15. Completion date: 2003-06-15.
$84,000, same as above.Signed on 2002-09-15. Completion date: 2002-09-15.
$83,934, same as above.Signed on 2003-03-15. Completion date: 2003-03-15.
COLE FINANCIAL SERVICES, INC (139 CADILLAC SQUARE; small business) : $1,147,800 in 14 contractsfrom 2001 to 2005
Contracts for Other Administrative Support Services by Army Signed by year:2000: $0; 2001: $277,892; 2002: $287,195; 2003: $293,497; 2004: $288,416; 2005: $800; 2006: $0.
Biggest contracts:
$290,213 with Army for Other Administrative Support Services. Signed on 2003-10-01. Completion date: 2002-09-30.
$289,830, same as above.Signed on 2004-10-01. Completion date: 2002-09-30.
$288,278, same as above.Signed on 2002-10-04. Completion date: 2002-09-30.
$277,892, same as above.Signed on 2001-10-01. Completion date: 2002-09-30.
PONTCH LIMITED PARTNERSHIP (2 WASHINGTON BLVD) : $911,656 in 11 contractsin 2002
Contracts for Lodging - Hotel/Motel by Army Signed by year:2000: $0; 2001: $0; 2002: $911,656; 2003: $0; 2004: $0; 2005: $0; 2006: $0.
Biggest contracts:
$97,242 with Army for Lodging - Hotel/Motel. Signed on 2002-03-29. Completion date: 2002-03-31.
$96,144, same as above.Signed on 2002-05-16. Completion date: 2002-05-31.
$91,170, same as above.Signed on 2002-04-04. Completion date: 2002-04-15.
$91,170, same as above.Signed on 2002-04-16. Completion date: 2002-04-30.
MICHIGAN BELL TELEPHONE COMPAN (444 MICHIGAN AVE) : $847,917 in 52 contractsfrom 2000 to 2006
Contracts for ADP Telecommunications and Transmission Services, Telephone and/or Communications Services (includes Telegraph, Telex, and Cablevision Services) by Defense Information Systems Agency, Department of Veterans Affairs, Department of Defense, Indian Affairs (Assistant Secretary), and others Signed by year:2000: $86,000; 2001: $57,000; 2002: $0; 2003: $225,431; 2004: $229,500; 2005: $217,034; 2006: $32,952.
Biggest contracts:
$89,092 with Defense Information Systems Agency for ADP Telecommunications and Transmission Services. Signed on 2005-10-31. Completion date: 2015-09-30.
$86,000 with Department of Veterans Affairs for Telephone and/or Communications Services (includes Telegraph, Telex, and Cablevision Services). Signed on 2000-10-15. Completion date: 2001-09-15.
$77,580 with Defense Information Systems Agency for ADP Telecommunications and Transmission Services. Signed on 2004-04-30. Completion date: 2009-01-13.
$57,000 with Department of Veterans Affairs for Telephone and/or Communications Services (includes Telegraph, Telex, and Cablevision Services). Signed on 2001-05-15. Completion date: 2002-09-15.
Top industries in this zip code by the number of employees in 2005:
Utilities: Electric Power Distribution (over 1000 employees: 1 establishment, 500-999 employees: 2 establishments, 50-99 employees: 1 establishment, 20-49 employees: 1 establishment, 10-19 employees: 1 establishment, 5-9 employees: 1 establishment)
Management of Companies and Enterprises: Corporate, Subsidiary, and Regional Managing Offices (over 1000: 1, 250-499: 1, 100-249: 1, 20-49: 1, 10-19: 2, 5-9: 1, 1-4: 3)
Administrative and Support and Waste Management and Remediation Services: Janitorial Services (over 1000: 1, 100-249: 1, 50-99: 1, 20-49: 1, 10-19: 2, 5-9: 2, 1-4: 1)
Administrative and Support and Waste Management and Remediation Services: Temporary Help Services (500-999: 1, 250-499: 1, 50-99: 2, 20-49: 2, 10-19: 1, 1-4: 4)
Accommodation and Food Services: Food Service Contractors (500-999: 1, 250-499: 1, 20-49: 2, 10-19: 2, 5-9: 1, 1-4: 1)
People in group quarters in 2010:
489 people in local jails and other municipal confinement facilities
187 people in other noninstitutional facilities
70 people in emergency and transitional shelters (with sleeping facilities) for people experiencing homelessness
People in group quarters in 2000:
1,868 people in local jails and other confinement facilities (including police lockups)
389 people in other noninstitutional group quarters
23 people in other group homes
22 people in crews of maritime vessels
9 people in religious group quarters
5 people in other nonhousehold living situations
Fatal accident statistics in 2014:
Fatal accident count: 1
Vehicles involved in fatal accidents: 1
Fatal accidents caused by drunken drivers: 1
Fatalities: 1
Persons involved in fatal accidents: 1
Pedestrians involved in fatal accidents: 0
Fatal accident statistics in 2013:
Fatal accident count: 1
Vehicles involved in fatal accidents: 1
Fatal accidents caused by drunken drivers: 0
Fatalities: 1
Persons involved in fatal accidents: 1
Pedestrians involved in fatal accidents: 0
Home Mortgage Disclosure Act Aggregated Statistics For Year 2009 (Based on 10 partial tracts)
A) FHA, FSA/RHS & VA Home Purchase Loans
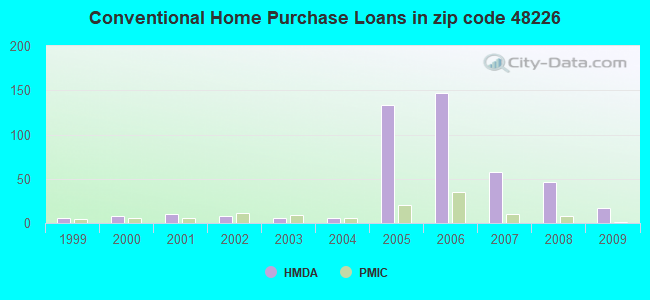
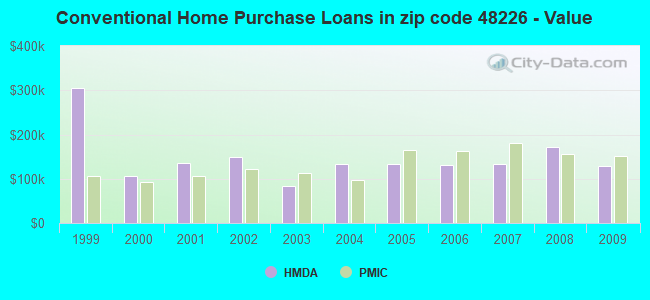
B) Conventional Home Purchase Loans
C) Refinancings
D) Home Improvement Loans
E) Loans on Dwellings For 5+ Families
F) Non-occupant Loans on < 5 Family Dwellings (A B C & D)
Number
Average Value
Number
Average Value
Number
Average Value
Number
Average Value
Number
Average Value
Number
Average Value
LOANS ORIGINATED
11
$137,477
17
$129,522
4
$155,672
0
$0
1
$1,821,640
4
$107,528
APPLICATIONS APPROVED, NOT ACCEPTED
0
$0
2
$79,045
0
$0
1
$2,420
0
$0
0
$0
APPLICATIONS DENIED
1
$166,750
5
$102,432
10
$168,295
4
$20,772
0
$0
9
$83,367
APPLICATIONS WITHDRAWN
2
$68,960
6
$81,460
3
$511,020
0
$0
0
$0
5
$341,888
FILES CLOSED FOR INCOMPLETENESS
0
$0
5
$134,986
0
$0
0
$0
0
$0
1
$291,150
Aggregated Statistics For Year 2008 (Based on 8 partial tracts)
A) FHA, FSA/RHS & VA Home Purchase Loans
B) Conventional Home Purchase Loans
C) Refinancings
D) Home Improvement Loans
F) Non-occupant Loans on < 5 Family Dwellings (A B C & D)
G) Loans On Manufactured Home Dwelling (A B C & D)
Number
Average Value
Number
Average Value
Number
Average Value
Number
Average Value
Number
Average Value
Number
Average Value
LOANS ORIGINATED
2
$125,025
46
$171,351
7
$163,467
2
$2,250
9
$149,168
0
$0
APPLICATIONS APPROVED, NOT ACCEPTED
0
$0
1
$21,510
1
$342,760
0
$0
0
$0
1
$21,510
APPLICATIONS DENIED
1
$116,460
8
$230,454
19
$172,461
3
$13,530
8
$149,008
0
$0
APPLICATIONS WITHDRAWN
2
$134,220
7
$208,417
4
$235,565
0
$0
3
$131,900
0
$0
FILES CLOSED FOR INCOMPLETENESS
0
$0
0
$0
0
$0
0
$0
0
$0
0
$0
Aggregated Statistics For Year 2007 (Based on 10 partial tracts)
B) Conventional Home Purchase Loans
C) Refinancings
D) Home Improvement Loans
E) Loans on Dwellings For 5+ Families
F) Non-occupant Loans on < 5 Family Dwellings (A B C & D)
Number
Average Value
Number
Average Value
Number
Average Value
Number
Average Value
Number
Average Value
LOANS ORIGINATED
58
$134,253
7
$134,939
2
$15,420
4
$4,550,405
13
$126,442
APPLICATIONS APPROVED, NOT ACCEPTED
14
$163,094
2
$201,190
1
$291,150
0
$0
0
$0
APPLICATIONS DENIED
14
$233,141
13
$145,335
7
$34,377
0
$0
7
$128,407
APPLICATIONS WITHDRAWN
13
$125,584
3
$171,927
0
$0
0
$0
2
$114,390
FILES CLOSED FOR INCOMPLETENESS
9
$114,023
0
$0
0
$0
0
$0
1
$124,400
Aggregated Statistics For Year 2006 (Based on 10 partial tracts)
A) FHA, FSA/RHS & VA Home Purchase Loans
B) Conventional Home Purchase Loans
C) Refinancings
D) Home Improvement Loans
E) Loans on Dwellings For 5+ Families
F) Non-occupant Loans on < 5 Family Dwellings (A B C & D)
G) Loans On Manufactured Home Dwelling (A B C & D)
Number
Average Value
Number
Average Value
Number
Average Value
Number
Average Value
Number
Average Value
Number
Average Value
Number
Average Value
LOANS ORIGINATED
0
$0
147
$131,526
11
$151,825
0
$0
1
$2,545,200
48
$135,311
0
$0
APPLICATIONS APPROVED, NOT ACCEPTED
4
$95,325
42
$145,911
11
$177,594
0
$0
0
$0
9
$158,596
1
$78,080
APPLICATIONS DENIED
0
$0
44
$126,366
26
$209,997
6
$46,253
0
$0
27
$101,935
1
$44,370
APPLICATIONS WITHDRAWN
0
$0
29
$126,097
7
$128,607
1
$502,890
0
$0
7
$81,760
0
$0
FILES CLOSED FOR INCOMPLETENESS
0
$0
5
$119,642
5
$82,956
0
$0
0
$0
0
$0
0
$0
Aggregated Statistics For Year 2005 (Based on 10 partial tracts)
B) Conventional Home Purchase Loans
C) Refinancings
D) Home Improvement Loans
F) Non-occupant Loans on < 5 Family Dwellings (A B C & D)
Number
Average Value
Number
Average Value
Number
Average Value
Number
Average Value
LOANS ORIGINATED
133
$132,557
10
$79,673
0
$0
38
$106,971
APPLICATIONS APPROVED, NOT ACCEPTED
39
$164,615
4
$135,640
0
$0
9
$56,733
APPLICATIONS DENIED
70
$156,010
13
$111,654
6
$30,808
15
$84,467
APPLICATIONS WITHDRAWN
42
$126,847
15
$121,551
4
$241,058
9
$124,562
FILES CLOSED FOR INCOMPLETENESS
5
$268,120
8
$217,318
0
$0
3
$167,077
Aggregated Statistics For Year 2004 (Based on 10 partial tracts)
A) FHA, FSA/RHS & VA Home Purchase Loans
B) Conventional Home Purchase Loans
C) Refinancings
D) Home Improvement Loans
E) Loans on Dwellings For 5+ Families
F) Non-occupant Loans on < 5 Family Dwellings (A B C & D)
G) Loans On Manufactured Home Dwelling (A B C & D)
Number
Average Value
Number
Average Value
Number
Average Value
Number
Average Value
Number
Average Value
Number
Average Value
Number
Average Value
LOANS ORIGINATED
1
$94,910
6
$134,412
10
$120,180
5
$28,640
4
$4,465,810
5
$79,502
0
$0
APPLICATIONS APPROVED, NOT ACCEPTED
3
$126,180
17
$143,846
10
$114,349
1
$7,940
0
$0
8
$118,109
0
$0
APPLICATIONS DENIED
4
$151,002
26
$91,914
27
$101,224
2
$120,060
0
$0
5
$102,940
1
$82,420
APPLICATIONS WITHDRAWN
0
$0
4
$126,092
11
$147,228
0
$0
0
$0
2
$177,335
0
$0
FILES CLOSED FOR INCOMPLETENESS
0
$0
6
$131,528
1
$108,120
0
$0
0
$0
0
$0
0
$0
Aggregated Statistics For Year 2003 (Based on 10 partial tracts)
A) FHA, FSA/RHS & VA Home Purchase Loans
B) Conventional Home Purchase Loans
C) Refinancings
D) Home Improvement Loans
E) Loans on Dwellings For 5+ Families
F) Non-occupant Loans on < 5 Family Dwellings (A B C & D)
Number
Average Value
Number
Average Value
Number
Average Value
Number
Average Value
Number
Average Value
Number
Average Value
LOANS ORIGINATED
0
$0
6
$82,632
20
$134,666
3
$7,303
4
$8,299,472
5
$48,390
APPLICATIONS APPROVED, NOT ACCEPTED
3
$74,993
3
$157,160
5
$72,642
0
$0
0
$0
1
$52,940
APPLICATIONS DENIED
0
$0
14
$118,497
26
$73,293
3
$45,327
0
$0
5
$92,998
APPLICATIONS WITHDRAWN
1
$77,980
5
$104,998
14
$81,324
0
$0
0
$0
1
$54,270
FILES CLOSED FOR INCOMPLETENESS
0
$0
2
$121,805
3
$184,613
0
$0
0
$0
1
$327,540
Aggregated Statistics For Year 2002 (Based on 10 partial tracts)
A) FHA, FSA/RHS & VA Home Purchase Loans
B) Conventional Home Purchase Loans
C) Refinancings
D) Home Improvement Loans
F) Non-occupant Loans on < 5 Family Dwellings (A B C & D)
Number
Average Value
Number
Average Value
Number
Average Value
Number
Average Value
Number
Average Value
LOANS ORIGINATED
0
$0
8
$148,818
19
$133,984
3
$10,263
2
$91,090
APPLICATIONS APPROVED, NOT ACCEPTED
0
$0
5
$339,246
9
$116,921
1
$11,660
5
$329,524
APPLICATIONS DENIED
1
$211,740
9
$247,957
31
$68,438
4
$21,718
13
$51,584
APPLICATIONS WITHDRAWN
0
$0
2
$125,270
13
$76,216
0
$0
3
$72,730
FILES CLOSED FOR INCOMPLETENESS
1
$104,550
2
$99,320
10
$103,762
0
$0
1
$96,960
Aggregated Statistics For Year 2001 (Based on 10 partial tracts)
A) FHA, FSA/RHS & VA Home Purchase Loans
B) Conventional Home Purchase Loans
C) Refinancings
D) Home Improvement Loans
F) Non-occupant Loans on < 5 Family Dwellings (A B C & D)
Number
Average Value
Number
Average Value
Number
Average Value
Number
Average Value
Number
Average Value
LOANS ORIGINATED
3
$133,640
10
$135,948
17
$172,091
4
$15,115
2
$77,520
APPLICATIONS APPROVED, NOT ACCEPTED
1
$113,810
3
$117,617
12
$86,192
3
$25,150
4
$45,815
APPLICATIONS DENIED
0
$0
14
$136,230
27
$83,145
3
$21,347
4
$183,978
APPLICATIONS WITHDRAWN
0
$0
8
$87,272
9
$75,248
1
$17,200
2
$110,915
FILES CLOSED FOR INCOMPLETENESS
0
$0
1
$238,210
1
$303,010
0
$0
1
$238,210
Aggregated Statistics For Year 2000 (Based on 10 partial tracts)
A) FHA, FSA/RHS & VA Home Purchase Loans
B) Conventional Home Purchase Loans
C) Refinancings
D) Home Improvement Loans
F) Non-occupant Loans on < 5 Family Dwellings (A B C & D)
Number
Average Value
Number
Average Value
Number
Average Value
Number
Average Value
Number
Average Value
LOANS ORIGINATED
2
$57,710
8
$107,122
5
$102,626
3
$11,463
1
$68,820
APPLICATIONS APPROVED, NOT ACCEPTED
0
$0
11
$52,985
7
$110,249
2
$5,565
3
$35,153
APPLICATIONS DENIED
2
$71,035
13
$72,351
14
$69,907
14
$15,053
2
$48,115
APPLICATIONS WITHDRAWN
0
$0
3
$64,710
12
$69,407
0
$0
0
$0
FILES CLOSED FOR INCOMPLETENESS
0
$0
4
$79,188
3
$31,217
0
$0
0
$0
Aggregated Statistics For Year 1999 (Based on 6 partial tracts)
A) FHA, FSA/RHS & VA Home Purchase Loans
B) Conventional Home Purchase Loans
C) Refinancings
D) Home Improvement Loans
E) Loans on Dwellings For 5+ Families
F) Non-occupant Loans on < 5 Family Dwellings (A B C & D)
2002 - 2018 National Fire Incident Reporting System (NFIRS) incidents
Based on the data from the years 2002 - 2018 the average number of fires per year is 30. The highest number of fires - 91 took place in 2016, and the least - 0 in 2003. The data has an increasing trend.
When looking into fire subcategories, the most reports belonged to: Structure Fires (40.3%), and Outside Fires (30.0%).
Fire incident types reported to NFIRS in Zip Code 48226


 Nearest zip codes: 48243, 48233, 48201, 48216, 48207, 48208.


 Based on the data from the years 2002 - 2018 the average number of fires per year is 30. The highest number of fires - 91 took place in 2016, and the least - 0 in 2003. The data has an increasing trend.
 When looking into fire subcategories, the most reports belonged to: Structure Fires (40.3%), and Outside Fires (30.0%).