Estimated zip code population in 2022: 8,556
Zip code population in 2010: 7,465
Zip code population in 2000: 7,067
Houses and condos: 3,674
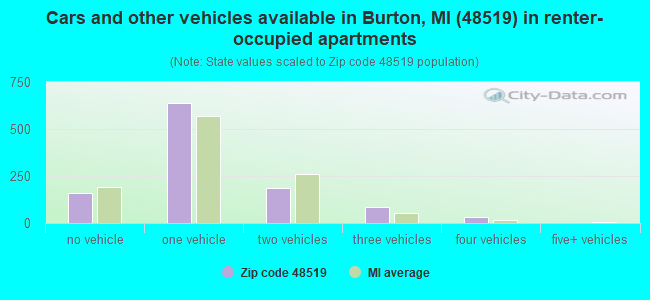
Renter-occupied apartments: 1,090
% of renters here:
31%State:
27%
March 2022 cost of living index in zip code 48519: 80.3
(low, U.S. average is 100)
Land area: 7.7
sq. mi.
Water area: 0.0
sq. mi.
Population density: 1,108 people per square mile (low).
OSM Map
General Map
Google Map
MSN Map
OSM Map
General Map
Google Map
MSN Map
OSM Map
General Map
Google Map
MSN Map
OSM Map
General Map
Google Map
MSN Map
Please wait while loading the map...
Real estate property taxes paid for housing units in 2022:
This zip code:
1.4% ($2,260)Michigan:
1.2% ($2,746)
Median real estate property taxes paid for housing units with mortgages in 2022: $2,373 (1.4%)
Median real estate property taxes paid for housing units with no mortgage in 2022: $2,087 (1.5%)
Business Search - 14 Million verified businesses
Males: 3,994 Females: 4,562
For population 25 years and over in 48519:
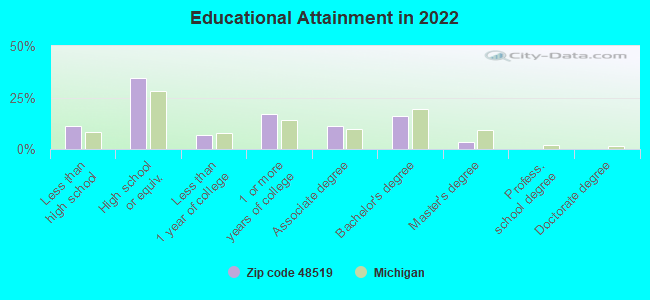
High school or higher: 88.2%Bachelor's degree or higher: 19.5%Graduate or professional degree: 3.4%Unemployed: 4.6%Mean travel time to work (commute): 25.0 minutes
For population 15 years and over in 48519:
Never married: 38.1%Now married: 38.1%Separated: 0.4%Widowed: 6.9%Divorced: 16.6%
Zip code 48519 compared to state average:
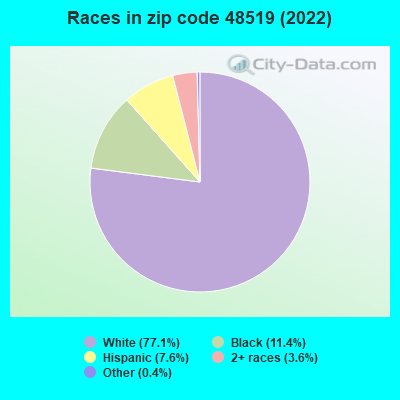
Foreign-born population percentage significantly below state average. Length of stay since moving in significantly above state average. Percentage of population with a bachelor's degree or higher below state average. 6,596 77.1% White 972 11.4% Black 647 7.6% Hispanic or Latino 304 3.6% Two or more races 34 0.4% Some other race
Data:
Median household income ($)
Median household income (% change since 2000)
Household income diversity
Ratio of average income to average house value (%)
Ratio of average income to average rent
Median household income ($) - White
Median household income ($) - Black or African American
Median household income ($) - Asian
Median household income ($) - Hispanic or Latino
Median household income ($) - American Indian and Alaska Native
Median household income ($) - Multirace
Median household income ($) - Other Race
Median household income for houses/condos with a mortgage ($)
Median household income for apartments without a mortgage ($)
Races - White alone (%)
Races - White alone (% change since 2000)
Races - Black alone (%)
Races - Black alone (% change since 2000)
Races - American Indian alone (%)
Races - American Indian alone (% change since 2000)
Races - Asian alone (%)
Races - Asian alone (% change since 2000)
Races - Hispanic (%)
Races - Hispanic (% change since 2000)
Races - Native Hawaiian and Other Pacific Islander alone (%)
Races - Native Hawaiian and Other Pacific Islander alone (% change since 2000)
Races - Two or more races (%)
Races - Two or more races (% change since 2000)
Races - Other race alone (%)
Races - Other race alone (% change since 2000)
Racial diversity
Unemployment (%)
Unemployment (% change since 2000)
Unemployment (%) - White
Unemployment (%) - Black or African American
Unemployment (%) - Asian
Unemployment (%) - Hispanic or Latino
Unemployment (%) - American Indian and Alaska Native
Unemployment (%) - Multirace
Unemployment (%) - Other Race
Population density (people per square mile)
Population - Males (%)
Population - Females (%)
Population - Males (%) - White
Population - Males (%) - Black or African American
Population - Males (%) - Asian
Population - Males (%) - Hispanic or Latino
Population - Males (%) - American Indian and Alaska Native
Population - Males (%) - Multirace
Population - Males (%) - Other Race
Population - Females (%) - White
Population - Females (%) - Black or African American
Population - Females (%) - Asian
Population - Females (%) - Hispanic or Latino
Population - Females (%) - American Indian and Alaska Native
Population - Females (%) - Multirace
Population - Females (%) - Other Race
Coronavirus confirmed cases (Apr 19, 2024)
Deaths caused by coronavirus (Apr 19, 2024)
Coronavirus confirmed cases (per 100k population) (Apr 19, 2024)
Deaths caused by coronavirus (per 100k population) (Apr 19, 2024)
Daily increase in number of cases (Apr 19, 2024)
Weekly increase in number of cases (Apr 19, 2024)
Cases doubled (in days) (Apr 19, 2024)
Hospitalized patients (Apr 18, 2022)
Negative test results (Apr 18, 2022)
Total test results (Apr 18, 2022)
COVID Vaccine doses distributed (per 100k population) (Sep 19, 2023)
COVID Vaccine doses administered (per 100k population) (Sep 19, 2023)
COVID Vaccine doses distributed (Sep 19, 2023)
COVID Vaccine doses administered (Sep 19, 2023)
Likely homosexual households (%)
Likely homosexual households (% change since 2000)
Likely homosexual households - Lesbian couples (%)
Likely homosexual households - Lesbian couples (% change since 2000)
Likely homosexual households - Gay men (%)
Likely homosexual households - Gay men (% change since 2000)
Cost of living index
Median gross rent ($)
Median contract rent ($)
Median monthly housing costs ($)
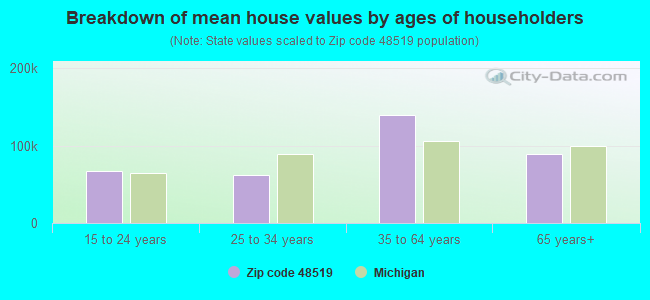
Median house or condo value ($)
Median house or condo value ($ change since 2000)
Mean house or condo value by units in structure - 1, detached ($)
Mean house or condo value by units in structure - 1, attached ($)
Mean house or condo value by units in structure - 2 ($)
Mean house or condo value by units in structure by units in structure - 3 or 4 ($)
Mean house or condo value by units in structure - 5 or more ($)
Mean house or condo value by units in structure - Boat, RV, van, etc. ($)
Mean house or condo value by units in structure - Mobile home ($)
Median house or condo value ($) - White
Median house or condo value ($) - Black or African American
Median house or condo value ($) - Asian
Median house or condo value ($) - Hispanic or Latino
Median house or condo value ($) - American Indian and Alaska Native
Median house or condo value ($) - Multirace
Median house or condo value ($) - Other Race
Median resident age
Resident age diversity
Median resident age - Males
Median resident age - Females
Median resident age - White
Median resident age - Black or African American
Median resident age - Asian
Median resident age - Hispanic or Latino
Median resident age - American Indian and Alaska Native
Median resident age - Multirace
Median resident age - Other Race
Median resident age - Males - White
Median resident age - Males - Black or African American
Median resident age - Males - Asian
Median resident age - Males - Hispanic or Latino
Median resident age - Males - American Indian and Alaska Native
Median resident age - Males - Multirace
Median resident age - Males - Other Race
Median resident age - Females - White
Median resident age - Females - Black or African American
Median resident age - Females - Asian
Median resident age - Females - Hispanic or Latino
Median resident age - Females - American Indian and Alaska Native
Median resident age - Females - Multirace
Median resident age - Females - Other Race
Commute - mean travel time to work (minutes)
Travel time to work - Less than 5 minutes (%)
Travel time to work - Less than 5 minutes (% change since 2000)
Travel time to work - 5 to 9 minutes (%)
Travel time to work - 5 to 9 minutes (% change since 2000)
Travel time to work - 10 to 19 minutes (%)
Travel time to work - 10 to 19 minutes (% change since 2000)
Travel time to work - 20 to 29 minutes (%)
Travel time to work - 20 to 29 minutes (% change since 2000)
Travel time to work - 30 to 39 minutes (%)
Travel time to work - 30 to 39 minutes (% change since 2000)
Travel time to work - 40 to 59 minutes (%)
Travel time to work - 40 to 59 minutes (% change since 2000)
Travel time to work - 60 to 89 minutes (%)
Travel time to work - 60 to 89 minutes (% change since 2000)
Travel time to work - 90 or more minutes (%)
Travel time to work - 90 or more minutes (% change since 2000)
Marital status - Never married (%)
Marital status - Now married (%)
Marital status - Separated (%)
Marital status - Widowed (%)
Marital status - Divorced (%)
Median family income ($)
Median family income (% change since 2000)
Median non-family income ($)
Median non-family income (% change since 2000)
Median per capita income ($)
Median per capita income (% change since 2000)
Median family income ($) - White
Median family income ($) - Black or African American
Median family income ($) - Asian
Median family income ($) - Hispanic or Latino
Median family income ($) - American Indian and Alaska Native
Median family income ($) - Multirace
Median family income ($) - Other Race
Median year house/condo built
Median year apartment built
Year house built - Built 2005 or later (%)
Year house built - Built 2000 to 2004 (%)
Year house built - Built 1990 to 1999 (%)
Year house built - Built 1980 to 1989 (%)
Year house built - Built 1970 to 1979 (%)
Year house built - Built 1960 to 1969 (%)
Year house built - Built 1950 to 1959 (%)
Year house built - Built 1940 to 1949 (%)
Year house built - Built 1939 or earlier (%)
Average household size
Household density (households per square mile)
Average household size - White
Average household size - Black or African American
Average household size - Asian
Average household size - Hispanic or Latino
Average household size - American Indian and Alaska Native
Average household size - Multirace
Average household size - Other Race
Occupied housing units (%)
Vacant housing units (%)
Owner occupied housing units (%)
Renter occupied housing units (%)
Vacancy status - For rent (%)
Vacancy status - For sale only (%)
Vacancy status - Rented or sold, not occupied (%)
Vacancy status - For seasonal, recreational, or occasional use (%)
Vacancy status - For migrant workers (%)
Vacancy status - Other vacant (%)
Residents with income below the poverty level (%)
Residents with income below 50% of the poverty level (%)
Children below poverty level (%)
Poor families by family type - Married-couple family (%)
Poor families by family type - Male, no wife present (%)
Poor families by family type - Female, no husband present (%)
Poverty status for native-born residents (%)
Poverty status for foreign-born residents (%)
Poverty among high school graduates not in families (%)
Poverty among people who did not graduate high school not in families (%)
Residents with income below the poverty level (%) - White
Residents with income below the poverty level (%) - Black or African American
Residents with income below the poverty level (%) - Asian
Residents with income below the poverty level (%) - Hispanic or Latino
Residents with income below the poverty level (%) - American Indian and Alaska Native
Residents with income below the poverty level (%) - Multirace
Residents with income below the poverty level (%) - Other Race
Air pollution - Air Quality Index (AQI)
Air pollution - CO
Air pollution - NO2
Air pollution - SO2
Air pollution - Ozone
Air pollution - PM10
Air pollution - PM25
Air pollution - Pb
Crime - Murders per 100,000 population
Crime - Rapes per 100,000 population
Crime - Robberies per 100,000 population
Crime - Assaults per 100,000 population
Crime - Burglaries per 100,000 population
Crime - Thefts per 100,000 population
Crime - Auto thefts per 100,000 population
Crime - Arson per 100,000 population
Crime - City-data.com crime index
Crime - Violent crime index
Crime - Property crime index
Crime - Murders per 100,000 population (5 year average)
Crime - Rapes per 100,000 population (5 year average)
Crime - Robberies per 100,000 population (5 year average)
Crime - Assaults per 100,000 population (5 year average)
Crime - Burglaries per 100,000 population (5 year average)
Crime - Thefts per 100,000 population (5 year average)
Crime - Auto thefts per 100,000 population (5 year average)
Crime - Arson per 100,000 population (5 year average)
Crime - City-data.com crime index (5 year average)
Crime - Violent crime index (5 year average)
Crime - Property crime index (5 year average)
1996 Presidential Elections Results (%) - Democratic Party (Clinton)
1996 Presidential Elections Results (%) - Republican Party (Dole)
1996 Presidential Elections Results (%) - Other
2000 Presidential Elections Results (%) - Democratic Party (Gore)
2000 Presidential Elections Results (%) - Republican Party (Bush)
2000 Presidential Elections Results (%) - Other
2004 Presidential Elections Results (%) - Democratic Party (Kerry)
2004 Presidential Elections Results (%) - Republican Party (Bush)
2004 Presidential Elections Results (%) - Other
2008 Presidential Elections Results (%) - Democratic Party (Obama)
2008 Presidential Elections Results (%) - Republican Party (McCain)
2008 Presidential Elections Results (%) - Other
2012 Presidential Elections Results (%) - Democratic Party (Obama)
2012 Presidential Elections Results (%) - Republican Party (Romney)
2012 Presidential Elections Results (%) - Other
2016 Presidential Elections Results (%) - Democratic Party (Clinton)
2016 Presidential Elections Results (%) - Republican Party (Trump)
2016 Presidential Elections Results (%) - Other
2020 Presidential Elections Results (%) - Democratic Party (Biden)
2020 Presidential Elections Results (%) - Republican Party (Trump)
2020 Presidential Elections Results (%) - Other
Ancestries Reported - Arab (%)
Ancestries Reported - Czech (%)
Ancestries Reported - Danish (%)
Ancestries Reported - Dutch (%)
Ancestries Reported - English (%)
Ancestries Reported - French (%)
Ancestries Reported - French Canadian (%)
Ancestries Reported - German (%)
Ancestries Reported - Greek (%)
Ancestries Reported - Hungarian (%)
Ancestries Reported - Irish (%)
Ancestries Reported - Italian (%)
Ancestries Reported - Lithuanian (%)
Ancestries Reported - Norwegian (%)
Ancestries Reported - Polish (%)
Ancestries Reported - Portuguese (%)
Ancestries Reported - Russian (%)
Ancestries Reported - Scotch-Irish (%)
Ancestries Reported - Scottish (%)
Ancestries Reported - Slovak (%)
Ancestries Reported - Subsaharan African (%)
Ancestries Reported - Swedish (%)
Ancestries Reported - Swiss (%)
Ancestries Reported - Ukrainian (%)
Ancestries Reported - United States (%)
Ancestries Reported - Welsh (%)
Ancestries Reported - West Indian (%)
Ancestries Reported - Other (%)
Educational Attainment - No schooling completed (%)
Educational Attainment - Less than high school (%)
Educational Attainment - High school or equivalent (%)
Educational Attainment - Less than 1 year of college (%)
Educational Attainment - 1 or more years of college (%)
Educational Attainment - Associate degree (%)
Educational Attainment - Bachelor's degree (%)
Educational Attainment - Master's degree (%)
Educational Attainment - Professional school degree (%)
Educational Attainment - Doctorate degree (%)
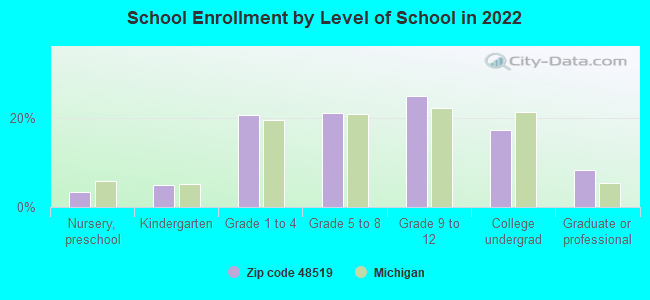
School Enrollment - Nursery, preschool (%)
School Enrollment - Kindergarten (%)
School Enrollment - Grade 1 to 4 (%)
School Enrollment - Grade 5 to 8 (%)
School Enrollment - Grade 9 to 12 (%)
School Enrollment - College undergrad (%)
School Enrollment - Graduate or professional (%)
School Enrollment - Not enrolled in school (%)
School enrollment - Public schools (%)
School enrollment - Private schools (%)
School enrollment - Not enrolled (%)
Median number of rooms in houses and condos
Median number of rooms in apartments
Housing units lacking complete plumbing facilities (%)
Housing units lacking complete kitchen facilities (%)
Density of houses
Urban houses (%)
Rural houses (%)
Households with people 60 years and over (%)
Households with people 65 years and over (%)
Households with people 75 years and over (%)
Households with one or more nonrelatives (%)
Households with no nonrelatives (%)
Population in households (%)
Family households (%)
Nonfamily households (%)
Population in families (%)
Family households with own children (%)
Median number of bedrooms in owner occupied houses
Mean number of bedrooms in owner occupied houses
Median number of bedrooms in renter occupied houses
Mean number of bedrooms in renter occupied houses
Median number of vehichles in owner occupied houses
Mean number of vehichles in owner occupied houses
Median number of vehichles in renter occupied houses
Mean number of vehichles in renter occupied houses
Mortgage status - with mortgage (%)
Mortgage status - with second mortgage (%)
Mortgage status - with home equity loan (%)
Mortgage status - with both second mortgage and home equity loan (%)
Mortgage status - without a mortgage (%)
Average family size
Average family size - White
Average family size - Black or African American
Average family size - Asian
Average family size - Hispanic or Latino
Average family size - American Indian and Alaska Native
Average family size - Multirace
Average family size - Other Race
Geographical mobility - Same house 1 year ago (%)
Geographical mobility - Moved within same county (%)
Geographical mobility - Moved from different county within same state (%)
Geographical mobility - Moved from different state (%)
Geographical mobility - Moved from abroad (%)
Place of birth - Born in state of residence (%)
Place of birth - Born in other state (%)
Place of birth - Native, outside of US (%)
Place of birth - Foreign born (%)
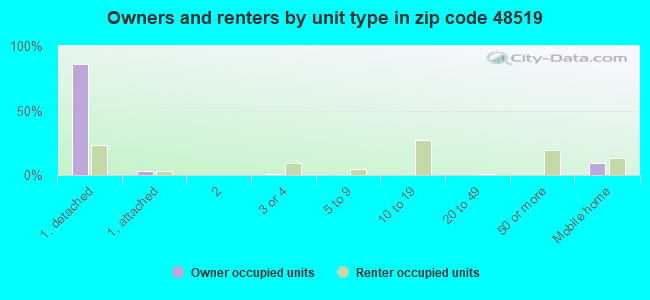
Housing units in structures - 1, detached (%)
Housing units in structures - 1, attached (%)
Housing units in structures - 2 (%)
Housing units in structures - 3 or 4 (%)
Housing units in structures - 5 to 9 (%)
Housing units in structures - 10 to 19 (%)
Housing units in structures - 20 to 49 (%)
Housing units in structures - 50 or more (%)
Housing units in structures - Mobile home (%)
Housing units in structures - Boat, RV, van, etc. (%)
House/condo owner moved in on average (years ago)
Renter moved in on average (years ago)
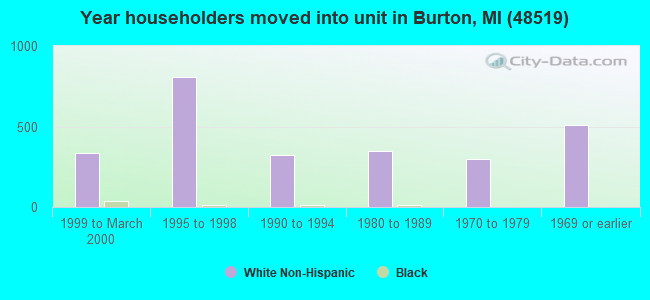
Year householder moved into unit - Moved in 1999 to March 2000 (%)
Year householder moved into unit - Moved in 1995 to 1998 (%)
Year householder moved into unit - Moved in 1990 to 1994 (%)
Year householder moved into unit - Moved in 1980 to 1989 (%)
Year householder moved into unit - Moved in 1970 to 1979 (%)
Year householder moved into unit - Moved in 1969 or earlier (%)
Means of transportation to work - Drove car alone (%)
Means of transportation to work - Carpooled (%)
Means of transportation to work - Public transportation (%)
Means of transportation to work - Bus or trolley bus (%)
Means of transportation to work - Streetcar or trolley car (%)
Means of transportation to work - Subway or elevated (%)
Means of transportation to work - Railroad (%)
Means of transportation to work - Ferryboat (%)
Means of transportation to work - Taxicab (%)
Means of transportation to work - Motorcycle (%)
Means of transportation to work - Bicycle (%)
Means of transportation to work - Walked (%)
Means of transportation to work - Other means (%)
Working at home (%)
Industry diversity
Most Common Industries - Agriculture, forestry, fishing and hunting, and mining (%)
Most Common Industries - Agriculture, forestry, fishing and hunting (%)
Most Common Industries - Mining, quarrying, and oil and gas extraction (%)
Most Common Industries - Construction (%)
Most Common Industries - Manufacturing (%)
Most Common Industries - Wholesale trade (%)
Most Common Industries - Retail trade (%)
Most Common Industries - Transportation and warehousing, and utilities (%)
Most Common Industries - Transportation and warehousing (%)
Most Common Industries - Utilities (%)
Most Common Industries - Information (%)
Most Common Industries - Finance and insurance, and real estate and rental and leasing (%)
Most Common Industries - Finance and insurance (%)
Most Common Industries - Real estate and rental and leasing (%)
Most Common Industries - Professional, scientific, and management, and administrative and waste management services (%)
Most Common Industries - Professional, scientific, and technical services (%)
Most Common Industries - Management of companies and enterprises (%)
Most Common Industries - Administrative and support and waste management services (%)
Most Common Industries - Educational services, and health care and social assistance (%)
Most Common Industries - Educational services (%)
Most Common Industries - Health care and social assistance (%)
Most Common Industries - Arts, entertainment, and recreation, and accommodation and food services (%)
Most Common Industries - Arts, entertainment, and recreation (%)
Most Common Industries - Accommodation and food services (%)
Most Common Industries - Other services, except public administration (%)
Most Common Industries - Public administration (%)
Occupation diversity
Most Common Occupations - Management, business, science, and arts occupations (%)
Most Common Occupations - Management, business, and financial occupations (%)
Most Common Occupations - Management occupations (%)
Most Common Occupations - Business and financial operations occupations (%)
Most Common Occupations - Computer, engineering, and science occupations (%)
Most Common Occupations - Computer and mathematical occupations (%)
Most Common Occupations - Architecture and engineering occupations (%)
Most Common Occupations - Life, physical, and social science occupations (%)
Most Common Occupations - Education, legal, community service, arts, and media occupations (%)
Most Common Occupations - Community and social service occupations (%)
Most Common Occupations - Legal occupations (%)
Most Common Occupations - Education, training, and library occupations (%)
Most Common Occupations - Arts, design, entertainment, sports, and media occupations (%)
Most Common Occupations - Healthcare practitioners and technical occupations (%)
Most Common Occupations - Health diagnosing and treating practitioners and other technical occupations (%)
Most Common Occupations - Health technologists and technicians (%)
Most Common Occupations - Service occupations (%)
Most Common Occupations - Healthcare support occupations (%)
Most Common Occupations - Protective service occupations (%)
Most Common Occupations - Fire fighting and prevention, and other protective service workers including supervisors (%)
Most Common Occupations - Law enforcement workers including supervisors (%)
Most Common Occupations - Food preparation and serving related occupations (%)
Most Common Occupations - Building and grounds cleaning and maintenance occupations (%)
Most Common Occupations - Personal care and service occupations (%)
Most Common Occupations - Sales and office occupations (%)
Most Common Occupations - Sales and related occupations (%)
Most Common Occupations - Office and administrative support occupations (%)
Most Common Occupations - Natural resources, construction, and maintenance occupations (%)
Most Common Occupations - Farming, fishing, and forestry occupations (%)
Most Common Occupations - Construction and extraction occupations (%)
Most Common Occupations - Installation, maintenance, and repair occupations (%)
Most Common Occupations - Production, transportation, and material moving occupations (%)
Most Common Occupations - Production occupations (%)
Most Common Occupations - Transportation occupations (%)
Most Common Occupations - Material moving occupations (%)
People in Group quarters - Institutionalized population (%)
People in Group quarters - Correctional institutions (%)
People in Group quarters - Federal prisons and detention centers (%)
People in Group quarters - Halfway houses (%)
People in Group quarters - Local jails and other confinement facilities (including police lockups) (%)
People in Group quarters - Military disciplinary barracks (%)
People in Group quarters - State prisons (%)
People in Group quarters - Other types of correctional institutions (%)
People in Group quarters - Nursing homes (%)
People in Group quarters - Hospitals/wards, hospices, and schools for the handicapped (%)
People in Group quarters - Hospitals/wards and hospices for chronically ill (%)
People in Group quarters - Hospices or homes for chronically ill (%)
People in Group quarters - Military hospitals or wards for chronically ill (%)
People in Group quarters - Other hospitals or wards for chronically ill (%)
People in Group quarters - Hospitals or wards for drug/alcohol abuse (%)
People in Group quarters - Mental (Psychiatric) hospitals or wards (%)
People in Group quarters - Schools, hospitals, or wards for the mentally retarded (%)
People in Group quarters - Schools, hospitals, or wards for the physically handicapped (%)
People in Group quarters - Institutions for the deaf (%)
People in Group quarters - Institutions for the blind (%)
People in Group quarters - Orthopedic wards and institutions for the physically handicapped (%)
People in Group quarters - Wards in general hospitals for patients who have no usual home elsewhere (%)
People in Group quarters - Wards in military hospitals for patients who have no usual home elsewhere (%)
People in Group quarters - Juvenile institutions (%)
People in Group quarters - Long-term care (%)
People in Group quarters - Homes for abused, dependent, and neglected children (%)
People in Group quarters - Residential treatment centers for emotionally disturbed children (%)
People in Group quarters - Training schools for juvenile delinquents (%)
People in Group quarters - Short-term care, detention or diagnostic centers for delinquent children (%)
People in Group quarters - Type of juvenile institution unknown (%)
People in Group quarters - Noninstitutionalized population (%)
People in Group quarters - College dormitories (includes college quarters off campus) (%)
People in Group quarters - Military quarters (%)
People in Group quarters - On base (%)
People in Group quarters - Barracks, unaccompanied personnel housing (UPH), (Enlisted/Officer), ;and similar group living quarters for military personnel (%)
People in Group quarters - Transient quarters for temporary residents (%)
People in Group quarters - Military ships (%)
People in Group quarters - Group homes (%)
People in Group quarters - Homes or halfway houses for drug/alcohol abuse (%)
People in Group quarters - Homes for the mentally ill (%)
People in Group quarters - Homes for the mentally retarded (%)
People in Group quarters - Homes for the physically handicapped (%)
People in Group quarters - Other group homes (%)
People in Group quarters - Religious group quarters (%)
People in Group quarters - Dormitories (%)
People in Group quarters - Agriculture workers' dormitories on farms (%)
People in Group quarters - Job Corps and vocational training facilities (%)
People in Group quarters - Other workers' dormitories (%)
People in Group quarters - Crews of maritime vessels (%)
People in Group quarters - Other nonhousehold living situations (%)
People in Group quarters - Other noninstitutional group quarters (%)
Residents speaking English at home (%)
Residents speaking English at home - Born in the United States (%)
Residents speaking English at home - Native, born elsewhere (%)
Residents speaking English at home - Foreign born (%)
Residents speaking Spanish at home (%)
Residents speaking Spanish at home - Born in the United States (%)
Residents speaking Spanish at home - Native, born elsewhere (%)
Residents speaking Spanish at home - Foreign born (%)
Residents speaking other language at home (%)
Residents speaking other language at home - Born in the United States (%)
Residents speaking other language at home - Native, born elsewhere (%)
Residents speaking other language at home - Foreign born (%)
Class of Workers - Employee of private company (%)
Class of Workers - Self-employed in own incorporated business (%)
Class of Workers - Private not-for-profit wage and salary workers (%)
Class of Workers - Local government workers (%)
Class of Workers - State government workers (%)
Class of Workers - Federal government workers (%)
Class of Workers - Self-employed workers in own not incorporated business and Unpaid family workers (%)
House heating fuel used in houses and condos - Utility gas (%)
House heating fuel used in houses and condos - Bottled, tank, or LP gas (%)
House heating fuel used in houses and condos - Electricity (%)
House heating fuel used in houses and condos - Fuel oil, kerosene, etc. (%)
House heating fuel used in houses and condos - Coal or coke (%)
House heating fuel used in houses and condos - Wood (%)
House heating fuel used in houses and condos - Solar energy (%)
House heating fuel used in houses and condos - Other fuel (%)
House heating fuel used in houses and condos - No fuel used (%)
House heating fuel used in apartments - Utility gas (%)
House heating fuel used in apartments - Bottled, tank, or LP gas (%)
House heating fuel used in apartments - Electricity (%)
House heating fuel used in apartments - Fuel oil, kerosene, etc. (%)
House heating fuel used in apartments - Coal or coke (%)
House heating fuel used in apartments - Wood (%)
House heating fuel used in apartments - Solar energy (%)
House heating fuel used in apartments - Other fuel (%)
House heating fuel used in apartments - No fuel used (%)
Armed forces status - In Armed Forces (%)
Armed forces status - Civilian (%)
Armed forces status - Civilian - Veteran (%)
Armed forces status - Civilian - Nonveteran (%)
Fatal accidents locations in years 2005-2021
Fatal accidents locations in 2005
Fatal accidents locations in 2006
Fatal accidents locations in 2007
Fatal accidents locations in 2008
Fatal accidents locations in 2009
Fatal accidents locations in 2010
Fatal accidents locations in 2011
Fatal accidents locations in 2012
Fatal accidents locations in 2013
Fatal accidents locations in 2014
Fatal accidents locations in 2015
Fatal accidents locations in 2016
Fatal accidents locations in 2017
Fatal accidents locations in 2018
Fatal accidents locations in 2019
Fatal accidents locations in 2020
Fatal accidents locations in 2021
Alcohol use - People drinking some alcohol every month (%)
Alcohol use - People not drinking at all (%)
Alcohol use - Average days/month drinking alcohol
Alcohol use - Average drinks/week
Alcohol use - Average days/year people drink much
Audiometry - Average condition of hearing (%)
Audiometry - People that can hear a whisper from across a quiet room (%)
Audiometry - People that can hear normal voice from across a quiet room (%)
Audiometry - Ears ringing, roaring, buzzing (%)
Audiometry - Had a job exposure to loud noise (%)
Audiometry - Had off-work exposure to loud noise (%)
Blood Pressure & Cholesterol - Has high blood pressure (%)
Blood Pressure & Cholesterol - Checking blood pressure at home (%)
Blood Pressure & Cholesterol - Frequently checking blood cholesterol (%)
Blood Pressure & Cholesterol - Has high cholesterol level (%)
Consumer Behavior - Money monthly spent on food at supermarket/grocery store
Consumer Behavior - Money monthly spent on food at other stores
Consumer Behavior - Money monthly spent on eating out
Consumer Behavior - Money monthly spent on carryout/delivered foods
Consumer Behavior - Income spent on food at supermarket/grocery store (%)
Consumer Behavior - Income spent on food at other stores (%)
Consumer Behavior - Income spent on eating out (%)
Consumer Behavior - Income spent on carryout/delivered foods (%)
Current Health Status - General health condition (%)
Current Health Status - Blood donors (%)
Current Health Status - Has blood ever tested for HIV virus (%)
Current Health Status - Left-handed people (%)
Dermatology - People using sunscreen (%)
Diabetes - Diabetics (%)
Diabetes - Had a blood test for high blood sugar (%)
Diabetes - People taking insulin (%)
Diet Behavior & Nutrition - Diet health (%)
Diet Behavior & Nutrition - Milk product consumption (# of products/month)
Diet Behavior & Nutrition - Meals not home prepared (#/week)
Diet Behavior & Nutrition - Meals from fast food or pizza place (#/week)
Diet Behavior & Nutrition - Ready-to-eat foods (#/month)
Diet Behavior & Nutrition - Frozen meals/pizza (#/month)
Drug Use - People that ever used marijuana or hashish (%)
Drug Use - Ever used hard drugs (%)
Drug Use - Ever used any form of cocaine (%)
Drug Use - Ever used heroin (%)
Drug Use - Ever used methamphetamine (%)
Health Insurance - People covered by health insurance (%)
Kidney Conditions-Urology - Avg. # of times urinating at night
Medical Conditions - People with asthma (%)
Medical Conditions - People with anemia (%)
Medical Conditions - People with psoriasis (%)
Medical Conditions - People with overweight (%)
Medical Conditions - Elderly people having difficulties in thinking or remembering (%)
Medical Conditions - People who ever received blood transfusion (%)
Medical Conditions - People having trouble seeing even with glass/contacts (%)
Medical Conditions - People with arthritis (%)
Medical Conditions - People with gout (%)
Medical Conditions - People with congestive heart failure (%)
Medical Conditions - People with coronary heart disease (%)
Medical Conditions - People with angina pectoris (%)
Medical Conditions - People who ever had heart attack (%)
Medical Conditions - People who ever had stroke (%)
Medical Conditions - People with emphysema (%)
Medical Conditions - People with thyroid problem (%)
Medical Conditions - People with chronic bronchitis (%)
Medical Conditions - People with any liver condition (%)
Medical Conditions - People who ever had cancer or malignancy (%)
Mental Health - People who have little interest in doing things (%)
Mental Health - People feeling down, depressed, or hopeless (%)
Mental Health - People who have trouble sleeping or sleeping too much (%)
Mental Health - People feeling tired or having little energy (%)
Mental Health - People with poor appetite or overeating (%)
Mental Health - People feeling bad about themself (%)
Mental Health - People who have trouble concentrating on things (%)
Mental Health - People moving or speaking slowly or too fast (%)
Mental Health - People having thoughts they would be better off dead (%)
Oral Health - Average years since last visit a dentist
Oral Health - People embarrassed because of mouth (%)
Oral Health - People with gum disease (%)
Oral Health - General health of teeth and gums (%)
Oral Health - Average days a week using dental floss/device
Oral Health - Average days a week using mouthwash for dental problem
Oral Health - Average number of teeth
Pesticide Use - Households using pesticides to control insects (%)
Pesticide Use - Households using pesticides to kill weeds (%)
Physical Activity - People doing vigorous-intensity work activities (%)
Physical Activity - People doing moderate-intensity work activities (%)
Physical Activity - People walking or bicycling (%)
Physical Activity - People doing vigorous-intensity recreational activities (%)
Physical Activity - People doing moderate-intensity recreational activities (%)
Physical Activity - Average hours a day doing sedentary activities
Physical Activity - Average hours a day watching TV or videos
Physical Activity - Average hours a day using computer
Physical Functioning - People having limitations keeping them from working (%)
Physical Functioning - People limited in amount of work they can do (%)
Physical Functioning - People that need special equipment to walk (%)
Physical Functioning - People experiencing confusion/memory problems (%)
Physical Functioning - People requiring special healthcare equipment (%)
Prescription Medications - Average number of prescription medicines taking
Preventive Aspirin Use - Adults 40+ taking low-dose aspirin (%)
Reproductive Health - Vaginal deliveries (%)
Reproductive Health - Cesarean deliveries (%)
Reproductive Health - Deliveries resulted in a live birth (%)
Reproductive Health - Pregnancies resulted in a delivery (%)
Reproductive Health - Women breastfeeding newborns (%)
Reproductive Health - Women that had a hysterectomy (%)
Reproductive Health - Women that had both ovaries removed (%)
Reproductive Health - Women that have ever taken birth control pills (%)
Reproductive Health - Women taking birth control pills (%)
Reproductive Health - Women that have ever used Depo-Provera or injectables (%)
Reproductive Health - Women that have ever used female hormones (%)
Sexual Behavior - People 18+ that ever had sex (vaginal, anal, or oral) (%)
Sexual Behavior - Males 18+ that ever had vaginal sex with a woman (%)
Sexual Behavior - Males 18+ that ever performed oral sex on a woman (%)
Sexual Behavior - Males 18+ that ever had anal sex with a woman (%)
Sexual Behavior - Males 18+ that ever had any sex with a man (%)
Sexual Behavior - Females 18+ that ever had vaginal sex with a man (%)
Sexual Behavior - Females 18+ that ever performed oral sex on a man (%)
Sexual Behavior - Females 18+ that ever had anal sex with a man (%)
Sexual Behavior - Females 18+ that ever had any kind of sex with a woman (%)
Sexual Behavior - Average age people first had sex
Sexual Behavior - Average number of female sex partners in lifetime (males 18+)
Sexual Behavior - Average number of female vaginal sex partners in lifetime (males 18+)
Sexual Behavior - Average age people first performed oral sex on a woman (18+)
Sexual Behavior - Average number of woman performed oral sex on in lifetime (18+)
Sexual Behavior - Average number of male sex partners in lifetime (males 18+)
Sexual Behavior - Average number of male anal sex partners in lifetime (males 18+)
Sexual Behavior - Average age people first performed oral sex on a man (18+)
Sexual Behavior - Average number of male oral sex partners in lifetime (18+)
Sexual Behavior - People using protection when performing oral sex (%)
Sexual Behavior - Average number of times people have vaginal or anal sex a year
Sexual Behavior - People having sex without condom (%)
Sexual Behavior - Average number of male sex partners in lifetime (females 18+)
Sexual Behavior - Average number of male vaginal sex partners in lifetime (females 18+)
Sexual Behavior - Average number of female sex partners in lifetime (females 18+)
Sexual Behavior - Circumcised males 18+ (%)
Sleep Disorders - Average hours sleeping at night
Sleep Disorders - People that has trouble sleeping (%)
Smoking-Cigarette Use - People smoking cigarettes (%)
Taste & Smell - People 40+ having problems with smell (%)
Taste & Smell - People 40+ having problems with taste (%)
Taste & Smell - People 40+ that ever had wisdom teeth removed (%)
Taste & Smell - People 40+ that ever had tonsils teeth removed (%)
Taste & Smell - People 40+ that ever had a loss of consciousness because of a head injury (%)
Taste & Smell - People 40+ that ever had a broken nose or other serious injury to face or skull (%)
Taste & Smell - People 40+ that ever had two or more sinus infections (%)
Weight - Average height (inches)
Weight - Average weight (pounds)
Weight - Average BMI
Weight - People that are obese (%)
Weight - People that ever were obese (%)
Weight - People trying to lose weight (%)
100%
urban population.
Estimated median house/condo value in 2022: $161,800
48519:
$161,800Michigan:
$224,400
Median resident age: This zip code:
39.0 yearsMichigan median age:
40.3 years
Average household size: This zip code:
2.4 peopleMichigan:
2.4 people
Averages for the 2020 tax year for zip code 48519, filed in 2021:
Average Adjusted Gross Income (AGI) in 2020: $43,920 (Individual Income Tax Returns) Here:
$43,920State:
$68,945
Salary/wage: $40,497 (reported on 75.9% of returns )Here:
$40,497State:
$57,142
(% of AGI for various income ranges: 872.5% for AGIs below $25k , 3000.2% for AGIs $25k-50k , 5845.7% for AGIs $50k-75k , 8852.7% for AGIs $75k-100k , 15141.4% for AGIs $100k-200k ) Taxable interest for individuals: $457 (reported on 23.8% of returns )This zip code:
$457Michigan:
$1,630
(% of AGI for various income ranges: 9.4% for AGIs below $25k , 11.3% for AGIs $25k-50k , 15.9% for AGIs $50k-75k , 18.5% for AGIs $75k-100k , 45.9% for AGIs $100k-200k ) Ordinary dividends: $2,868 (reported on 9.4% of returns )(% of AGI for various income ranges: 12.9% for AGIs below $25k , 15.1% for AGIs $25k-50k , 27.8% for AGIs $50k-75k , 73.8% for AGIs $75k-100k , 216.4% for AGIs $100k-200k ) Net capital gain/loss in AGI: +$2,559 (reported on 9.2% of returns )Here:
+$2,559State:
+$20,064
(% of AGI for various income ranges: 8.6% for AGIs $25k-50k , 28.6% for AGIs $50k-75k , 92.7% for AGIs $75k-100k , 231.8% for AGIs $100k-200k ) Profit/loss from business: +$5,025 (reported on 13.2% of returns )Here:
+$5,025State:
+$11,172
(% of AGI for various income ranges: 65.2% for AGIs below $25k , 53.9% for AGIs $25k-50k , 102.9% for AGIs $50k-75k , 111.2% for AGIs $75k-100k , 293.2% for AGIs $100k-200k ) Taxable individual retirement arrangement distribution: $12,685 (reported on 6.7% of returns )48519:
$12,685Michigan:
$19,803
(% of AGI for various income ranges: 46.6% for AGIs below $25k , 48.9% for AGIs $25k-50k , 120.6% for AGIs $50k-75k , 292.7% for AGIs $75k-100k , 497.7% for AGIs $100k-200k ) Total itemized deductions: $25,450 (reported on 2.5% of returns )Here:
$25,450State:
$34,117
(% of AGI for various income ranges: 51.3% for AGIs below $25k , 116.7% for AGIs $50k-75k , 175.8% for AGIs $75k-100k , 441.8% for AGIs $100k-200k ) Charity contributions: $8,350 (reported on 2.0% of returns )(% of AGI for various income ranges: 60.2% for AGIs $50k-75k , 169.5% for AGIs $100k-200k ) Taxes paid: $6,680 (reported on 2.5% of returns )(% of AGI for various income ranges: 9.6% for AGIs below $25k , 27.1% for AGIs $50k-75k , 57.3% for AGIs $75k-100k , 129.1% for AGIs $100k-200k ) Earned income credit: $2,079 (reported on 16.9% of returns )(% of AGI for various income ranges: 76.4% for AGIs below $25k , 61.0% for AGIs $25k-50k ) Percentage of individuals using paid preparers for their 2020 taxes: 94.3%(% for various income ranges: 92.7% for AGIs below $25k , 95.0% for AGIs $25k-50k , 95.3% for AGIs $50k-75k , 94.4% for AGIs $75k-100k , 96.7% for AGIs $100k-200k , 100.0% for AGIs over 200k )
Averages for the 2012 tax year for zip code 48519, filed in 2013:
Average Adjusted Gross Income (AGI) in 2012: $36,843 (Individual Income Tax Returns) Here:
$36,843State:
$55,609
Salary/wage: $30,889 (reported on 82.8% of returns )Here:
$30,889State:
$46,782
(% of AGI for various income ranges: 59.5% for AGIs below $25k , 67.4% for AGIs $25k-50k , 73.9% for AGIs $50k-75k , 76.5% for AGIs $75k-100k , 68.4% for AGIs $100k-200k ) Taxable interest for individuals: $545 (reported on 26.0% of returns )This zip code:
$545Michigan:
$1,491
(% of AGI for various income ranges: 0.8% for AGIs below $25k , 0.4% for AGIs $25k-50k , 0.3% for AGIs $50k-75k , 0.1% for AGIs $75k-100k , 0.3% for AGIs $100k-200k ) Ordinary dividends: $1,915 (reported on 10.3% of returns )(% of AGI for various income ranges: 0.7% for AGIs below $25k , 0.5% for AGIs $25k-50k , 0.8% for AGIs $50k-75k , 0.2% for AGIs $75k-100k , 0.4% for AGIs $100k-200k ) Profit/loss from business: +$7,061 (reported on 13.0% of returns )Here:
+$7,061State:
+$11,523
(% of AGI for various income ranges: 7.7% for AGIs below $25k , 1.4% for AGIs $25k-50k , 0.9% for AGIs $50k-75k , 0.9% for AGIs $75k-100k , 3.0% for AGIs $100k-200k ) Taxable individual retirement arrangement distribution: $9,777 (reported on 8.2% of returns )48519:
$9,777Michigan:
$15,298
(% of AGI for various income ranges: 1.9% for AGIs below $25k , 1.7% for AGIs $25k-50k , 2.1% for AGIs $50k-75k , 2.7% for AGIs $75k-100k , 2.8% for AGIs $100k-200k ) Total itemized deductions: $15,107 (23% of AGI, reported on 21.5% of returns )Here:
$15,107State:
$21,628
Here:
22.6% of AGIState:
18.4% of AGI
(% of AGI for various income ranges: 5.7% for AGIs below $25k , 7.1% for AGIs $25k-50k , 9.1% for AGIs $50k-75k , 10.2% for AGIs $75k-100k , 12.2% for AGIs $100k-200k ) Charity contributions: $3,071 (reported on 16.7% of returns )(% of AGI for various income ranges: 0.7% for AGIs below $25k , 1.0% for AGIs $25k-50k , 1.4% for AGIs $50k-75k , 1.7% for AGIs $75k-100k , 2.3% for AGIs $100k-200k ) Taxes paid: $4,619 (reported on 21.5% of returns )(% of AGI for various income ranges: 1.1% for AGIs below $25k , 1.9% for AGIs $25k-50k , 2.7% for AGIs $50k-75k , 3.5% for AGIs $75k-100k , 4.6% for AGIs $100k-200k ) Earned income credit: $2,243 (reported on 21.5% of returns )(% of AGI for various income ranges: 6.5% for AGIs below $25k , 1.1% for AGIs $25k-50k ) Percentage of individuals using paid preparers for their 2012 taxes: 59.7%(% for various income ranges: 56.7% for AGIs below $25k , 58.8% for AGIs $25k-50k , 66.7% for AGIs $50k-75k , 63.0% for AGIs $75k-100k , 68.4% for AGIs $100k-200k )
Averages for the 2004 tax year for zip code 48519, filed in 2005:
Average Adjusted Gross Income (AGI) in 2004: $37,739 (Individual Income Tax Returns) Here:
$37,739State:
$48,204
Salary/wage: $34,672 (reported on 86.6% of returns )Here:
$34,672State:
$42,791
(% of AGI for various income ranges: 75.1% for AGIs below $10k , 59.8% for AGIs $10k-25k , 76.2% for AGIs $25k-50k , 86.9% for AGIs $50k-75k , 88.0% for AGIs $75k-100k , 77.9% for AGIs over 100k ) Taxable interest for individuals: $909 (reported on 41.0% of returns )This zip code:
$909Michigan:
$1,725
(% of AGI for various income ranges: 3.0% for AGIs below $10k , 2.4% for AGIs $10k-25k , 1.0% for AGIs $25k-50k , 0.8% for AGIs $50k-75k , 0.3% for AGIs $75k-100k , 0.8% for AGIs over 100k ) Taxable dividends: $1,253 (reported on 18.3% of returns )(% of AGI for various income ranges: 2.1% for AGIs below $10k , 1.3% for AGIs $10k-25k , 0.6% for AGIs $25k-50k , 0.6% for AGIs $50k-75k , 0.2% for AGIs $75k-100k , 0.4% for AGIs over 100k ) Net capital gain/loss: +$2,835 (reported on 10.5% of returns )Here:
+$2,835State:
+$8,532
(% of AGI for various income ranges: -1.5% for AGIs below $10k , 0.6% for AGIs $10k-25k , -0.1% for AGIs $25k-50k , -0.0% for AGIs $50k-75k , 0.4% for AGIs $75k-100k , 4.3% for AGIs over 100k ) Profit/loss from business: +$4,143 (reported on 13.5% of returns )Here:
+$4,143State:
+$9,547
(% of AGI for various income ranges: 3.4% for AGIs below $10k , 4.7% for AGIs $10k-25k , 1.5% for AGIs $25k-50k , 1.5% for AGIs $50k-75k , 0.2% for AGIs $75k-100k , 0.4% for AGIs over 100k ) IRA payment deduction: $2,375 (reported on 1.1% of returns )48519:
$2,375Michigan:
$2,875
Total itemized deductions: $14,579 (23% of AGI, reported on 33.2% of returns )Here:
$14,579State:
$18,509
Here:
23.1% of AGIState:
20.7% of AGI
(% of AGI for various income ranges: 7.0% for AGIs below $10k , 10.1% for AGIs $10k-25k , 12.2% for AGIs $25k-50k , 14.1% for AGIs $50k-75k , 14.5% for AGIs $75k-100k , 12.5% for AGIs over 100k ) Charity contributions deductions: $2,452 (4% of AGI, reported on 29.4% of returns )Here:
3.8% of AGIState:
3.6% of AGI
(% of AGI for various income ranges: 0.5% for AGIs below $10k , 1.5% for AGIs $10k-25k , 1.6% for AGIs $25k-50k , 2.0% for AGIs $50k-75k , 2.4% for AGIs $75k-100k , 2.2% for AGIs over 100k ) Total tax: $4,428 (reported on 76.3% of returns )(% of AGI for various income ranges: 2.2% for AGIs below $10k , 4.1% for AGIs $10k-25k , 6.4% for AGIs $25k-50k , 9.0% for AGIs $50k-75k , 10.6% for AGIs $75k-100k , 15.0% for AGIs over 100k ) Earned income credit: $1,693 (reported on 14.5% of returns )Percentage of individuals using paid preparers for their 2004 taxes: 65.5%(% for various income ranges: 56.8% for AGIs below $10k , 67.0% for AGIs $10k-25k , 67.1% for AGIs $25k-50k , 66.7% for AGIs $50k-75k , 69.4% for AGIs $75k-100k , 74.7% for AGIs over 100k )
Estimated median household income in 2022: This zip code:
$59,376Michigan:
$66,986
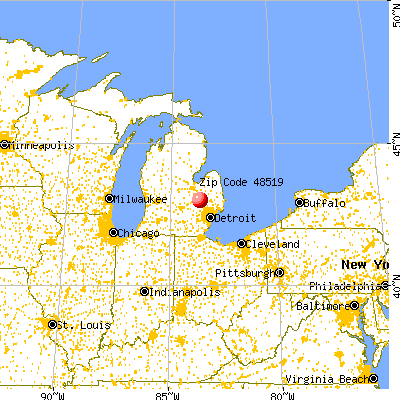
Nearest zip codes: 48509 ,
48529 ,
48439 ,
48506 ,
48502 ,
48411 .
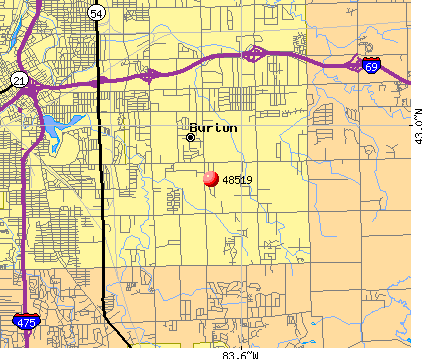
Burton Zip Code Map
Percentage of family households: This zip code:
37.6%Michigan:
43.3%
Percentage of households with unmarried partners: This zip code:
5.8%Michigan:
45.7%
Likely homosexual households (counted as self-reported same-sex unmarried-partner households)
Lesbian couples: 0.2% of all households Gay men: 0.0% of all households
Household received Food Stamps/SNAP in the past 12 months: 604Household did not receive Food Stamps/SNAP in the past 12 months: 2,973
Women who had a birth in the past 12 months: 180 (56 now married , 119 unmarried) Women who did not have a birth in the past 12 months: 1,817 (503 now married , 1,318 unmarried)
Housing units in zip code 48519 with a mortgage: 1,513 (58
second mortgage , 11
home equity loan , 39
both second mortgage and home equity loan )
Houses without a mortgage: 35
Median monthly owner costs for units with a mortgage: $1,249
Median monthly owner costs for units without a mortgage: $537
Residents with income below the poverty level in 2022:
This zip code:
9.4%Whole state:
13.4%
Residents with income below 50% of the poverty level in 2022:
This zip code:
5.8%Whole state:
6.9%
Median number of rooms in houses and condos: Median number of rooms in apartments: Notable locations in this zip code not listed on our city pages
Click to draw/clear zip code borders Notable location: (A) . Display/hide its location on the map
Churches in zip code 48519 include: (A) , Hilltop Church (B) , Saint Nicholas Church (C) , Atherton United Methodist Church (D) , New Testament General Baptist Church (E) , Harmony Baptist Church (F) , Beaulah Land Christian Church (G) , Pilgrim Lutheran Church (H) , Solid Rock Baptist Church (I) . Display/hide their locations on the map
Cemetery: (1) . Display/hide its location on the map
Streams, rivers, and creeks: (A) . Display/hide its location on the map
Year house built (houses)
38 2020 or later203 2010 to 2019571 2000 to 2009519 1990 to 1999365 1980 to 1989454 1970 to 1979397 1960 to 1969632 1950 to 1959297 1940 to 1949173 1939 or earlier
Zip code 48519 household income distribution in 2022 118 Less than $10,000144 $10,000 to $14,99983 $15,000 to $19,999139 $20,000 to $24,999413 $25,000 to $29,99976 $30,000 to $34,999108 $35,000 to $39,999298 $40,000 to $44,999125 $45,000 to $49,999223 $50,000 to $59,999443 $60,000 to $74,999541 $75,000 to $99,999313 $100,000 to $124,999135 $125,000 to $149,999319 $150,000 to $199,99968 $200,000 or moreEstimate of home value of owner-occupied houses/condos in 2022 in zip code 48519 21 Less than $10,00051 $10,000 to $14,99910 $15,000 to $19,99972 $20,000 to $24,99920 $25,000 to $29,9999 $30,000 to $34,999125 $40,000 to $49,99950 $50,000 to $59,99910 $60,000 to $69,99917 $70,000 to $79,999152 $80,000 to $89,99963 $90,000 to $99,999304 $100,000 to $124,999182 $125,000 to $149,999384 $150,000 to $174,999422 $175,000 to $199,999168 $200,000 to $249,99947 $250,000 to $299,9999 $300,000 to $399,99983 $400,000 to $499,9991 $500,000 to $749,9999 $1,000,000 to $1,499,9999 $2,000,000 or moreRent paid by renters in 2022 in zip code 48519 33 $150 to $19931 $200 to $24939 $300 to $3499 $350 to $39924 $400 to $44927 $450 to $499121 $500 to $549197 $550 to $5996 $600 to $6496 $700 to $74955 $750 to $79975 $800 to $899139 $900 to $999193 $1,000 to $1,24927 $1,250 to $1,49917 $2,000 to $2,4999 $2,500 to $2,99933 No cash rent
Median gross rent in 2022: $860.
Estimated median house (or condo) value in 2022 for: White Non-Hispanic householders: $167,218Black or African American householders: $193,935Asian householders: $256,899Two or more races householders: $102,759Hispanic or Latino householders: $158,810Estimated median house or condo value in 2022: $161,800
48519:
$161,800Michigan:
$224,400
Lower value quartile - upper value quartile: $99,624 - $205,219
Mean price in 2022: Detached houses: $188,085Here:
$188,085State:
$280,038
Townhouses or other attached units: $189,501Here:
$189,501State:
$239,520
In 2-unit structures: $138,838Here:
$138,838State:
$219,481
In 3-to-4-unit structures: $149,011Here:
$149,011State:
$207,067
In 5-or-more-unit structures: $92,797Here:
$92,797State:
$192,733
Mobile homes: $47,804Here:
$47,804State:
$72,868
Housing units in structures:
One, detached: 2,412One, attached: 1263 or 4: 1215 to 9: 4810 to 19: 34420 to 49: 950 or more: 216Mobile homes: 399Unemployment : 4.6%
Means of transportation to work in zip code 48519 77.7% 3,177 Drove a car alone11.0% 450 Carpooled0.4% 15 Ferryboat1.2% 48 Taxi0.6% 24 Walked1.1% 44 Other means6.3% 257 Worked at homeTravel time to work (commute) in zip code 48519 69 Less than 5 minutes275 5 to 9 minutes707 10 to 14 minutes830 15 to 19 minutes610 20 to 24 minutes135 25 to 29 minutes502 30 to 34 minutes59 35 to 39 minutes86 40 to 44 minutes186 45 to 59 minutes108 60 to 89 minutes173 90 or more minutes
Percentage of zip code residents living and working in this county: 83.4%
Household type by relationship:
Households: 8,556
Male householders: 1,672 (527 living alone ), Female householders: 1,899 (688 living alone )1,297 spouses (1,276 opposite-sex spouses ), 470 unmarried partners , (431 opposite-sex unmarried partners ), 2,410 children (2,102 natural , 124 adopted , 181 stepchildren ), 258 grandchildren , 41 brothers or sisters , 137 parents , 0 foster children , 40 other relatives , 339 non-relatives In group quarters: 5 (-1 institutionalized population )
Size of family households: 962 2-persons , 479 3-persons , 343 4-persons , 153 5-persons , 81 6-persons , 67 7-or-more-persons
Size of nonfamily households: 1,216 1-person , 241 2-persons , 24 5-persons
875 married couples with children. single-parent households (264 men , 327 women ).
98.3% of residents of 48519 zip code speak English at home. of residents speak Spanish at home (37% very well, 63% well ).of residents speak other Indo-European language at home (100% very well ).
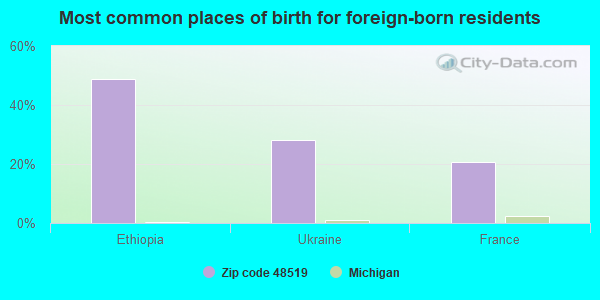
Foreign born population: 39 (0.5%)
(100.0%
of them are naturalized citizens )
This zip code:
0.5%Whole state:
6.9%
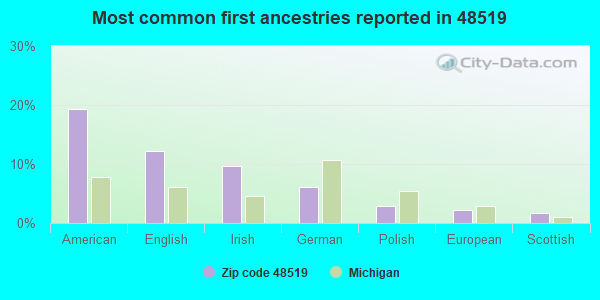
49% Ethiopia 28% Ukraine 21% France 19% American 12% English 10% Irish 6% German 3% Polish 2% European 2% Scottish
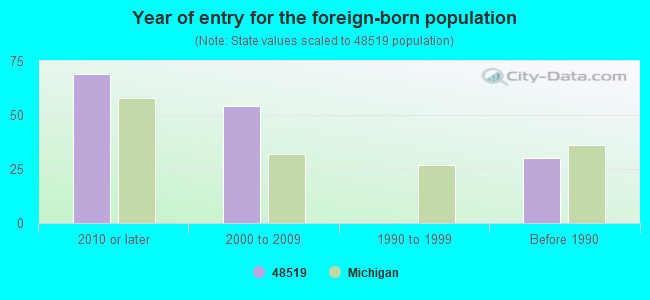
Year of entry for the foreign-born population
69 2010 or later 54 2000 to 2009 0 1990 to 1999 30 Before 1990
Facilities with environmental interests located in this zip code:
ATHERTON HIGH SCHOOL (3354 S. GENESEE ROAD in BURTON, MI)
(National Center for Education Statistics) - STATE ID-00138 Organizations: ATHERTON COMMUNITY SCHOOLS (SCHOOL DISTRICT)
ATHERTON MIDDLE SCHOOL (3444 S. GENESEE ROAD in BURTON, MI)
(National Center for Education Statistics) - STATE ID-00139 Organizations: ATHERTON COMMUNITY SCHOOLS (SCHOOL DISTRICT)
CHILD'S WORLD (4140 MANOR in BURTON, MI)
(Integrated Compliance Information System) - ICIS-05-1998-0729, FORMAL ENFORCEMENT ACTION Business SIC classification: CHILD DAY CARE SERVICES
ABC INC (4244 E BRISTOL RD in BURTON, MI)
Conditionally Exempt Small Quantity Generators, less than 100 kg/month of hazardous waste (Resource Conservation and Recovery Act (tracking hazardous waste)) Organizations: RADIO DISNEY WFDF (CONTACT/OPERATOR)
ATHERTON SCHOOLS (CLARICE 1/4 MILE FR CENTER RD in BURTON, MI)
(Resource Conservation and Recovery Act (tracking hazardous waste))
METAL CLEANUP LTD (3423 KLIENPELL in BURTON, MI)
(Resource Conservation and Recovery Act (tracking hazardous waste))
FRENCHY TIRE AND AUTO SVC (G3437 S DORT HWY in BURTON, MI)
(Resource Conservation and Recovery Act (tracking hazardous waste)) Business NAICS classification: GENERAL AUTOMOTIVE REPAIR.
MEIJER STORES LIMITED PARTNERSHIP (G2333 S CENTER RD in BURTON, MI)
Conditionally Exempt Small Quantity Generators, less than 100 kg/month of hazardous waste (Resource Conservation and Recovery Act (tracking hazardous waste)) Organizations: MEIJER INC (CONTACT/OPERATOR)
Alternative names: MEIJER GAS STATION 29
ATHEATON COMMUNITY SCHOOLS (335 S. GENESSEE RD. in BURTON, MI)
COMPLIANCE ACTIVITY (Tracking inspections of insecticide, fungicide, and rodenticide, and toxic substances)
Housing units lacking complete plumbing facilities: 0.5%
Housing units lacking complete kitchen facilities: 0.6%
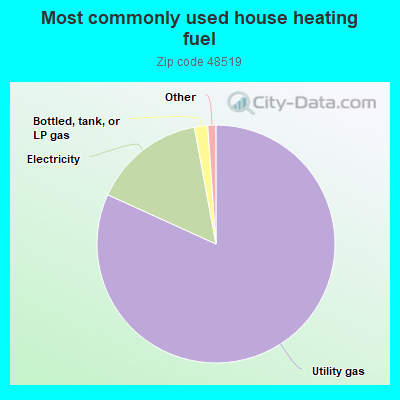
81.8% Utility gas 15.3% Electricity 1.8% Bottled, tank, or LP gas 0.6% Wood 0.6% Other fuel
Population in 1990: 6,081. Population change in the 1990s: +986 (+16.2%).
Place of birth for U.S.-born residents:
This state: 7,393Northeast: 58Midwest: 244South: 578West: 110
62% of the 48519 zip code residents lived in the same house 5 years ago.
Out of people who lived in different houses, 67% lived in this county.
Out of people who lived in different counties, 50% lived in Michigan.
85% of the 48519 zip code residents lived in the same house 1 year ago.
Out of people who lived in different houses, 80% moved from this county.
Out of people who lived in different houses, 9% moved from different county within same state.
Out of people who lived in different houses, 5% moved from different state.
Out of people who lived in different houses, 1% moved from abroad.
Private vs. public school enrollment:
Students in private schools in grades 1 to 8 (elementary and middle school): 91
Students in private schools in grades 9 to 12 (high school): 25
Students in private undergraduate colleges: 25
Occupation by median earnings in the past 12 months ($)
100,630 Architecture and engineering occupations 85,492 Computer and mathematical occupations 82,715 Health diagnosing and treating practitioners and other technical occupations 71,699 Business and financial operations occupations 68,138 Community and social service occupations 55,744 Production occupations
Top industries in this zip code by the number of employees in 2005:
Administrative and Support and Waste Management and Remediation Services: Janitorial Services (100-249 employees: 1 establishment, 1-4 employees: 2 establishments)Accommodation and Food Services: Limited-Service Restaurants (50-99: 2, 5-9: 1)Health Care and Social Assistance: Offices of Dentists (50-99: 1, 5-9: 4)Finance and Insurance: Credit Unions (50-99: 1)Professional, Scientific, and Technical Services: Testing Laboratories (50-99: 1)Accommodation and Food Services: Full-Service Restaurants (10-19: 2, 5-9: 4, 1-4: 3)Other Services (except Public Administration): Religious Organizations (10-19: 1, 5-9: 5, 1-4: 5)Other Services (except Public Administration): Automotive Oil Change and Lubrication Shops (20-49: 1, 10-19: 1, 1-4: 1)
People in group quarters in 2010:
6 people in group homes intended for adults
People in group quarters in 2000:
2 people in homes for the mentally retarded
Fatal accident statistics in 2013:
Fatal accident count: 1Vehicles involved in fatal accidents: 1Fatal accidents caused by drunken drivers: 0Fatalities: 2Persons involved in fatal accidents: 2Pedestrians involved in fatal accidents: 0
Fatal accident statistics in 2012:
Fatal accident count: 1Vehicles involved in fatal accidents: 2Fatal accidents caused by drunken drivers: 0Fatalities: 1Persons involved in fatal accidents: 2Pedestrians involved in fatal accidents: 0
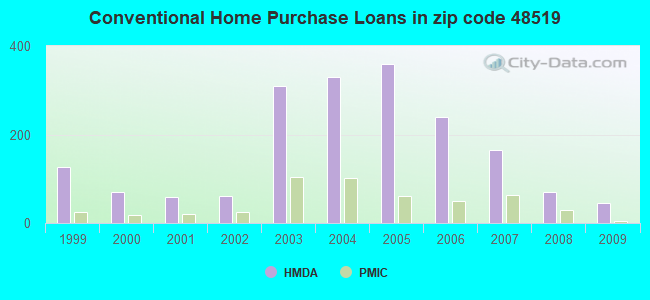
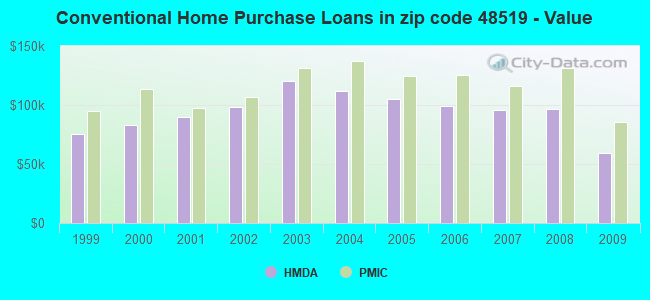
Home Mortgage Disclosure Act Aggregated Statistics For Year 2009(Based on 10 partial tracts) A) FHA, FSA/RHS & VA B) Conventional C) Refinancings D) Home Improvement Loans F) Non-occupant Loans on G) Loans On Manufactured Number Average Value Number Average Value Number Average Value Number Average Value Number Average Value Number Average Value
LOANS ORIGINATED 112 $93,616 46 $59,326 173 $106,210 16 $14,902 15 $55,938 9 $37,759 APPLICATIONS APPROVED, NOT ACCEPTED 11 $109,597 7 $55,547 17 $119,079 4 $5,395 1 $65,210 2 $42,440 APPLICATIONS DENIED 32 $84,375 11 $61,015 101 $112,229 17 $42,026 9 $50,758 6 $55,455 APPLICATIONS WITHDRAWN 17 $81,759 6 $64,177 42 $117,050 3 $36,930 3 $29,503 2 $93,125 FILES CLOSED FOR INCOMPLETENESS 6 $83,877 1 $24,310 5 $92,414 1 $7,590 0 $0 0 $0
Aggregated Statistics For Year 2008(Based on 10 partial tracts) A) FHA, FSA/RHS & VA B) Conventional C) Refinancings D) Home Improvement Loans E) Loans on Dwellings For 5+ Families F) Non-occupant Loans on G) Loans On Manufactured Number Average Value Number Average Value Number Average Value Number Average Value Number Average Value Number Average Value Number Average Value
LOANS ORIGINATED 91 $107,269 71 $96,523 186 $101,057 36 $18,552 1 $651,560 17 $77,735 12 $31,932 APPLICATIONS APPROVED, NOT ACCEPTED 5 $103,056 13 $110,635 21 $102,151 6 $12,688 0 $0 2 $73,780 5 $52,412 APPLICATIONS DENIED 16 $72,126 37 $112,279 165 $120,141 41 $69,843 0 $0 15 $85,598 6 $61,543 APPLICATIONS WITHDRAWN 14 $100,627 12 $129,645 73 $115,457 2 $54,955 0 $0 1 $37,240 1 $34,440 FILES CLOSED FOR INCOMPLETENESS 0 $0 5 $122,714 16 $115,318 2 $35,065 1 $442,540 2 $56,695 1 $101,150
Aggregated Statistics For Year 2007(Based on 10 partial tracts) A) FHA, FSA/RHS & VA B) Conventional C) Refinancings D) Home Improvement Loans F) Non-occupant Loans on G) Loans On Manufactured Number Average Value Number Average Value Number Average Value Number Average Value Number Average Value Number Average Value
LOANS ORIGINATED 39 $107,419 166 $95,652 334 $97,667 50 $28,369 28 $79,130 10 $63,769 APPLICATIONS APPROVED, NOT ACCEPTED 1 $175,950 39 $115,166 87 $115,773 10 $32,271 8 $86,254 2 $39,510 APPLICATIONS DENIED 6 $120,385 91 $112,807 341 $114,916 67 $46,474 22 $111,138 8 $57,958 APPLICATIONS WITHDRAWN 2 $96,690 21 $100,090 85 $101,660 13 $78,917 6 $70,582 1 $58,020 FILES CLOSED FOR INCOMPLETENESS 0 $0 8 $190,540 34 $114,490 0 $0 1 $567,210 0 $0
Aggregated Statistics For Year 2006(Based on 10 partial tracts) A) FHA, FSA/RHS & VA B) Conventional C) Refinancings D) Home Improvement Loans F) Non-occupant Loans on G) Loans On Manufactured Number Average Value Number Average Value Number Average Value Number Average Value Number Average Value Number Average Value
LOANS ORIGINATED 42 $129,335 239 $98,907 440 $87,382 89 $24,700 37 $98,434 6 $53,563 APPLICATIONS APPROVED, NOT ACCEPTED 4 $118,660 42 $90,433 105 $106,434 16 $27,114 9 $60,559 2 $46,265 APPLICATIONS DENIED 5 $117,688 131 $111,292 370 $111,682 81 $59,162 56 $135,373 18 $85,773 APPLICATIONS WITHDRAWN 1 $77,330 42 $109,697 183 $122,739 7 $65,467 6 $80,278 2 $39,585 FILES CLOSED FOR INCOMPLETENESS 0 $0 14 $98,682 69 $136,043 2 $90,790 1 $100,720 0 $0
Aggregated Statistics For Year 2005(Based on 10 partial tracts) A) FHA, FSA/RHS & VA B) Conventional C) Refinancings D) Home Improvement Loans E) Loans on Dwellings For 5+ Families F) Non-occupant Loans on G) Loans On Manufactured Number Average Value Number Average Value Number Average Value Number Average Value Number Average Value Number Average Value Number Average Value
LOANS ORIGINATED 24 $118,930 360 $105,152 558 $105,772 80 $29,428 3 $188,397 33 $94,080 13 $67,775 APPLICATIONS APPROVED, NOT ACCEPTED 3 $129,077 57 $92,212 110 $104,930 15 $31,126 0 $0 4 $57,428 7 $34,709 APPLICATIONS DENIED 7 $93,281 81 $104,924 404 $120,341 81 $45,693 0 $0 15 $85,474 22 $66,335 APPLICATIONS WITHDRAWN 2 $131,255 40 $113,818 290 $121,615 24 $137,795 0 $0 12 $108,282 3 $61,080 FILES CLOSED FOR INCOMPLETENESS 1 $145,190 13 $104,099 81 $120,994 2 $20,385 0 $0 0 $0 1 $146,670
Aggregated Statistics For Year 2004(Based on 10 partial tracts) A) FHA, FSA/RHS & VA B) Conventional C) Refinancings D) Home Improvement Loans E) Loans on Dwellings For 5+ Families F) Non-occupant Loans on G) Loans On Manufactured Number Average Value Number Average Value Number Average Value Number Average Value Number Average Value Number Average Value Number Average Value
LOANS ORIGINATED 29 $101,364 331 $111,864 630 $101,885 109 $31,329 1 $341,390 26 $63,820 14 $64,869 APPLICATIONS APPROVED, NOT ACCEPTED 4 $84,445 43 $110,650 107 $99,146 17 $30,515 0 $0 8 $71,168 17 $49,682 APPLICATIONS DENIED 11 $133,122 79 $96,980 338 $105,406 55 $30,709 0 $0 12 $101,488 17 $59,624 APPLICATIONS WITHDRAWN 3 $108,903 33 $114,912 182 $113,430 12 $71,385 0 $0 4 $106,242 1 $61,650 FILES CLOSED FOR INCOMPLETENESS 2 $67,630 18 $110,382 107 $112,977 4 $86,668 0 $0 1 $35,400 0 $0
Aggregated Statistics For Year 2003(Based on 10 partial tracts) A) FHA, FSA/RHS & VA B) Conventional C) Refinancings D) Home Improvement Loans F) Non-occupant Loans on Number Average Value Number Average Value Number Average Value Number Average Value Number Average Value
LOANS ORIGINATED 55 $111,425 310 $120,438 1,262 $100,245 79 $19,521 24 $80,621 APPLICATIONS APPROVED, NOT ACCEPTED 2 $101,615 21 $88,422 180 $97,763 15 $20,189 8 $79,170 APPLICATIONS DENIED 8 $97,876 53 $72,526 425 $96,232 62 $16,655 15 $78,067 APPLICATIONS WITHDRAWN 2 $130,695 22 $126,889 218 $98,393 9 $23,202 4 $151,555 FILES CLOSED FOR INCOMPLETENESS 1 $68,280 9 $76,074 54 $105,261 2 $22,955 4 $104,840
Aggregated Statistics For Year 2002(Based on 4 partial tracts) A) FHA, FSA/RHS & VA B) Conventional C) Refinancings D) Home Improvement Loans F) Non-occupant Loans on Number Average Value Number Average Value Number Average Value Number Average Value Number Average Value
LOANS ORIGINATED 25 $104,151 60 $98,727 342 $87,077 26 $12,168 7 $63,826 APPLICATIONS APPROVED, NOT ACCEPTED 0 $0 7 $69,389 45 $80,641 5 $8,766 1 $55,130 APPLICATIONS DENIED 3 $109,007 22 $46,646 90 $84,333 16 $11,334 4 $66,148 APPLICATIONS WITHDRAWN 2 $128,210 7 $98,693 92 $80,164 3 $21,410 2 $29,525 FILES CLOSED FOR INCOMPLETENESS 0 $0 1 $96,820 25 $92,240 0 $0 1 $71,420
Aggregated Statistics For Year 2001(Based on 4 partial tracts) A) FHA, FSA/RHS & VA B) Conventional C) Refinancings D) Home Improvement Loans F) Non-occupant Loans on Number Average Value Number Average Value Number Average Value Number Average Value Number Average Value
LOANS ORIGINATED 29 $95,276 58 $90,092 289 $85,904 44 $14,902 5 $63,136 APPLICATIONS APPROVED, NOT ACCEPTED 1 $70,830 9 $79,536 41 $76,530 6 $17,532 0 $0 APPLICATIONS DENIED 2 $114,880 37 $47,857 90 $72,649 22 $12,284 3 $50,250 APPLICATIONS WITHDRAWN 3 $100,227 8 $75,382 65 $81,379 6 $33,740 1 $83,170 FILES CLOSED FOR INCOMPLETENESS 1 $72,780 2 $163,590 16 $96,208 0 $0 0 $0
Aggregated Statistics For Year 2000(Based on 4 partial tracts) A) FHA, FSA/RHS & VA B) Conventional C) Refinancings D) Home Improvement Loans F) Non-occupant Loans on Number Average Value Number Average Value Number Average Value Number Average Value Number Average Value
LOANS ORIGINATED 31 $88,240 71 $83,402 108 $63,181 38 $15,597 5 $64,000 APPLICATIONS APPROVED, NOT ACCEPTED 0 $0 23 $59,773 28 $80,044 13 $18,026 2 $122,810 APPLICATIONS DENIED 2 $122,655 51 $47,094 58 $61,817 18 $11,855 2 $23,790 APPLICATIONS WITHDRAWN 1 $83,700 5 $118,388 35 $61,997 4 $42,835 1 $62,580 FILES CLOSED FOR INCOMPLETENESS 0 $0 0 $0 14 $82,190 1 $25,560 0 $0
Aggregated Statistics For Year 1999(Based on 5 partial tracts) A) FHA, FSA/RHS & VA B) Conventional C) Refinancings D) Home Improvement Loans F) Non-occupant Loans on Number Average Value Number Average Value Number Average Value Number Average Value Number Average Value
LOANS ORIGINATED 44 $85,328 126 $75,765 185 $78,845 62 $14,807 10 $222,454 APPLICATIONS APPROVED, NOT ACCEPTED 1 $83,580 43 $54,825 45 $63,805 12 $19,707 4 $44,382 APPLICATIONS DENIED 2 $94,440 121 $49,310 87 $60,526 29 $11,520 5 $45,602 APPLICATIONS WITHDRAWN 3 $63,490 10 $96,453 70 $71,112 4 $33,485 1 $49,470 FILES CLOSED FOR INCOMPLETENESS 1 $50,620 1 $74,200 20 $73,656 1 $8,270 0 $0
Private Mortgage Insurance Companies Aggregated Statistics For Year 2009(Based on 6 partial tracts) A) Conventional B) Refinancings Number Average Value Number Average Value
LOANS ORIGINATED 4 $85,432 1 $84,470 APPLICATIONS APPROVED, NOT ACCEPTED 4 $114,428 2 $146,975 APPLICATIONS DENIED 1 $106,840 2 $92,505 APPLICATIONS WITHDRAWN 0 $0 0 $0 FILES CLOSED FOR INCOMPLETENESS 1 $289,140 1 $117,610
Aggregated Statistics For Year 2008(Based on 10 partial tracts) A) Conventional B) Refinancings C) Non-occupant Loans on Number Average Value Number Average Value Number Average Value
LOANS ORIGINATED 30 $131,760 18 $131,047 2 $153,880 APPLICATIONS APPROVED, NOT ACCEPTED 21 $137,903 24 $158,610 1 $97,360 APPLICATIONS DENIED 7 $126,311 2 $108,455 1 $11,050 APPLICATIONS WITHDRAWN 2 $192,560 2 $132,600 0 $0 FILES CLOSED FOR INCOMPLETENESS 2 $216,550 0 $0 0 $0
Aggregated Statistics For Year 2007(Based on 10 partial tracts) A) Conventional B) Refinancings C) Non-occupant Loans on D) Loans On Manufactured Number Average Value Number Average Value Number Average Value Number Average Value
LOANS ORIGINATED 63 $116,157 46 $128,425 5 $41,082 1 $170,690 APPLICATIONS APPROVED, NOT ACCEPTED 8 $137,298 15 $139,117 1 $136,570 0 $0 APPLICATIONS DENIED 3 $115,013 2 $252,230 2 $30,825 0 $0 APPLICATIONS WITHDRAWN 2 $83,870 6 $165,133 1 $40,940 0 $0 FILES CLOSED FOR INCOMPLETENESS 0 $0 0 $0 0 $0 0 $0
Aggregated Statistics For Year 2006(Based on 10 partial tracts) A) Conventional B) Refinancings C) Non-occupant Loans on D) Loans On Manufactured Number Average Value Number Average Value Number Average Value Number Average Value
LOANS ORIGINATED 50 $125,803 27 $128,340 2 $46,470 1 $59,060 APPLICATIONS APPROVED, NOT ACCEPTED 3 $98,163 14 $135,009 1 $35,920 0 $0 APPLICATIONS DENIED 0 $0 0 $0 0 $0 0 $0 APPLICATIONS WITHDRAWN 0 $0 1 $122,810 0 $0 0 $0 FILES CLOSED FOR INCOMPLETENESS 0 $0 0 $0 0 $0 0 $0
Aggregated Statistics For Year 2005(Based on 10 partial tracts) A) Conventional B) Refinancings C) Non-occupant Loans on D) Loans On Manufactured Number Average Value Number Average Value Number Average Value Number Average Value
LOANS ORIGINATED 62 $124,250 36 $141,968 1 $85,730 1 $134,110 APPLICATIONS APPROVED, NOT ACCEPTED 12 $127,855 16 $145,141 1 $123,040 0 $0 APPLICATIONS DENIED 1 $57,640 1 $151,730 1 $151,730 0 $0 APPLICATIONS WITHDRAWN 1 $177,400 3 $89,447 1 $35,920 0 $0 FILES CLOSED FOR INCOMPLETENESS 1 $44,110 1 $51,620 0 $0 0 $0
Aggregated Statistics For Year 2004(Based on 10 partial tracts) A) Conventional B) Refinancings C) Non-occupant Loans on Number Average Value Number Average Value Number Average Value
LOANS ORIGINATED 101 $137,592 53 $134,799 4 $83,258 APPLICATIONS APPROVED, NOT ACCEPTED 20 $100,458 15 $138,780 5 $84,782 APPLICATIONS DENIED 1 $27,570 1 $235,010 0 $0 APPLICATIONS WITHDRAWN 5 $103,378 5 $131,796 1 $146,420 FILES CLOSED FOR INCOMPLETENESS 1 $196,860 3 $98,537 0 $0
Aggregated Statistics For Year 2003(Based on 10 partial tracts) A) Conventional B) Refinancings C) Non-occupant Loans on Number Average Value Number Average Value Number Average Value
LOANS ORIGINATED 104 $131,541 133 $130,800 4 $115,508 APPLICATIONS APPROVED, NOT ACCEPTED 21 $115,997 44 $139,915 4 $71,122 APPLICATIONS DENIED 1 $48,050 4 $150,202 0 $0 APPLICATIONS WITHDRAWN 3 $135,933 12 $130,231 0 $0 FILES CLOSED FOR INCOMPLETENESS 0 $0 1 $89,020 0 $0
Aggregated Statistics For Year 2002(Based on 4 partial tracts) A) Conventional B) Refinancings C) Non-occupant Loans on Number Average Value Number Average Value Number Average Value
LOANS ORIGINATED 24 $106,676 34 $105,820 1 $43,540 APPLICATIONS APPROVED, NOT ACCEPTED 6 $123,853 9 $118,236 1 $35,080 APPLICATIONS DENIED 0 $0 0 $0 0 $0 APPLICATIONS WITHDRAWN 1 $160,500 2 $122,605 0 $0 FILES CLOSED FOR INCOMPLETENESS 0 $0 0 $0 0 $0
Aggregated Statistics For Year 2001(Based on 4 partial tracts) A) Conventional B) Refinancings C) Non-occupant Loans on Number Average Value Number Average Value Number Average Value
LOANS ORIGINATED 21 $97,243 31 $104,838 1 $78,630 APPLICATIONS APPROVED, NOT ACCEPTED 1 $68,880 10 $93,655 0 $0 APPLICATIONS DENIED 0 $0 3 $104,013 1 $49,620 APPLICATIONS WITHDRAWN 0 $0 0 $0 0 $0 FILES CLOSED FOR INCOMPLETENESS 0 $0 0 $0 0 $0
Aggregated Statistics For Year 2000(Based on 4 partial tracts) A) Conventional B) Refinancings Number Average Value Number Average Value
LOANS ORIGINATED 19 $113,774 10 $97,030 APPLICATIONS APPROVED, NOT ACCEPTED 1 $78,690 4 $93,935 APPLICATIONS DENIED 1 $119,860 1 $54,130 APPLICATIONS WITHDRAWN 0 $0 0 $0 FILES CLOSED FOR INCOMPLETENESS 0 $0 0 $0
Aggregated Statistics For Year 1999(Based on 5 partial tracts) A) Conventional B) Refinancings C) Non-occupant Loans on Number Average Value Number Average Value Number Average Value
LOANS ORIGINATED 25 $94,838 16 $90,724 1 $63,130 APPLICATIONS APPROVED, NOT ACCEPTED 2 $115,165 2 $106,525 0 $0 APPLICATIONS DENIED 1 $94,850 1 $65,640 1 $33,010 APPLICATIONS WITHDRAWN 0 $0 1 $75,870 0 $0 FILES CLOSED FOR INCOMPLETENESS 0 $0 0 $0 0 $0
2002 - 2018 National Fire Incident Reporting System (NFIRS) incidents See full 2006 National Fire Incident Reporting System statistics for zip code 48519, Michigan
Most common first names in zip code 48519 among deceased individuals Name Count Lived (average)
William 40 73.7 years Mary 36 79.9 years Robert 35 70.9 years James 30 68.9 years Charles 28 72.2 years John 22 71.7 years Margaret 19 81.2 years Helen 16 81.9 years Thomas 13 73.2 years Dorothy 13 80.5 years
Most common last names in zip code 48519 among deceased individuals Last name Count Lived (average)
Smith 16 76.5 years Johnson 14 72.9 years Brown 12 64.9 years White 8 74.0 years Morgan 7 75.9 years Thomas 7 72.3 years Bell 6 88.5 years Miller 6 79.1 years Jones 6 85.8 years Perry 6 73.5 years
Businesses in zip code 48519
Name Count Name Count
Dairy Queen 1 Sprint Nextel 1 FedEx 1 Subway 1 McDonald's 1 UPS 1 Meijer 1


 Nearest zip codes: 48509, 48529, 48439, 48506, 48502, 48411.
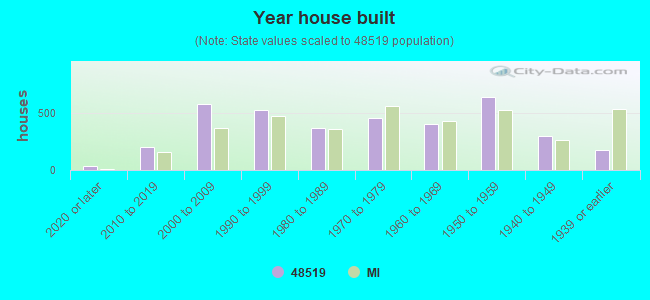


 Based on the data from the years 2002 - 2018 the average number of fire incidents per year is 19. The highest number of fires - 36 took place in 2015, and the least - 0 in 2013. The data has a growing trend.
 When looking into fire subcategories, the most reports belonged to: Structure Fires (54.6%), and Mobile Property/Vehicle Fires (21.3%).