Estimated zip code population in 2022: 1,953 Zip code population in 2010: 1,938 Zip code population in 2000: 2,012
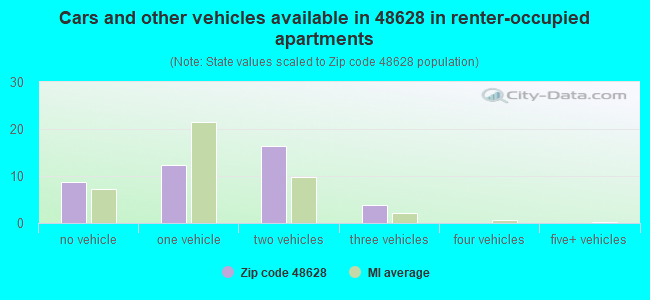
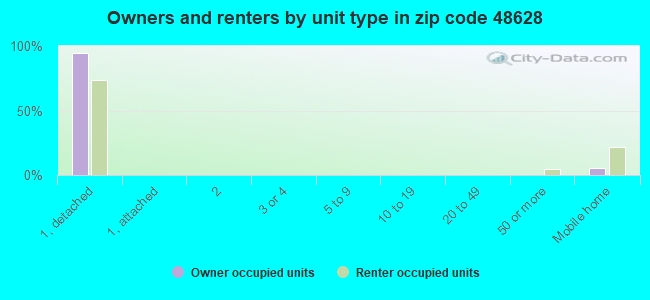
Houses and condos: 1,059 Renter-occupied apartments: 41
% of renters here:
5%
State:
27%
March 2022 cost of living index in zip code 48628: 81.3 (low, U.S. average is 100)
Land area: 33.1 sq. mi. Water area: 0.7 sq. mi.
Population density: 59 people per square mile
(very low).
OSM Map
General Map
Google Map
MSN Map
OSM Map
General Map
Google Map
MSN Map
OSM Map
General Map
Google Map
MSN Map
OSM Map
General Map
Google Map
MSN Map
Please wait while loading the map...
Real estate property taxes paid for housing units in 2022:
This zip code:
1.5% ($2,775)
Michigan:
1.2% ($2,746)
Median real estate property taxes paid for housing units with mortgages in 2022: $2,765 (1.4%) Median real estate property taxes paid for housing units with no mortgage in 2022: $2,841 (1.5%)
Business Search- 14 Million verified businesses
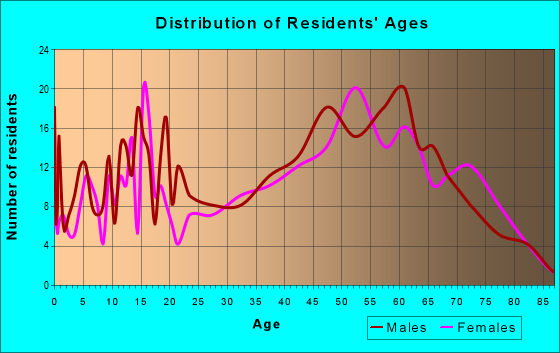
Males: 1,065
(54.6%)
Females: 887
(45.4%)
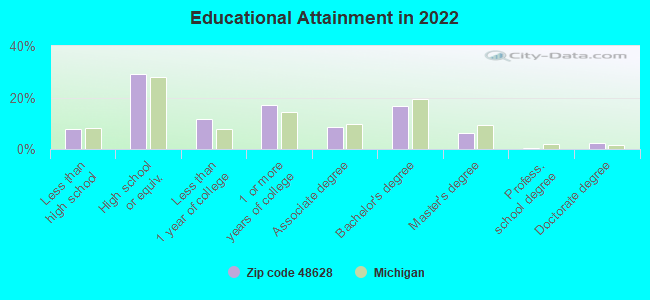
For population 25 years and over in 48628:
High school or higher: 92.0%
Bachelor's degree or higher: 25.6%
Graduate or professional degree: 8.8%
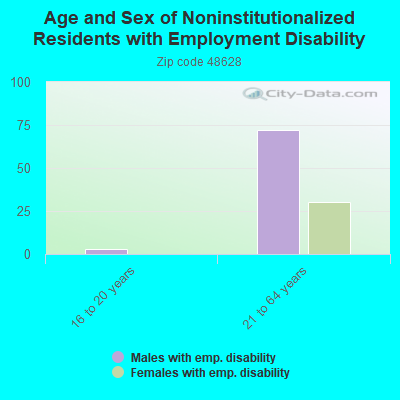
Unemployed: 2.3%
Mean travel time to work (commute): 29.2 minutes
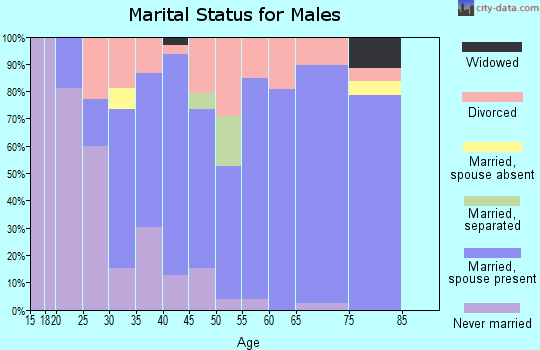
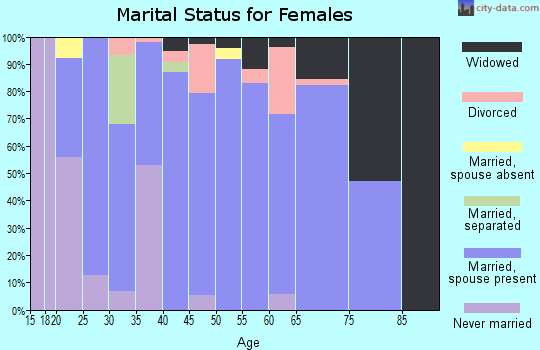
For population 15 years and over in 48628:
Never married: 22.2%
Now married: 61.1%
Separated: 1.7%
Widowed: 5.7%
Divorced: 9.4%
Zip code 48628 compared to state average:
Unemployed percentage below state average.
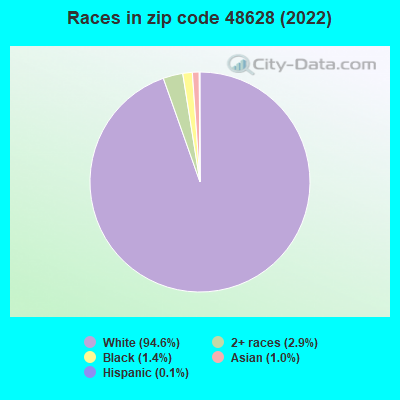
Black race population percentage significantly below state average.
Hispanic race population percentage significantly below state average.
Median age above state average.
Foreign-born population percentage significantly below state average.
Renting percentage significantly below state average.
Length of stay since moving in above state average.
Averages for the 2020 tax year for zip code 48628, filed in 2021:
Average Adjusted Gross Income (AGI) in 2020: $65,200 (Individual Income Tax Returns)
Here:
$65,200
State:
$68,945
Salary/wage: $56,481 (reported on 74.5% of returns)
Here:
$56,481
State:
$57,142
(% of AGI for various income ranges: 921.6% for AGIs below $25k, 2750.0% for AGIs $25k-50k, 5827.3% for AGIs $50k-75k, 7602.5% for AGIs $75k-100k, 11507.5% for AGIs $100k-200k)
Taxable interest for individuals: $1,154 (reported on 39.8% of returns)
This zip code:
$1,154
Michigan:
$1,630
(% of AGI for various income ranges: 23.2% for AGIs below $25k, 20.0% for AGIs $25k-50k, 61.8% for AGIs $50k-75k, 96.2% for AGIs $75k-100k, 115.8% for AGIs $100k-200k)
Ordinary dividends: $7,045 (reported on 20.4% of returns)
Here:
$7,045
State:
$6,972
(% of AGI for various income ranges: 18.4% for AGIs below $25k, 32.1% for AGIs $25k-50k, 115.5% for AGIs $50k-75k, 98.8% for AGIs $75k-100k, 140.8% for AGIs $100k-200k)
Net capital gain/loss in AGI: +$12,173 (reported on 15.3% of returns)
Here:
+$12,173
State:
+$20,064
(% of AGI for various income ranges: 0.5% for AGIs below $25k, 2.1% for AGIs $25k-50k, 46.4% for AGIs $50k-75k, 30.0% for AGIs $75k-100k, 265.0% for AGIs $100k-200k)
Profit/loss from business: +$5,462 (reported on 13.3% of returns)
Here:
+$5,462
State:
+$11,172
(% of AGI for various income ranges: 80.5% for AGIs below $25k, 175.3% for AGIs $25k-50k, 187.3% for AGIs $50k-75k, 15.0% for AGIs $100k-200k)
Taxable individual retirement arrangement distribution: $15,886 (reported on 14.3% of returns)
48628:
$15,886
Michigan:
$19,803
(% of AGI for various income ranges: 61.6% for AGIs below $25k, 208.4% for AGIs $25k-50k, 279.1% for AGIs $50k-75k, 411.2% for AGIs $75k-100k, 895.8% for AGIs $100k-200k)
Total itemized deductions: $55,180 (reported on 10.2% of returns)
Here:
$55,180
State:
$34,117
(% of AGI for various income ranges: 1776.4% for AGIs $50k-75k, 2970.0% for AGIs $100k-200k)
Charity contributions: $9,125 (reported on 4.1% of returns)
Here:
$9,125
State:
$13,548
(% of AGI for various income ranges: 304.2% for AGIs $100k-200k)
Taxes paid: $9,060 (reported on 5.1% of returns)
48628:
$9,060
State:
$7,972
(% of AGI for various income ranges: 377.5% for AGIs $100k-200k)
Earned income credit: $1,973 (reported on 11.2% of returns)
Here:
$1,973
State:
$2,251
(% of AGI for various income ranges: 59.5% for AGIs below $25k, 54.7% for AGIs $25k-50k)
Percentage of individuals using paid preparers for their 2020 taxes: 92.9%
Here:
93%
State:
93%
(% for various income ranges: 89.7% for AGIs below $25k, 95.7% for AGIs $25k-50k, 93.8% for AGIs $50k-75k, 90.9% for AGIs $75k-100k, 93.3% for AGIs $100k-200k, 100.0% for AGIs over 200k)
Averages for the 2012 tax year for zip code 48628, filed in 2013:
Average Adjusted Gross Income (AGI) in 2012: $51,923 (Individual Income Tax Returns)
Here:
$51,923
State:
$55,609
Salary/wage: $45,440 (reported on 78.2% of returns)
Here:
$45,440
State:
$46,782
(% of AGI for various income ranges: 53.7% for AGIs below $25k, 59.9% for AGIs $25k-50k, 70.7% for AGIs $50k-75k, 63.6% for AGIs $75k-100k, 127.7% for AGIs $100k-200k)
Taxable interest for individuals: $740 (reported on 40.2% of returns)
This zip code:
$740
Michigan:
$1,491
(% of AGI for various income ranges: 2.1% for AGIs below $25k, 0.5% for AGIs $25k-50k, 0.3% for AGIs $50k-75k, 0.3% for AGIs $75k-100k, 0.8% for AGIs $100k-200k)
Ordinary dividends: $2,463 (reported on 21.8% of returns)
Here:
$2,463
State:
$6,225
(% of AGI for various income ranges: 1.2% for AGIs below $25k, 0.7% for AGIs $25k-50k, 0.6% for AGIs $50k-75k, 2.4% for AGIs $75k-100k, 1.4% for AGIs $100k-200k)
Net capital gain/loss in AGI: +$791 (reported on 12.6% of returns)
Here:
+$791
State:
+$9,326
(% of AGI for various income ranges: 0.4% for AGIs $50k-75k, 0.8% for AGIs $100k-200k)
Profit/loss from business: +$6,150 (reported on 13.8% of returns)
Here:
+$6,150
State:
+$11,523
(% of AGI for various income ranges: 8.8% for AGIs below $25k, 3.4% for AGIs $25k-50k, 1.7% for AGIs $50k-75k)
Taxable individual retirement arrangement distribution: $13,973 (reported on 12.6% of returns)
48628:
$13,973
Michigan:
$15,298
(% of AGI for various income ranges: 3.9% for AGIs below $25k, 7.5% for AGIs $25k-50k, 11.7% for AGIs $75k-100k)
Total itemized deductions: $21,131 (22% of AGI, reported on 29.9% of returns)
Here:
$21,131
State:
$21,628
Here:
21.7% of AGI
State:
18.4% of AGI
(% of AGI for various income ranges: 10.8% for AGIs below $25k, 8.8% for AGIs $25k-50k, 11.8% for AGIs $50k-75k, 12.5% for AGIs $75k-100k, 13.0% for AGIs $100k-200k, 15.1% for AGIs over 200k)
Charity contributions: $3,123 (reported on 25.3% of returns)
Here:
$3,123
State:
$4,225
(% of AGI for various income ranges: 0.7% for AGIs below $25k, 0.7% for AGIs $25k-50k, 1.6% for AGIs $50k-75k, 1.4% for AGIs $75k-100k, 3.4% for AGIs $100k-200k)
Taxes paid: $6,900 (reported on 29.9% of returns)
48628:
$6,900
State:
$8,327
(% of AGI for various income ranges: 2.5% for AGIs below $25k, 2.4% for AGIs $25k-50k, 3.5% for AGIs $50k-75k, 4.4% for AGIs $75k-100k, 4.9% for AGIs $100k-200k, 5.2% for AGIs over 200k)
Earned income credit: $1,892 (reported on 14.9% of returns)
Here:
$1,892
State:
$2,306
(% of AGI for various income ranges: 4.8% for AGIs below $25k, 0.8% for AGIs $25k-50k)
Percentage of individuals using paid preparers for their 2012 taxes: 59.8%
Here:
60%
State:
57%
(% for various income ranges: 55.9% for AGIs below $25k, 57.1% for AGIs $25k-50k, 64.3% for AGIs $50k-75k, 62.5% for AGIs $75k-100k, 87.5% for AGIs $100k-200k)
Averages for the 2004 tax year for zip code 48628, filed in 2005:
Average Adjusted Gross Income (AGI) in 2004: $43,392 (Individual Income Tax Returns)
Here:
$43,392
State:
$48,204
Salary/wage: $39,830 (reported on 82.3% of returns)
Here:
$39,830
State:
$42,791
(% of AGI for various income ranges: 74.8% for AGIs below $10k, 63.2% for AGIs $10k-25k, 67.7% for AGIs $25k-50k, 74.8% for AGIs $50k-75k, 80.0% for AGIs $75k-100k, 82.9% for AGIs over 100k)
Taxable interest for individuals: $854 (reported on 54.7% of returns)
This zip code:
$854
Michigan:
$1,725
(% of AGI for various income ranges: 5.4% for AGIs below $10k, 3.7% for AGIs $10k-25k, 0.7% for AGIs $25k-50k, 1.1% for AGIs $50k-75k, 0.4% for AGIs $75k-100k, 0.5% for AGIs over 100k)
Taxable dividends: $2,047 (reported on 25.2% of returns)
Here:
$2,047
State:
$3,420
(% of AGI for various income ranges: 2.1% for AGIs below $10k, 1.3% for AGIs $10k-25k, 1.9% for AGIs $25k-50k, 0.9% for AGIs $50k-75k, 0.3% for AGIs $75k-100k, 1.5% for AGIs over 100k)
Profit/loss from business: +$26 (reported on 14.0% of returns)
Here:
+$26
State:
+$9,547
(% of AGI for various income ranges: 2.6% for AGIs below $10k, -2.2% for AGIs $10k-25k, 0.0% for AGIs $25k-50k, 0.3% for AGIs $50k-75k, 0.6% for AGIs $75k-100k)
Total itemized deductions: $17,569 (23% of AGI, reported on 33.8% of returns)
Here:
$17,569
State:
$18,509
Here:
22.7% of AGI
State:
20.7% of AGI
(% of AGI for various income ranges: 14.4% for AGIs $10k-25k, 12.4% for AGIs $25k-50k, 12.6% for AGIs $50k-75k, 13.7% for AGIs $75k-100k, 16.2% for AGIs over 100k)
Charity contributions deductions: $2,646 (3% of AGI, reported on 29.0% of returns)
Here:
$2,646
State:
$3,365
Here:
3.3% of AGI
State:
3.6% of AGI
(% of AGI for various income ranges: 1.4% for AGIs $10k-25k, 1.7% for AGIs $25k-50k, 1.2% for AGIs $50k-75k, 2.3% for AGIs $75k-100k, 2.2% for AGIs over 100k)
Total tax: $6,030 (reported on 72.9% of returns)
48628:
$6,030
State:
$7,691
(% of AGI for various income ranges: 2.9% for AGIs below $10k, 3.1% for AGIs $10k-25k, 6.7% for AGIs $25k-50k, 8.2% for AGIs $50k-75k, 10.4% for AGIs $75k-100k, 16.9% for AGIs over 100k)
Earned income credit: $1,721 (reported on 14.6% of returns)
Here:
$1,721
State:
$1,737
Percentage of individuals using paid preparers for their 2004 taxes: 60.8%
Here:
61%
State:
60%
(% for various income ranges: 51.5% for AGIs below $10k, 65.7% for AGIs $10k-25k, 62.0% for AGIs $25k-50k, 68.1% for AGIs $50k-75k, 44.2% for AGIs $75k-100k, 71.2% for AGIs over 100k)
Household received Food Stamps/SNAP in the past 12 months: 48 Household did not receive Food Stamps/SNAP in the past 12 months: 759
Women who had a birth in the past 12 months: 51 (28 now married, 22 unmarried) Women who did not have a birth in the past 12 months: 284 (156 now married, 127 unmarried)
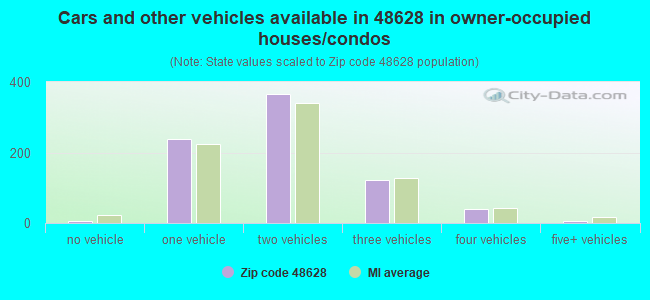
Housing units in zip code 48628 with a mortgage: 419 (21 second mortgage, 20 both second mortgage and home equity loan) Houses without a mortgage: 5
Median monthly owner costs for units with a mortgage: $1,278 Median monthly owner costs for units without a mortgage: $622
Residents with income below the poverty level in 2022:
This zip code:
5.5%
Whole state:
13.4%
Residents with income below 50% of the poverty level in 2022:
This zip code:
3.6%
Whole state:
6.9%
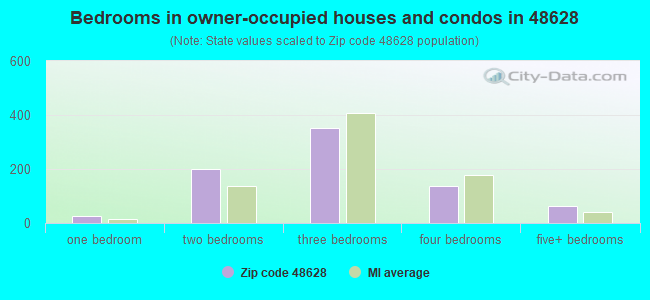
Median number of rooms in houses and condos:
Here:
6.1
State:
6.5
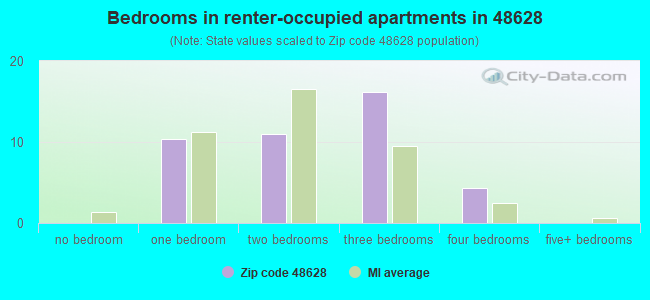
Median number of rooms in apartments:
Here:
5.7
State:
4.3
Notable locations in this zip code not listed on our city pages
Notable locations in zip code 48628: Gully Golf Course (A), Hope Township Fire Department (B), Edenville Fire and Rescue Station 1 (C). Display/hide their locations on the map
Churches in zip code 48628 include: Edenville United Methodist Church (A), Hope Baptist Church (B), Mount Hope Fellowship Church (C), Hope United Methodist Church (D), New Hope Community Church of God (E). Display/hide their locations on the map
Size of family households: 319 2-persons, 158 3-persons, 69 4-persons, 36 5-persons, 9 6-persons, 9 7-or-more-persons
Size of nonfamily households: 178 1-person, 20 2-persons, 10 3-persons
198 married couples with children.
142 single-parent households (50 men, 92 women).
97.1% of residents of 48628 zip code speak English at home.
0.8% of residents speak Spanish at home (100% very well).
1.0% of residents speak other Indo-European language at home (100% very well).
0.2% of residents speak Asian or Pacific Island language at home (100% very well).
0.8% of residents speak other language at home (80% very well, 20% well).
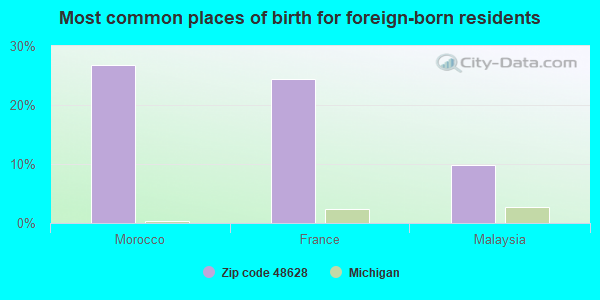
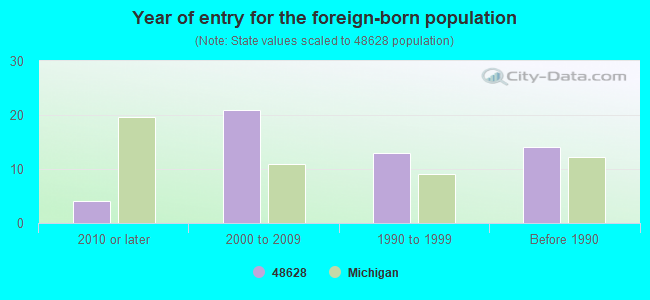
Foreign born population: 41 (2.1%) (90.7% of them are naturalized citizens)
This zip code:
2.1%
Whole state:
6.9%
27%Morocco
24%France
10%Malaysia
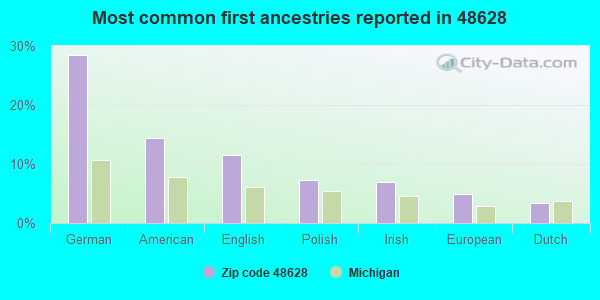
28%German
14%American
12%English
7%Polish
7%Irish
5%European
3%Dutch
Year of entry for the foreign-born population
42010 or later
212000 to 2009
131990 to 1999
14Before 1990
Facilities with environmental interests located in this zip code:
EGGERS EXC-LAKEWOOD ESTATES (4800 N MERIDIAN RD in HOPE, MI)
National Pollutant Discharge Elimination System NON-MAJOR (Tracking pollutant discharge elimination systems) - permit Business SIC classification: NONCLASSIFIABLE ESTABLISHMENTS Organizations: EGGERS EXCAVATING (CONTACT/OWNER)
Housing units lacking complete plumbing facilities: 4.0% Housing units lacking complete kitchen facilities: 4.8%
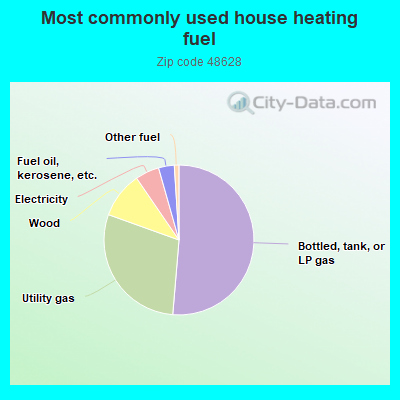
51.6%Bottled, tank, or LP gas
29.3%Utility gas
10.0%Wood
5.2%Electricity
3.4%Fuel oil, kerosene, etc.
1.0%Other fuel
Population in 1990: 1,339. Population change in the 1990s: +673 (+50.3%).
Place of birth for U.S.-born residents:
This state: 1,670
Northeast: 48
Midwest: 39
South: 98
West: 37
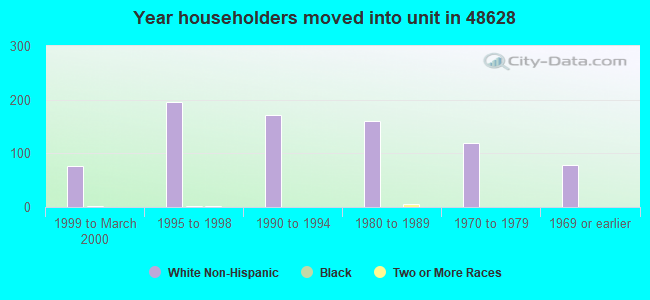
68% of the 48628 zip code residents lived in the same house 5 years ago. Out of people who lived in different houses, 51% lived in this county. Out of people who lived in different counties, 50% lived in Michigan.
88% of the 48628 zip code residents lived in the same house 1 year ago. Out of people who lived in different houses, 36% moved from this county. Out of people who lived in different houses, 44% moved from different county within same state. Out of people who lived in different houses, 19% moved from different state.
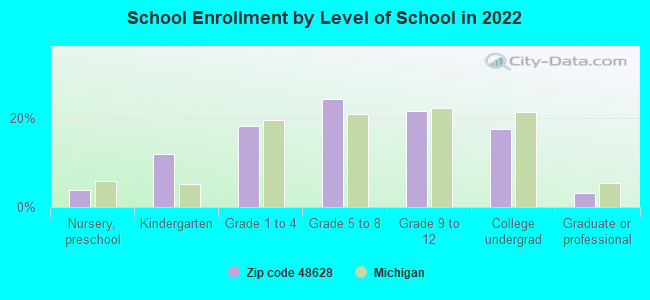
Private vs. public school enrollment:
Students in private schools in grades 1 to 8 (elementary and middle school): 2
Here:
1.5%
Michigan:
12.4%
Students in private schools in grades 9 to 12 (high school):
Here:
0.0%
Michigan:
9.8%
Students in private undergraduate colleges: 5
Here:
9.0%
Michigan:
14.9%
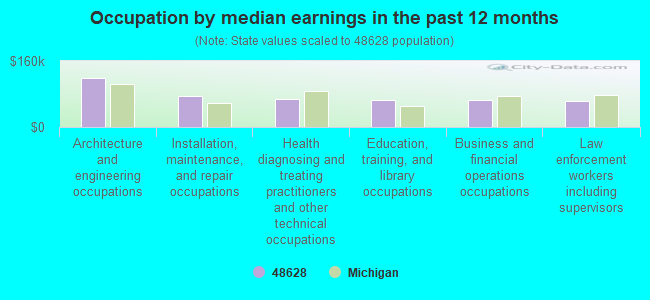
Occupation by median earnings in the past 12 months ($)
119,692Architecture and engineering occupations
74,465Installation, maintenance, and repair occupations
68,333Health diagnosing and treating practitioners and other technical occupations
66,090Education, training, and library occupations
65,158Business and financial operations occupations
62,401Law enforcement workers including supervisors
Top industries in this zip code by the number of employees in 2005:
Construction: Plumbing, Heating, and Air-Conditioning Contractors (10-19 employees: 1 establishment)
Other Services (except Public Administration): Religious Organizations (5-9: 1, 1-4: 1)
Construction: Residential Remodelers (1-4: 2)
Administrative and Support and Waste Management and Remediation Services: Security Systems Services (except Locksmiths) (1-4: 1)
Construction: Site Preparation Contractors (1-4: 1)
Construction: New Single-Family Housing Construction (except Operative Builders) (1-4: 1)
Other Services (except Public Administration): Other Personal and Household Goods Repair and Maintenance (1-4: 1)
Professional, Scientific, and Technical Services: Engineering Services (1-4: 1)
Fatal accident statistics in 2013:
Fatal accident count: 2
Vehicles involved in fatal accidents: 3
Fatal accidents caused by drunken drivers: 1
Fatalities: 2
Persons involved in fatal accidents: 4
Pedestrians involved in fatal accidents: 0
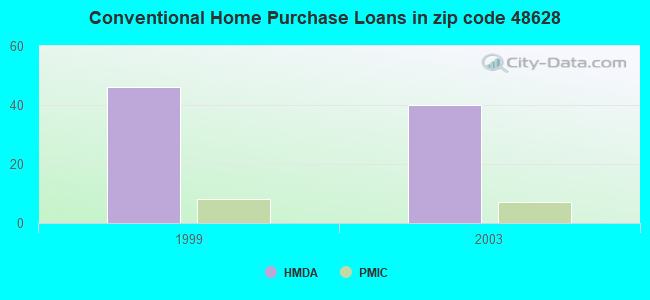
Home Mortgage Disclosure Act Aggregated Statistics For Year 2003 (Based on 2 partial tracts)
A) FHA, FSA/RHS & VA Home Purchase Loans
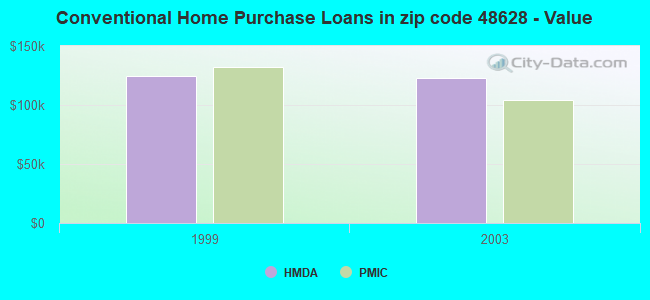
B) Conventional Home Purchase Loans
C) Refinancings
D) Home Improvement Loans
F) Non-occupant Loans on < 5 Family Dwellings (A B C & D)
Number
Average Value
Number
Average Value
Number
Average Value
Number
Average Value
Number
Average Value
LOANS ORIGINATED
5
$87,420
40
$123,187
240
$109,776
13
$22,994
8
$158,272
APPLICATIONS APPROVED, NOT ACCEPTED
0
$0
2
$94,000
25
$95,466
1
$7,520
2
$75,670
APPLICATIONS DENIED
0
$0
4
$54,285
89
$88,719
6
$23,657
1
$131,600
APPLICATIONS WITHDRAWN
1
$80,840
5
$79,336
33
$107,103
0
$0
4
$130,425
FILES CLOSED FOR INCOMPLETENESS
0
$0
0
$0
5
$95,128
0
$0
1
$138,180
Aggregated Statistics For Year 1999 (Based on 1 partial tract)
A) FHA, FSA/RHS & VA Home Purchase Loans
B) Conventional Home Purchase Loans
C) Refinancings
D) Home Improvement Loans
F) Non-occupant Loans on < 5 Family Dwellings (A B C & D)
Detailed PMIC statistics for the following Tracts:2911.01
2002 - 2018 National Fire Incident Reporting System (NFIRS) incidents
Based on the data from the years 2002 - 2018 the average number of fires per year is 10. The highest number of fires - 23 took place in 2003, and the least - 3 in 2005. The data has a growing trend.
When looking into fire subcategories, the most reports belonged to: Structure Fires (51.2%), and Outside Fires (30.8%).
Fire incident types reported to NFIRS in Zip Code 48628
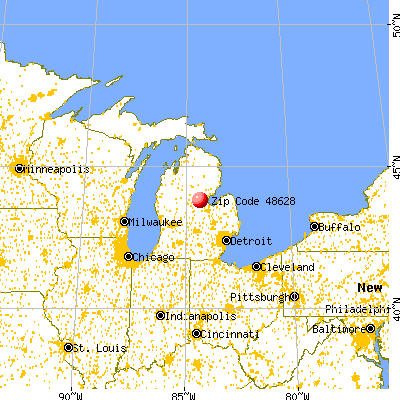


 Nearest zip codes: 48642, 48657, 48612, 48652, 48640, 48667.


 Based on the data from the years 2002 - 2018 the average number of fires per year is 10. The highest number of fires - 23 took place in 2003, and the least - 3 in 2005. The data has a growing trend.
 When looking into fire subcategories, the most reports belonged to: Structure Fires (51.2%), and Outside Fires (30.8%).