Estimated zip code population in 2022: 1,604 Zip code population in 2010: 1,573 Zip code population in 2000: 1,839
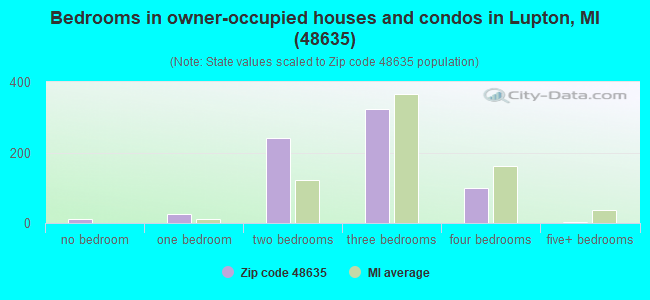
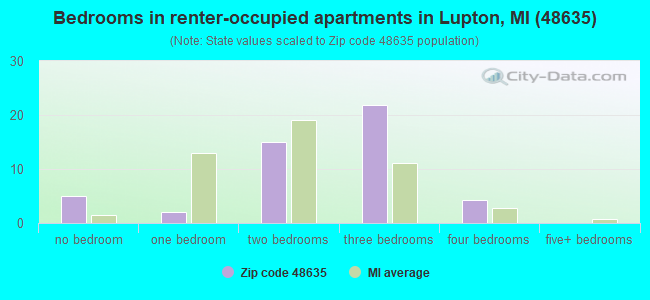
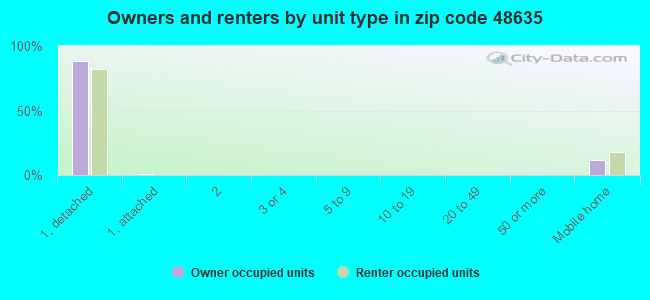
Houses and condos: 1,673 Renter-occupied apartments: 49
% of renters here:
7%
State:
27%
March 2022 cost of living index in zip code 48635: 80.9 (low, U.S. average is 100)
Land area: 57.9 sq. mi. Water area: 2.8 sq. mi.
Population density: 28 people per square mile
(very low).
OSM Map
General Map
Google Map
MSN Map
OSM Map
General Map
Google Map
MSN Map
OSM Map
General Map
Google Map
MSN Map
OSM Map
General Map
Google Map
MSN Map
Please wait while loading the map...
Real estate property taxes paid for housing units in 2022:
This zip code:
1.0% ($1,308)
Michigan:
1.2% ($2,746)
Median real estate property taxes paid for housing units with mortgages in 2022: $1,401 (1.0%) Median real estate property taxes paid for housing units with no mortgage in 2022: $1,257 (1.0%)
Averages for the 2020 tax year for zip code 48635, filed in 2021:
Average Adjusted Gross Income (AGI) in 2020: $49,223 (Individual Income Tax Returns)
Here:
$49,223
State:
$68,945
Salary/wage: $41,761 (reported on 62.2% of returns)
Here:
$41,761
State:
$57,142
(% of AGI for various income ranges: 847.4% for AGIs below $25k, 2325.6% for AGIs $25k-50k, 5086.7% for AGIs $50k-75k, 7894.0% for AGIs $75k-100k, 13760.0% for AGIs $100k-200k)
Taxable interest for individuals: $729 (reported on 32.4% of returns)
This zip code:
$729
Michigan:
$1,630
(% of AGI for various income ranges: 16.8% for AGIs below $25k, 40.6% for AGIs $25k-50k, 41.7% for AGIs $50k-75k, 56.0% for AGIs $75k-100k, 50.0% for AGIs $100k-200k)
Ordinary dividends: $2,331 (reported on 17.6% of returns)
Here:
$2,331
State:
$6,972
(% of AGI for various income ranges: 26.3% for AGIs below $25k, 71.9% for AGIs $25k-50k, 63.3% for AGIs $50k-75k, 200.0% for AGIs $100k-200k)
Net capital gain/loss in AGI: +$4,508 (reported on 17.6% of returns)
Here:
+$4,508
State:
+$20,064
(% of AGI for various income ranges: 37.5% for AGIs $25k-50k, 68.3% for AGIs $50k-75k, 986.0% for AGIs $100k-200k)
Profit/loss from business: +$4,088 (reported on 10.8% of returns)
Here:
+$4,088
State:
+$11,172
(% of AGI for various income ranges: 25.3% for AGIs below $25k, 52.5% for AGIs $25k-50k, 390.0% for AGIs $75k-100k)
Taxable individual retirement arrangement distribution: $16,208 (reported on 17.6% of returns)
48635:
$16,208
Michigan:
$19,803
(% of AGI for various income ranges: 98.9% for AGIs below $25k, 326.9% for AGIs $25k-50k, 834.0% for AGIs $75k-100k, 1958.0% for AGIs $100k-200k)
Taxes paid: $5,900 (reported on 2.7% of returns)
48635:
$5,900
State:
$7,972
(% of AGI for various income ranges: 62.1% for AGIs below $25k)
Earned income credit: $2,180 (reported on 13.5% of returns)
Here:
$2,180
State:
$2,251
(% of AGI for various income ranges: 72.1% for AGIs below $25k, 50.6% for AGIs $25k-50k)
Percentage of individuals using paid preparers for their 2020 taxes: 93.2%
Here:
93%
State:
93%
(% for various income ranges: 92.6% for AGIs below $25k, 95.2% for AGIs $25k-50k, 88.9% for AGIs $50k-75k, 100.0% for AGIs $75k-100k, 88.9% for AGIs $100k-200k)
Averages for the 2012 tax year for zip code 48635, filed in 2013:
Average Adjusted Gross Income (AGI) in 2012: $34,935 (Individual Income Tax Returns)
Here:
$34,935
State:
$55,609
Salary/wage: $25,891 (reported on 66.2% of returns)
Here:
$25,891
State:
$46,782
(% of AGI for various income ranges: 51.8% for AGIs below $25k, 48.9% for AGIs $25k-50k, 50.8% for AGIs $50k-75k, 46.8% for AGIs $75k-100k, 45.7% for AGIs $100k-200k)
Taxable interest for individuals: $792 (reported on 36.6% of returns)
This zip code:
$792
Michigan:
$1,491
(% of AGI for various income ranges: 1.6% for AGIs below $25k, 1.0% for AGIs $25k-50k, 0.6% for AGIs $50k-75k, 0.9% for AGIs $75k-100k)
Ordinary dividends: $1,800 (reported on 19.7% of returns)
Here:
$1,800
State:
$6,225
(% of AGI for various income ranges: 2.4% for AGIs below $25k, 0.7% for AGIs $25k-50k, 0.4% for AGIs $50k-75k, 1.9% for AGIs $75k-100k)
Net capital gain/loss in AGI: +$1,650 (reported on 14.1% of returns)
Here:
+$1,650
State:
+$9,326
(% of AGI for various income ranges: 1.2% for AGIs $25k-50k, 2.2% for AGIs $75k-100k)
Profit/loss from business: +$4,820 (reported on 14.1% of returns)
Here:
+$4,820
State:
+$11,523
(% of AGI for various income ranges: 4.9% for AGIs below $25k, 1.4% for AGIs $25k-50k, 3.0% for AGIs $50k-75k)
Taxable individual retirement arrangement distribution: $10,242 (reported on 16.9% of returns)
48635:
$10,242
Michigan:
$15,298
(% of AGI for various income ranges: 4.3% for AGIs below $25k, 4.0% for AGIs $25k-50k, 4.0% for AGIs $50k-75k, 12.5% for AGIs $75k-100k)
Total itemized deductions: $15,885 (26% of AGI, reported on 18.3% of returns)
Here:
$15,885
State:
$21,628
Here:
26.3% of AGI
State:
18.4% of AGI
(% of AGI for various income ranges: 12.4% for AGIs $25k-50k, 6.9% for AGIs $50k-75k, 19.2% for AGIs $75k-100k)
Charity contributions: $1,945 (reported on 15.5% of returns)
Here:
$1,945
State:
$4,225
(% of AGI for various income ranges: 0.6% for AGIs $25k-50k, 1.1% for AGIs $50k-75k, 2.4% for AGIs $75k-100k)
Taxes paid: $4,431 (reported on 18.3% of returns)
48635:
$4,431
State:
$8,327
(% of AGI for various income ranges: 2.8% for AGIs $25k-50k, 1.8% for AGIs $50k-75k, 6.5% for AGIs $75k-100k)
Earned income credit: $1,664 (reported on 19.7% of returns)
Here:
$1,664
State:
$2,306
(% of AGI for various income ranges: 4.7% for AGIs below $25k, 0.6% for AGIs $25k-50k)
Percentage of individuals using paid preparers for their 2012 taxes: 60.6%
Here:
61%
State:
57%
(% for various income ranges: 55.9% for AGIs below $25k, 66.7% for AGIs $25k-50k, 63.6% for AGIs $50k-75k, 100.0% for AGIs $75k-100k)
Averages for the 2004 tax year for zip code 48635, filed in 2005:
Average Adjusted Gross Income (AGI) in 2004: $29,528 (Individual Income Tax Returns)
Here:
$29,528
State:
$48,204
Salary/wage: $23,242 (reported on 76.1% of returns)
Here:
$23,242
State:
$42,791
(% of AGI for various income ranges: 81.2% for AGIs below $10k, 57.1% for AGIs $10k-25k, 60.3% for AGIs $25k-50k, 60.7% for AGIs $50k-75k, 73.1% for AGIs $75k-100k, 42.6% for AGIs over 100k)
Taxable interest for individuals: $905 (reported on 49.5% of returns)
This zip code:
$905
Michigan:
$1,725
(% of AGI for various income ranges: 3.4% for AGIs below $10k, 2.6% for AGIs $10k-25k, 1.8% for AGIs $25k-50k, 0.9% for AGIs $50k-75k, 0.1% for AGIs $75k-100k, 1.0% for AGIs over 100k)
Taxable dividends: $1,121 (reported on 20.0% of returns)
Here:
$1,121
State:
$3,420
(% of AGI for various income ranges: 2.2% for AGIs below $10k, 1.2% for AGIs $10k-25k, 0.9% for AGIs $25k-50k, 0.5% for AGIs $50k-75k, 0.4% for AGIs $75k-100k)
Net capital gain/loss: +$655 (reported on 15.1% of returns)
Here:
+$655
State:
+$8,532
(% of AGI for various income ranges: -5.0% for AGIs below $10k, -0.2% for AGIs $10k-25k, -0.2% for AGIs $25k-50k, -0.4% for AGIs $50k-75k, 6.2% for AGIs over 100k)
Profit/loss from business: +$4,480 (reported on 16.2% of returns)
Here:
+$4,480
State:
+$9,547
(% of AGI for various income ranges: 11.6% for AGIs below $10k, 4.6% for AGIs $10k-25k, 3.7% for AGIs $25k-50k, 0.2% for AGIs $50k-75k)
IRA payment deduction: $1,900 (reported on 2.5% of returns)
48635:
$1,900
Michigan:
$2,875
Total itemized deductions: $14,374 (28% of AGI, reported on 21.8% of returns)
Here:
$14,374
State:
$18,509
Here:
27.6% of AGI
State:
20.7% of AGI
(% of AGI for various income ranges: 9.3% for AGIs $10k-25k, 10.3% for AGIs $25k-50k, 12.6% for AGIs $50k-75k, 14.1% for AGIs $75k-100k, 9.2% for AGIs over 100k)
Charity contributions deductions: $2,007 (4% of AGI, reported on 17.3% of returns)
Here:
$2,007
State:
$3,365
Here:
3.7% of AGI
State:
3.6% of AGI
(% of AGI for various income ranges: 1.1% for AGIs $10k-25k, 1.4% for AGIs $25k-50k, 1.3% for AGIs $50k-75k, 1.1% for AGIs $75k-100k, 0.8% for AGIs over 100k)
Total tax: $3,124 (reported on 72.0% of returns)
48635:
$3,124
State:
$7,691
(% of AGI for various income ranges: 2.5% for AGIs below $10k, 3.3% for AGIs $10k-25k, 6.3% for AGIs $25k-50k, 8.3% for AGIs $50k-75k, 10.7% for AGIs $75k-100k, 15.4% for AGIs over 100k)
Earned income credit: $1,643 (reported on 17.8% of returns)
Here:
$1,643
State:
$1,737
Percentage of individuals using paid preparers for their 2004 taxes: 66.0%
Here:
66%
State:
60%
(% for various income ranges: 58.0% for AGIs below $10k, 63.4% for AGIs $10k-25k, 73.4% for AGIs $25k-50k, 72.4% for AGIs $50k-75k, 55.2% for AGIs $75k-100k, 81.0% for AGIs over 100k)
Household received Food Stamps/SNAP in the past 12 months: 97 Household did not receive Food Stamps/SNAP in the past 12 months: 648
Women who had a birth in the past 12 months: 2 (2 now married, 0 unmarried) Women who did not have a birth in the past 12 months: 207 (74 now married, 133 unmarried)
Housing units in zip code 48635 with a mortgage: 298 (24 second mortgage, 22 both second mortgage and home equity loan) Houses without a mortgage: 13
Median monthly owner costs for units with a mortgage: $1,007 Median monthly owner costs for units without a mortgage: $444
Residents with income below the poverty level in 2022:
This zip code:
14.1%
Whole state:
13.4%
Residents with income below 50% of the poverty level in 2022:
This zip code:
8.7%
Whole state:
6.9%
Median number of rooms in houses and condos:
Here:
5.5
State:
6.5
Median number of rooms in apartments:
Here:
5.3
State:
4.3
Notable locations in this zip code not listed on our city pages
Notable locations in zip code 48635: Rifle River Ranch Rustic Campground (A), Rifle River Spruce Rustic Campground (B), Rifle River Grousehaven Lake Campground (C), Rifle River Devoe Lake Rustic Campground (D), Lost Valley Campgrounds (E), Greenbriar Golf Course (F), Chief Okemus Camp (G), Lupton Fire Department (H), Rose Township Hall (I). Display/hide their locations on the map
Lakes and swamps: Twin Lakes (A), Little Williams Lake (B), Little Norway Lake (C), Bass Lake (D), Darlyn Lake (E), Devoe Lake (F), George Lake (G), Grebe Lake (H). Display/hide their locations on the map
Parks in zip code 48635 include: Rifle River State Recreation Area (1), Rose Township District Number Five School Historical Marker (2). Display/hide their locations on the map
Size of family households: 383 2-persons, 53 3-persons, 33 4-persons, 27 5-persons, 11 6-persons, 11 7-or-more-persons
Size of nonfamily households: 191 1-person, 28 2-persons, 10 3-persons
87 married couples with children.
61 single-parent households (11 men, 50 women).
98.2% of residents of 48635 zip code speak English at home.
1.1% of residents speak Spanish at home (88% very well, 12% well).
0.8% of residents speak other Indo-European language at home (67% very well, 33% not well).
0.4% of residents speak other language at home (100% very well).
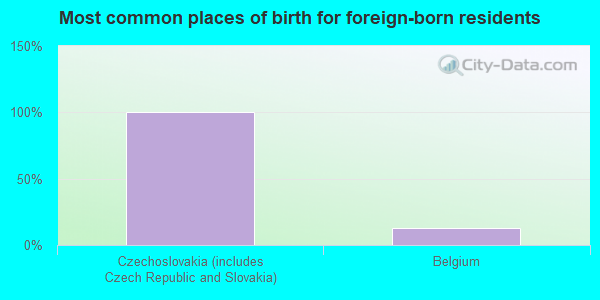
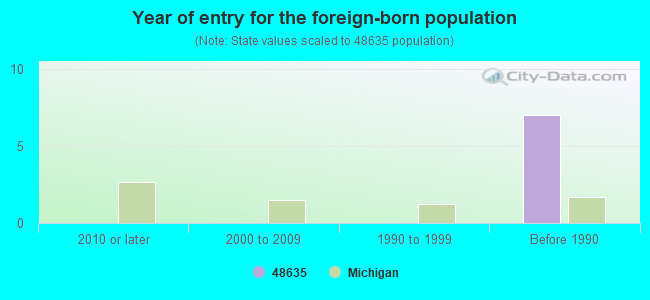
Foreign born population: 8 (0.5%) (100.0% of them are naturalized citizens)
This zip code:
0.5%
Whole state:
6.9%
100%Czechoslovakia (includes Czech Republic and Slovakia)
12%Belgium
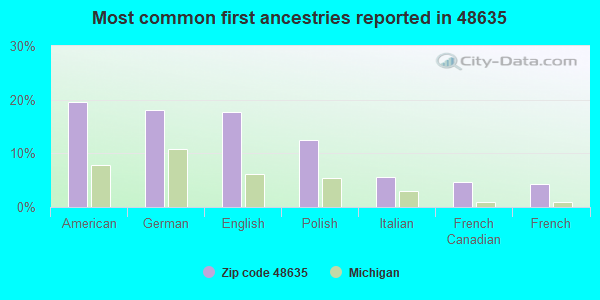
20%American
18%German
18%English
12%Polish
6%Italian
5%French Canadian
4%French
Year of entry for the foreign-born population
02010 or later
02000 to 2009
01990 to 1999
7Before 1990
Facilities with environmental interests located in this zip code:
EDNA WILLIAMS ESTATE (2962 E ROSE CITY ROAD in LUPTON, MI)
(Resource Conservation and Recovery Act (tracking hazardous waste))
MI DEPT/ENVIRONMENTAL QUALITY (3337 MAIN STREET in LUPTON, MI)
Conditionally Exempt Small Quantity Generators, less than 100 kg/month of hazardous waste (Resource Conservation and Recovery Act (tracking hazardous waste)) Organizations: MI DEPT NATURAL RESOURCES (CONTACT/OPERATOR)
Alternative names: MI/DEPT ENVIRONMENTAL QUALITY RRD
Housing units lacking complete plumbing facilities: 4.3% Housing units lacking complete kitchen facilities: 3.2%
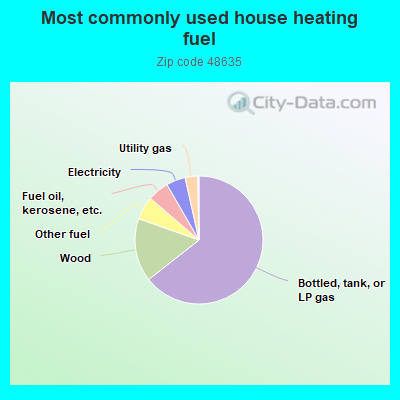
64.8%Bottled, tank, or LP gas
16.1%Wood
5.9%Other fuel
5.4%Fuel oil, kerosene, etc.
4.9%Electricity
3.2%Utility gas
Population in 1990: 1,784. Population change in the 1990s: +55 (+3.1%).
Place of birth for U.S.-born residents:
This state: 1,443
Northeast: 32
Midwest: 28
South: 59
West: 29
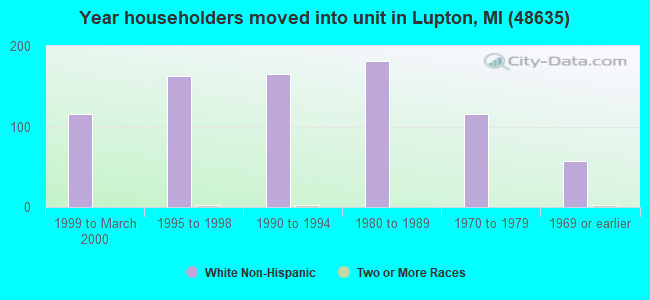
63% of the 48635 zip code residents lived in the same house 5 years ago. Out of people who lived in different houses, 33% lived in this county. Out of people who lived in different counties, 50% lived in Michigan.
91% of the 48635 zip code residents lived in the same house 1 year ago. Out of people who lived in different houses, 17% moved from this county. Out of people who lived in different houses, 62% moved from different county within same state. Out of people who lived in different houses, 22% moved from different state.
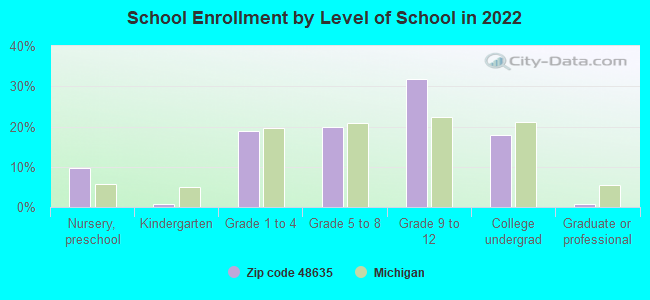
Private vs. public school enrollment:
Students in private schools in grades 1 to 8 (elementary and middle school): 6
Here:
7.2%
Michigan:
12.4%
Students in private schools in grades 9 to 12 (high school): 17
Here:
22.5%
Michigan:
9.8%
Students in private undergraduate colleges:
Here:
0.0%
Michigan:
14.9%
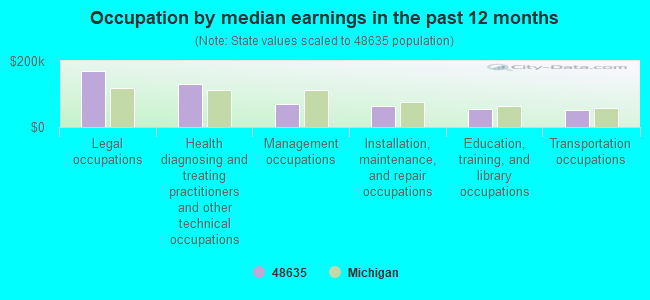
Occupation by median earnings in the past 12 months ($)
170,892Legal occupations
131,475Health diagnosing and treating practitioners and other technical occupations
68,711Management occupations
63,400Installation, maintenance, and repair occupations
55,556Education, training, and library occupations
52,299Transportation occupations
Top industries in this zip code by the number of employees in 2005:
Real Estate and Rental and Leasing: Truck, Utility Trailer, and RV (Recreational Vehicle) Rental and Leasing (5-9: 1)
Construction: New Housing Operative Builders (5-9: 1)
Other Services (except Public Administration): General Automotive Repair (1-4: 2)
Accommodation and Food Services: Recreational and Vacation Camps (except Campgrounds) (1-4: 2)
Construction: New Single-Family Housing Construction (except Operative Builders) (1-4: 2)
People in group quarters in 2000:
10 people in other group homes
4 people in homes or halfway houses for drug/alcohol abuse
Fatal accident statistics in 2011:
Fatal accident count: 1
Vehicles involved in fatal accidents: 1
Fatal accidents caused by drunken drivers: 0
Fatalities: 1
Persons involved in fatal accidents: 1
Pedestrians involved in fatal accidents: 0
Fatal accident statistics in 2010:
Fatal accident count: 1
Vehicles involved in fatal accidents: 2
Fatal accidents caused by drunken drivers: 0
Fatalities: 1
Persons involved in fatal accidents: 3
Pedestrians involved in fatal accidents: 0
2002 - 2018 National Fire Incident Reporting System (NFIRS) incidents
According to the data from the years 2002 - 2018 the average number of fire incidents per year is 10. The highest number of fires - 23 took place in 2003, and the least - 1 in 2018. The data has a dropping trend.
When looking into fire subcategories, the most incidents belonged to: Structure Fires (51.8%), and Outside Fires (33.7%).
Fire incident types reported to NFIRS in Zip Code 48635
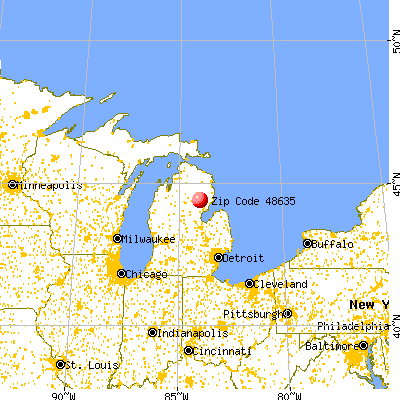


 Nearest zip codes: 48743, 48739, 48756, 48654, 48761, 48770.


 According to the data from the years 2002 - 2018 the average number of fire incidents per year is 10. The highest number of fires - 23 took place in 2003, and the least - 1 in 2018. The data has a dropping trend.
 When looking into fire subcategories, the most incidents belonged to: Structure Fires (51.8%), and Outside Fires (33.7%).