Estimated zip code population in 2022: 40,658 Zip code population in 2010: 40,111 Zip code population in 2000: 40,020
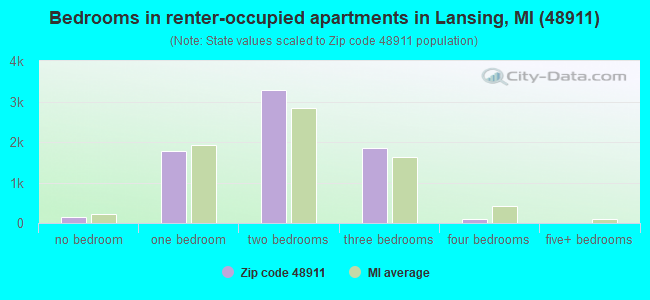
Houses and condos: 18,107 Renter-occupied apartments: 7,196
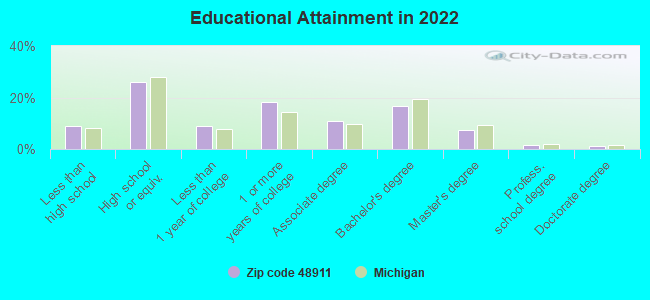
% of renters here:
43%
State:
27%
March 2022 cost of living index in zip code 48911: 83.7 (less than average, U.S. average is 100)
Land area: 15.9 sq. mi. Water area: 0.3 sq. mi.
Population density: 2,556 people per square mile
(average).
OSM Map
General Map
Google Map
MSN Map
OSM Map
General Map
Google Map
MSN Map
OSM Map
General Map
Google Map
MSN Map
OSM Map
General Map
Google Map
MSN Map
Please wait while loading the map...
Real estate property taxes paid for housing units in 2022:
This zip code:
2.0% ($2,700)
Michigan:
1.2% ($2,746)
Median real estate property taxes paid for housing units with mortgages in 2022: $2,774 (1.9%) Median real estate property taxes paid for housing units with no mortgage in 2022: $2,613 (2.1%)
Averages for the 2020 tax year for zip code 48911, filed in 2021:
Average Adjusted Gross Income (AGI) in 2020: $42,790 (Individual Income Tax Returns)
Here:
$42,790
State:
$68,945
Salary/wage: $37,846 (reported on 80.2% of returns)
Here:
$37,846
State:
$57,142
(% of AGI for various income ranges: 998.9% for AGIs below $25k, 3351.9% for AGIs $25k-50k, 6358.3% for AGIs $50k-75k, 9313.8% for AGIs $75k-100k, 17053.1% for AGIs $100k-200k, 54031.4% for AGIs over 200k)
Taxable interest for individuals: $694 (reported on 20.7% of returns)
This zip code:
$694
Michigan:
$1,630
(% of AGI for various income ranges: 5.3% for AGIs below $25k, 7.4% for AGIs $25k-50k, 23.4% for AGIs $50k-75k, 29.8% for AGIs $75k-100k, 88.0% for AGIs $100k-200k, 1085.7% for AGIs over 200k)
Ordinary dividends: $3,120 (reported on 7.9% of returns)
Here:
$3,120
State:
$6,972
(% of AGI for various income ranges: 5.8% for AGIs below $25k, 13.1% for AGIs $25k-50k, 34.8% for AGIs $50k-75k, 48.8% for AGIs $75k-100k, 194.8% for AGIs $100k-200k, 1815.7% for AGIs over 200k)
Net capital gain/loss in AGI: +$7,007 (reported on 7.2% of returns)
Here:
+$7,007
State:
+$20,064
(% of AGI for various income ranges: 3.1% for AGIs below $25k, 9.4% for AGIs $25k-50k, 22.0% for AGIs $50k-75k, 77.4% for AGIs $75k-100k, 251.1% for AGIs $100k-200k, 8987.1% for AGIs over 200k)
Profit/loss from business: +$5,449 (reported on 14.4% of returns)
Here:
+$5,449
State:
+$11,172
(% of AGI for various income ranges: 57.8% for AGIs below $25k, 39.3% for AGIs $25k-50k, 94.9% for AGIs $50k-75k, 160.6% for AGIs $75k-100k, 411.0% for AGIs $100k-200k, 5181.4% for AGIs over 200k)
Taxable individual retirement arrangement distribution: $13,936 (reported on 5.1% of returns)
48911:
$13,936
Michigan:
$19,803
(% of AGI for various income ranges: 23.9% for AGIs below $25k, 36.2% for AGIs $25k-50k, 124.0% for AGIs $50k-75k, 268.5% for AGIs $75k-100k, 581.3% for AGIs $100k-200k, 2500.0% for AGIs over 200k)
Self-employed (Keogh) retirement plans: $24,400 (reported on 0.1% of returns)
48911:
$24,400
Michigan:
$25,132
(% of AGI for various income ranges: 57.4% for AGIs $75k-100k)
Total itemized deductions: $29,491 (reported on 3.4% of returns)
Here:
$29,491
State:
$34,117
(% of AGI for various income ranges: 23.7% for AGIs below $25k, 52.1% for AGIs $25k-50k, 142.6% for AGIs $50k-75k, 293.2% for AGIs $75k-100k, 618.9% for AGIs $100k-200k, 8287.1% for AGIs over 200k)
Charity contributions: $12,140 (reported on 2.7% of returns)
Here:
$12,140
State:
$13,548
(% of AGI for various income ranges: 2.4% for AGIs below $25k, 10.5% for AGIs $25k-50k, 42.6% for AGIs $50k-75k, 92.0% for AGIs $75k-100k, 254.8% for AGIs $100k-200k, 3180.0% for AGIs over 200k)
Taxes paid: $7,011 (reported on 3.4% of returns)
48911:
$7,011
State:
$7,972
(% of AGI for various income ranges: 3.0% for AGIs below $25k, 11.0% for AGIs $25k-50k, 41.0% for AGIs $50k-75k, 92.5% for AGIs $75k-100k, 191.4% for AGIs $100k-200k, 1264.3% for AGIs over 200k)
Earned income credit: $2,406 (reported on 24.5% of returns)
Here:
$2,406
State:
$2,251
(% of AGI for various income ranges: 114.3% for AGIs below $25k, 93.3% for AGIs $25k-50k, 1.6% for AGIs $50k-75k)
Percentage of individuals using paid preparers for their 2020 taxes: 92.6%
Here:
93%
State:
93%
(% for various income ranges: 92.2% for AGIs below $25k, 93.7% for AGIs $25k-50k, 92.6% for AGIs $50k-75k, 91.3% for AGIs $75k-100k, 90.8% for AGIs $100k-200k, 90.5% for AGIs over 200k)
Averages for the 2012 tax year for zip code 48911, filed in 2013:
Average Adjusted Gross Income (AGI) in 2012: $36,043 (Individual Income Tax Returns)
Here:
$36,043
State:
$55,609
Salary/wage: $31,607 (reported on 85.0% of returns)
Here:
$31,607
State:
$46,782
(% of AGI for various income ranges: 73.0% for AGIs below $25k, 77.5% for AGIs $25k-50k, 77.4% for AGIs $50k-75k, 75.5% for AGIs $75k-100k, 75.5% for AGIs $100k-200k, 50.8% for AGIs over 200k)
Taxable interest for individuals: $756 (reported on 21.9% of returns)
This zip code:
$756
Michigan:
$1,491
(% of AGI for various income ranges: 0.5% for AGIs below $25k, 0.3% for AGIs $25k-50k, 0.6% for AGIs $50k-75k, 0.3% for AGIs $75k-100k, 0.5% for AGIs $100k-200k, 0.6% for AGIs over 200k)
Ordinary dividends: $2,850 (reported on 8.6% of returns)
Here:
$2,850
State:
$6,225
(% of AGI for various income ranges: 0.4% for AGIs below $25k, 0.3% for AGIs $25k-50k, 0.4% for AGIs $50k-75k, 0.7% for AGIs $75k-100k, 1.2% for AGIs $100k-200k, 2.4% for AGIs over 200k)
Net capital gain/loss in AGI: +$2,362 (reported on 6.1% of returns)
Here:
+$2,362
State:
+$9,326
(% of AGI for various income ranges: 0.1% for AGIs $50k-75k, 0.3% for AGIs $75k-100k, 0.7% for AGIs $100k-200k, 4.7% for AGIs over 200k)
Profit/loss from business: +$7,414 (reported on 13.2% of returns)
Here:
+$7,414
State:
+$11,523
(% of AGI for various income ranges: 7.3% for AGIs below $25k, 1.2% for AGIs $25k-50k, 1.2% for AGIs $50k-75k, 1.5% for AGIs $75k-100k, 1.7% for AGIs $100k-200k, 7.1% for AGIs over 200k)
Taxable individual retirement arrangement distribution: $11,857 (reported on 5.8% of returns)
48911:
$11,857
Michigan:
$15,298
(% of AGI for various income ranges: 1.3% for AGIs below $25k, 1.4% for AGIs $25k-50k, 1.6% for AGIs $50k-75k, 2.2% for AGIs $75k-100k, 3.3% for AGIs $100k-200k, 2.3% for AGIs over 200k)
Self-employment retirement plans: $17,033 (reported on 0.2% of returns)
48911:
$17,033
Michigan:
$20,834
Total itemized deductions: $17,497 (24% of AGI, reported on 22.3% of returns)
Here:
$17,497
State:
$21,628
Here:
24.2% of AGI
State:
18.4% of AGI
(% of AGI for various income ranges: 5.9% for AGIs below $25k, 8.9% for AGIs $25k-50k, 11.5% for AGIs $50k-75k, 13.5% for AGIs $75k-100k, 14.4% for AGIs $100k-200k, 14.1% for AGIs over 200k)
Charity contributions: $3,728 (reported on 17.6% of returns)
Here:
$3,728
State:
$4,225
(% of AGI for various income ranges: 0.7% for AGIs below $25k, 1.2% for AGIs $25k-50k, 2.0% for AGIs $50k-75k, 2.1% for AGIs $75k-100k, 3.0% for AGIs $100k-200k, 3.1% for AGIs over 200k)
Taxes paid: $6,034 (reported on 22.1% of returns)
48911:
$6,034
State:
$8,327
(% of AGI for various income ranges: 1.3% for AGIs below $25k, 2.5% for AGIs $25k-50k, 3.9% for AGIs $50k-75k, 4.8% for AGIs $75k-100k, 6.0% for AGIs $100k-200k, 6.2% for AGIs over 200k)
Earned income credit: $2,509 (reported on 29.4% of returns)
Here:
$2,509
State:
$2,306
(% of AGI for various income ranges: 9.8% for AGIs below $25k, 1.4% for AGIs $25k-50k)
Percentage of individuals using paid preparers for their 2012 taxes: 51.4%
Here:
51%
State:
57%
(% for various income ranges: 50.3% for AGIs below $25k, 51.7% for AGIs $25k-50k, 51.6% for AGIs $50k-75k, 54.5% for AGIs $75k-100k, 53.9% for AGIs $100k-200k, 72.7% for AGIs over 200k)
Averages for the 2004 tax year for zip code 48911, filed in 2005:
Average Adjusted Gross Income (AGI) in 2004: $33,931 (Individual Income Tax Returns)
Here:
$33,931
State:
$48,204
Salary/wage: $31,358 (reported on 89.1% of returns)
Here:
$31,358
State:
$42,791
(% of AGI for various income ranges: 94.7% for AGIs below $10k, 79.4% for AGIs $10k-25k, 84.8% for AGIs $25k-50k, 84.4% for AGIs $50k-75k, 83.6% for AGIs $75k-100k, 74.5% for AGIs over 100k)
Taxable interest for individuals: $1,049 (reported on 31.7% of returns)
This zip code:
$1,049
Michigan:
$1,725
(% of AGI for various income ranges: 2.4% for AGIs below $10k, 1.2% for AGIs $10k-25k, 0.8% for AGIs $25k-50k, 0.7% for AGIs $50k-75k, 0.6% for AGIs $75k-100k, 1.6% for AGIs over 100k)
Taxable dividends: $1,648 (reported on 12.3% of returns)
Here:
$1,648
State:
$3,420
(% of AGI for various income ranges: 1.0% for AGIs below $10k, 0.4% for AGIs $10k-25k, 0.4% for AGIs $25k-50k, 0.4% for AGIs $50k-75k, 0.4% for AGIs $75k-100k, 1.4% for AGIs over 100k)
Net capital gain/loss: +$2,790 (reported on 8.3% of returns)
Here:
+$2,790
State:
+$8,532
(% of AGI for various income ranges: -1.0% for AGIs below $10k, -0.1% for AGIs $10k-25k, 0.1% for AGIs $25k-50k, 0.4% for AGIs $50k-75k, 0.6% for AGIs $75k-100k, 3.2% for AGIs over 100k)
Profit/loss from business: +$5,216 (reported on 11.2% of returns)
Here:
+$5,216
State:
+$9,547
(% of AGI for various income ranges: 5.4% for AGIs below $10k, 2.8% for AGIs $10k-25k, 0.6% for AGIs $25k-50k, 1.1% for AGIs $50k-75k, 0.8% for AGIs $75k-100k, 3.9% for AGIs over 100k)
IRA payment deduction: $2,196 (reported on 1.2% of returns)
48911:
$2,196
Michigan:
$2,875
(% of AGI for various income ranges: 0.1% for AGIs $10k-25k, 0.1% for AGIs $25k-50k, 0.1% for AGIs $50k-75k, 0.1% for AGIs $75k-100k, 0.1% for AGIs over 100k)
Self-employed pension: $10,300 (reported on 0.2% of returns)
Here:
$10,300
Michigan:
$13,826
Total itemized deductions: $15,291 (25% of AGI, reported on 29.8% of returns)
Here:
$15,291
State:
$18,509
Here:
24.8% of AGI
State:
20.7% of AGI
(% of AGI for various income ranges: 7.8% for AGIs below $10k, 6.5% for AGIs $10k-25k, 11.8% for AGIs $25k-50k, 15.5% for AGIs $50k-75k, 16.7% for AGIs $75k-100k, 17.5% for AGIs over 100k)
Charity contributions deductions: $3,085 (5% of AGI, reported on 25.5% of returns)
Here:
$3,085
State:
$3,365
Here:
4.8% of AGI
State:
3.6% of AGI
(% of AGI for various income ranges: 0.6% for AGIs below $10k, 0.9% for AGIs $10k-25k, 1.8% for AGIs $25k-50k, 2.7% for AGIs $50k-75k, 3.1% for AGIs $75k-100k, 3.6% for AGIs over 100k)
Total tax: $4,136 (reported on 68.5% of returns)
48911:
$4,136
State:
$7,691
(% of AGI for various income ranges: 2.2% for AGIs below $10k, 3.5% for AGIs $10k-25k, 6.4% for AGIs $25k-50k, 8.6% for AGIs $50k-75k, 9.9% for AGIs $75k-100k, 15.4% for AGIs over 100k)
Earned income credit: $1,792 (reported on 23.0% of returns)
Here:
$1,792
State:
$1,737
Percentage of individuals using paid preparers for their 2004 taxes: 54.9%
Here:
55%
State:
60%
(% for various income ranges: 51.8% for AGIs below $10k, 57.1% for AGIs $10k-25k, 53.2% for AGIs $25k-50k, 56.9% for AGIs $50k-75k, 56.2% for AGIs $75k-100k, 60.2% for AGIs over 100k)
Likely homosexual households (counted as self-reported same-sex unmarried-partner households)
Lesbian couples: 0.0% of all households
Gay men: 0.6% of all households
Household received Food Stamps/SNAP in the past 12 months: 3,525 Household did not receive Food Stamps/SNAP in the past 12 months: 13,483
Women who had a birth in the past 12 months: 505 (204 now married, 291 unmarried) Women who did not have a birth in the past 12 months: 10,127 (3,431 now married, 6,709 unmarried)
Housing units in zip code 48911 with a mortgage: 6,007 (332 second mortgage, 279 both second mortgage and home equity loan) Houses without a mortgage: 74
Median monthly owner costs for units with a mortgage: $1,241 Median monthly owner costs for units without a mortgage: $586
Residents with income below the poverty level in 2022:
This zip code:
17.1%
Whole state:
13.4%
Residents with income below 50% of the poverty level in 2022:
This zip code:
10.5%
Whole state:
6.9%
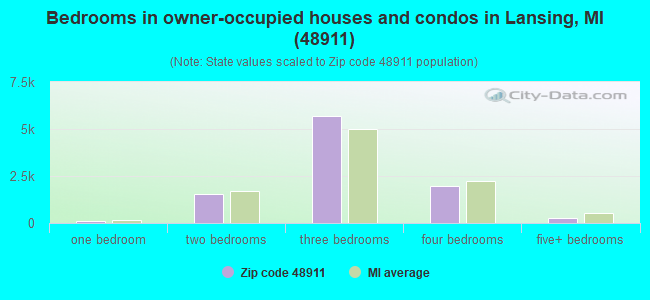
Median number of rooms in houses and condos:
Here:
6.3
State:
6.5
Median number of rooms in apartments:
Here:
4.3
State:
4.3
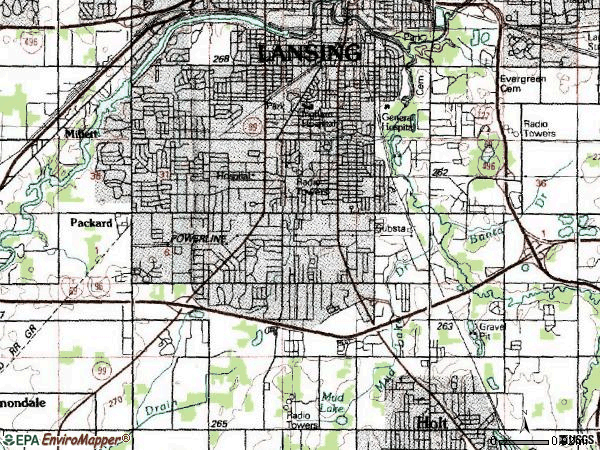
Notable locations in this zip code not listed on our city pages
Notable locations in zip code 48911: Lansing Country Club (A), Chisholm Hills Country Club (B), Lansing Cottonwood Campground (C), Delhi Charter Township Fire Department Station 2 (D), Lansing Fire and Rescue Station 4 (E), Lansing Fire and Rescue Station 6 (F). Display/hide their locations on the map
Churches in zip code 48911 include: Saint Michael Church (A), Child Evangelism Fellowship Church (B), Holt Christian Church (C), South Lansing Christian Church (D), Trinity Church (E), Sycamore Creek United Methodist Church (F), Cristo Rey Parish Church (G), Ebeneezer House (H), Saint Andrew Dung Lac Church (I). Display/hide their locations on the map
Parks in zip code 48911 include: Roswell Everett House Historical Marker (1), Trinity African Methodist Episcopal Church Historical Marker (2), Marscot Park (3), Hope Soccer Complex (4), Bluebell Park (5), Beck Park (6), Georgetown Park (7), Attwood Park (8), Graves Park (9). Display/hide their locations on the map
5,217 married couples with children.
3,862 single-parent households (1,046 men, 2,816 women).
85.7% of residents of 48911 zip code speak English at home.
3.5% of residents speak Spanish at home (69% very well, 28% well, 2% not well, 1% not at all).
4.1% of residents speak other Indo-European language at home (44% very well, 21% well, 32% not well, 4% not at all).
3.8% of residents speak Asian or Pacific Island language at home (59% very well, 25% well, 11% not well, 5% not at all).
3.0% of residents speak other language at home (42% very well, 40% well, 15% not well, 3% not at all).
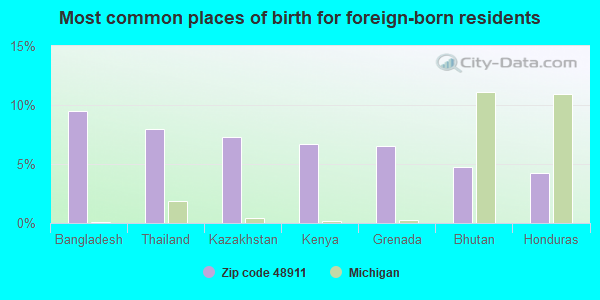
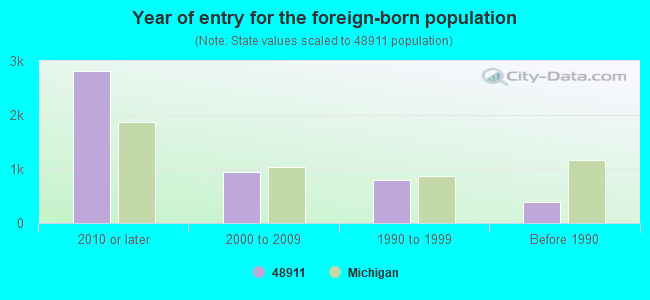
Foreign born population: 4,309 (10.6%) (50.2% of them are naturalized citizens)
Major facilities with environmental interests located in this zip code:
BARNE AEROSPACE LANSING DIVISION (5300 AURELIUS RD. in LANSING, MI)
CRITERIA AND HAZARDOUS AIR POLLUTANT INVENTORY (Inventory of air pollution sources) HAZARDOUS WASTE BIENNIAL REPORTER (Resource Conservation and Recovery Act (tracking hazardous waste)) - ICIS-, ENFORCEMENT/COMPLIANCE ACTIVITY Large Quantity Generators, more that 1000 kg of hazardous waste/month (Resource Conservation and Recovery Act (tracking hazardous waste)) - notification - ICIS-, ENFORCEMENT/COMPLIANCE ACTIVITY TRI REPORTER (Tracking of toxic chemicals releasing facilities) Business SIC classification: AIRCRAFT; AIRCRAFT PARTS AND AUXILIARY EQUIPMENT Business NAICS classification: AIRCRAFT ENGINE AND ENGINE PARTS MANUFACTURING. Organizations: BARNES GROUP, INC. (CONTACT/OPERATOR)
Alternative names: BARNES AEROSPACE LANSING DIV., BARNES AEROSPACEW/BARNES GROUP, JET DIE & ENGINEERING INC
ATTWOOD SCHOOL (915 ATTWOOD DRIVE in LANSING, MI)
(Geographic Names Information System) (National Center for Education Statistics) - STATE ID-00144 Organizations: LANSING PUBLIC SCHOOL DISTRICT (SCHOOL DISTRICT)
FORREST G. AVERILL SCHOOL (3201 AVERILL DRIVE in LANSING, MI)
(National Center for Education Statistics) - STATE ID-01270 Organizations: LANSING PUBLIC SCHOOL DISTRICT (SCHOOL DISTRICT)
GARDNER MIDDLE SCHOOL (333 DAHLIA DRIVE in LANSING, MI)
(National Center for Education Statistics) - STATE ID-05696 Organizations: LANSING PUBLIC SCHOOL DISTRICT (SCHOOL DISTRICT)
DWIGHT RICH MIDDLE SCHOOL (2600 HAMPDEN DRIVE in LANSING, MI)
(National Center for Education Statistics) - STATE ID-05068 Organizations: LANSING PUBLIC SCHOOL DISTRICT (SCHOOL DISTRICT)
ENSCO ENPAK FIELD SERVICE (5303 SOUTH CEDAR (GARAGE AREA) in LANSING, MI)
(Resource Conservation and Recovery Act (tracking hazardous waste)) Alternative names: ENSCO FIELD SERVICES
ALL STAR PRINTING INC (3101 PINETREE RD in LANSING, MI)
(Resource Conservation and Recovery Act (tracking hazardous waste)) Organizations: DUWECK MIKE AND MCVICKER DOUG (CONTACT/OWNER)
AURELIUS ROAD LANDFILL (5801 AURELIUS RD in LANSING, MI)
(Resource Conservation and Recovery Act (tracking hazardous waste)) Organizations: CITY OF LANSING (CONTACT/OWNER)
GREAT LAKES WOOD CORP (5507 S CEDAR in LANSING, MI)
Small Quantity Generators, between 100 kg and 1000 kg of hazardous waste/month (Resource Conservation and Recovery Act (tracking hazardous waste)) - notification Organizations: CROWLEY M J (CONTACT/OWNER)
ALTA LIFT TRUCK SERVICES INC (5635 COMMERCE ST. in LANSING, MI)
Conditionally Exempt Small Quantity Generators, less than 100 kg/month of hazardous waste (Resource Conservation and Recovery Act (tracking hazardous waste)) Organizations: STEVEN W GREENAWALT (CONTACT/OPERATOR)
BALZERS INC (3130 SOVERIEGN DRIVE in LANSING, MI)
Conditionally Exempt Small Quantity Generators, less than 100 kg/month of hazardous waste (Resource Conservation and Recovery Act (tracking hazardous waste)) Organizations: BALZERS AG (OERLIKEN-BURHLE) (CONTACT/OPERATOR)
Alternative names: BALZERS TOOL COATING
BILL SNETHKAMP LANSING DODGE-SAAB INC (6131 S PENNSYLVANIA AVE in LANSING, MI)
Small Quantity Generators, between 100 kg and 1000 kg of hazardous waste/month (Resource Conservation and Recovery Act (tracking hazardous waste)) - notification Organizations: SNETHKAMP WILLIAM E (CONTACT/OPERATOR)
Alternative names: SNETHKAMPS BILL LANSING CHRYSLER
BOBCAT CENTRAL INC (3237 W MILLER RD in LANSING, MI)
Conditionally Exempt Small Quantity Generators, less than 100 kg/month of hazardous waste (Resource Conservation and Recovery Act (tracking hazardous waste)) Organizations: CARL C WILCOX JR (CONTACT/OPERATOR)
Housing units lacking complete plumbing facilities: 0.4% Housing units lacking complete kitchen facilities: 0.7%
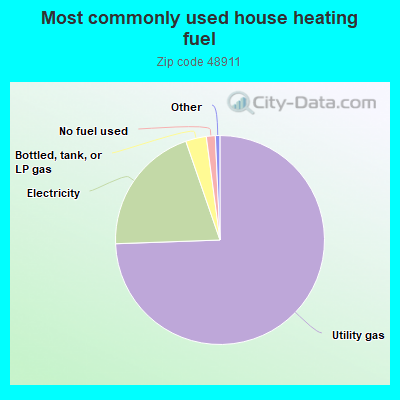
74.5%Utility gas
20.3%Electricity
3.2%Bottled, tank, or LP gas
1.4%No fuel used
Population in 1990: 39,930. Population change in the 1990s: +90 (+0.2%).
Place of birth for U.S.-born residents:
This state: 29,234
Northeast: 768
Midwest: 2,681
South: 2,389
West: 805
50% of the 48911 zip code residents lived in the same house 5 years ago. Out of people who lived in different houses, 61% lived in this county. Out of people who lived in different counties, 50% lived in Michigan.
90% of the 48911 zip code residents lived in the same house 1 year ago. Out of people who lived in different houses, 60% moved from this county. Out of people who lived in different houses, 24% moved from different county within same state. Out of people who lived in different houses, 15% moved from different state.
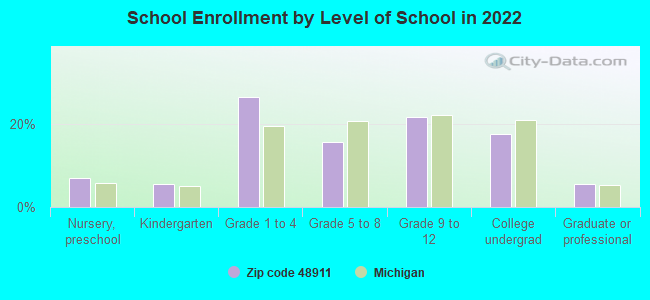
Private vs. public school enrollment:
Students in private schools in grades 1 to 8 (elementary and middle school): 676
Here:
15.1%
Michigan:
12.4%
Students in private schools in grades 9 to 12 (high school): 61
Here:
2.7%
Michigan:
9.8%
Students in private undergraduate colleges: 144
Here:
7.7%
Michigan:
14.9%
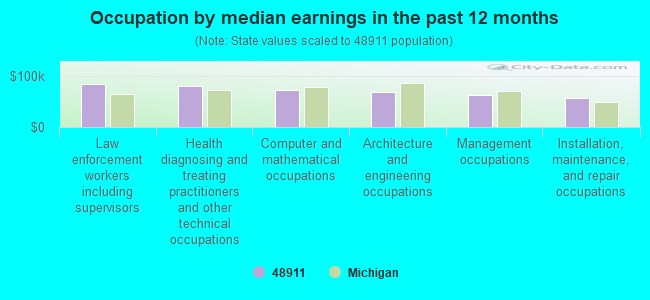
Occupation by median earnings in the past 12 months ($)
83,424Law enforcement workers including supervisors
79,173Health diagnosing and treating practitioners and other technical occupations
72,680Computer and mathematical occupations
68,597Architecture and engineering occupations
61,725Management occupations
55,922Installation, maintenance, and repair occupations
Companies with biggest federal contracts located in this zip code (LANSING, MI):
HRU INC TECHNICAL RESOURCES (3451 DUNCKEL RD STE 200; small business) : $2,990,327 in 27 contractsfrom 2005 to 2006
Contracts for Engineering and Technical Services by Army Signed by year:2000: $0; 2001: $0; 2002: $0; 2003: $0; 2004: $0; 2005: $2,150,181; 2006: $840,146.
Biggest contracts:
$553,529 with Army for Engineering and Technical Services. Signed on 2005-09-21. Completion date: 2006-09-30.
$429,397, same as above.Signed on 2005-08-26. Completion date: 2006-09-30.
$260,687, same as above.Signed on 2005-08-30. Completion date: 2006-10-27.
$230,202, same as above.Signed on 2005-08-26. Completion date: 2006-09-30.
SNELL ENVIRONMENTAL GROUP, INC (1425 KEYSTONE AVENUE) : $1,232,210 in 24 contractsfrom 2000 to 2005
Contracts for Architect - Engineer Services (including landscaping, interior layout, and designing), Administrative and Service Buildings, A&E Management Engineering Services, Highways, Roads, Streets, Bridges, and Railways, and moreby Army, Navy Signed by year:2000: $562,419; 2001: $263,323; 2002: $0; 2003: $208,878; 2004: $0; 2005: $197,590; 2006: $0.
Biggest contracts:
$329,625 with Army for Architect - Engineer Services (including landscaping, interior layout, and designing). Signed on 2000-09-29. Completion date: 2001-07-30.
$197,590, same as above.Signed on 2005-09-30. Completion date: 2001-07-30.
$143,742, same as above.Signed on 2000-11-13. Completion date: 2001-09-28.
$139,314 with Army for Administrative and Service Buildings. Signed on 2001-07-09. Completion date: 2002-08-09.
BARNES GROUP INC (5300 AURELIUS RD; small business) 100 employees, $0 revenue. : $1,230,822 in 8 contractsfrom 1999 to 2005
Contracts for Gas Turbines and Jet Engines, Aircraft; Prime Moving, and Components by Defense Logistics Agency Signed by year:2000: $207,550; 2001: $80,000; 2002: $0; 2003: $0; 2004: $333,400; 2005: $491,272; 2006: $0.
Biggest contracts:
$247,900 with Defense Logistics Agency for Gas Turbines and Jet Engines, Aircraft; Prime Moving, and Components. Signed on 2004-09-24. Completion date: 2005-07-01.
$240,990, same as above.Signed on 2005-07-20. Completion date: 2005-10-12.
$207,550, same as above.Signed on 2000-12-22. Completion date: 2001-07-20.
$192,682, same as above.Signed on 2005-08-30. Completion date: 2006-01-17.
ADVANCED LODGING LLC (6501 SOUTH PENNSYLVANIA AV; small business) : $328,643 in 9 contractsfrom 1999 to 2001
Contracts for Lodging - Hotel/Motel by Army Signed by year:2000: $126,760; 2001: $113,751; 2002: $0; 2003: $0; 2004: $0; 2005: $0; 2006: $0.
Biggest contracts:
$59,486 with Army for Lodging - Hotel/Motel. Signed on 2001-04-24. Completion date: 2001-06-30.
$59,073, same as above.Signed on 2000-07-31. Completion date: 2000-09-30.
$54,265, same as above.Signed on 2001-01-03. Completion date: 2001-03-31.
$50,156, same as above.Signed on 2000-04-17. Completion date: 2000-06-30.
DLZ MICHIGAN, INC (1425 KEYSTONE AVENUE) : $267,637 in 6 contractsfrom 2002 to 2004
Contracts for Administrative and Service Buildings, Architect - Engineer Services (including landscaping, interior layout, and designing) by Army Signed by year:2000: $0; 2001: $0; 2002: $156,899; 2003: $41,353; 2004: $69,385; 2005: $0; 2006: $0.
Biggest contracts:
$130,832 with Army for Administrative and Service Buildings. Signed on 2002-04-17. Completion date: 2002-07-01.
$65,012, same as above.Signed on 2003-04-29. Completion date: 2003-07-15.
$58,834 with Army for Architect - Engineer Services (including landscaping, interior layout, and designing). Signed on 2004-09-22. Completion date: 2001-07-30.
$26,067 with Army for Administrative and Service Buildings. Signed on 2002-08-21. Completion date: 2002-10-15.
MIRAC INC (5700 EXECUTIVE DR STE 1) : $187,322 in 10 contractsfrom 2003 to 2006
Contracts for Lease or Rental of Equipment -- Ground Effect Vehicles, Motor Vehicles, Trailers, and Cycles, Lease or Rental of Equipment -- Vehicular Equipment Components by Navy, Army, Air Force, Defense Logistics Agency, and others Signed by year:2000: $0; 2001: $0; 2002: $0; 2003: $7,788; 2004: $6,600; 2005: $107,292; 2006: $65,642.
Biggest contracts:
$84,530 with Navy for Lease or Rental of Equipment -- Ground Effect Vehicles, Motor Vehicles, Trailers, and Cycles. Signed on 2005-07-29. Completion date: 2005-08-27.
$41,632 with Army for Lease or Rental of Equipment -- Ground Effect Vehicles, Motor Vehicles, Trailers, and Cycles. Signed on 2006-06-09. Completion date: 2006-06-20.
$18,562, same as above.Signed on 2005-11-23. Completion date: 2005-11-08.
$12,700 with Air Force for Lease or Rental of Equipment -- Vehicular Equipment Components. Signed on 2006-05-01. Completion date: 2006-05-12.
PRATT & WHITNEY AUTOAIR INC (5640 ENTERPRISE DR) : $96,000 in 2 contractsfrom 2000 to 2005
$65,000 with United States Coast Guard (disused code: now 7008) for Gas Turbines and Jet Engines, Non-Aircraft; and Components. Signed on 2000-08-15. Completion date: 2000-11-15.
$31,000 with Army for Miscellaneous Special Industry Machinery. Signed on 2005-03-23. Completion date: 2005-08-01.
PITNEY BOWES INC (1545 KEYSTONE AVE)
$63,914 with Defense Logistics Agency for Other ADP and Telecommunications Services (includes data storage on tapes, compact disks, etc.). Signed on 1999-10-01. Completion date: 2000-09-30.
MARC REALTY INCORPORATED (0000) (6500 MERC WAY STE 6A; small business) : $51,748 in 2 contractsfrom 2003 to 2004
$40,290 with Geological Survey for Warehouse Buildings. Signed on 2003-10-01. Completion date: 2004-09-30.
$11,458 with Public Buildings Service for Lease or Rental of Facilities -- Office Buildings. Signed on 2004-04-21. Completion date: 2004-06-01.
HILL, G J ASSOCIATES (3843 SANDHILL RD; small business) : $20,000 in 2 contractsin 2003
$10,000 with Army for Technical Representation Services -- Prefabricated Structures and Scaffolding. Taking place in KY. Signed on 2003-11-03. Completion date: 2003-11-21.
$10,000 with U.S. Army Corps of Engineers - civil program financing only for Technical Representation Services -- Prefabricated Structures and Scaffolding. Taking place in KY. Signed on 2003-11-03. Completion date: 2003-11-21.
Top industries in this zip code by the number of employees in 2005:
Administrative and Support and Waste Management and Remediation Services: Temporary Help Services (250-499 employees: 1 establishment, 100-249 employees: 2 establishments)
2002 - 2018 National Fire Incident Reporting System (NFIRS) incidents
Based on the data from the years 2002 - 2018 the average number of fires per year is 88. The highest number of fire incidents - 130 took place in 2002, and the least - 8 in 2008. The data has a decreasing trend.
When looking into fire subcategories, the most reports belonged to: Structure Fires (51.2%), and Outside Fires (19.5%).
Fire incident types reported to NFIRS in Zip Code 48911

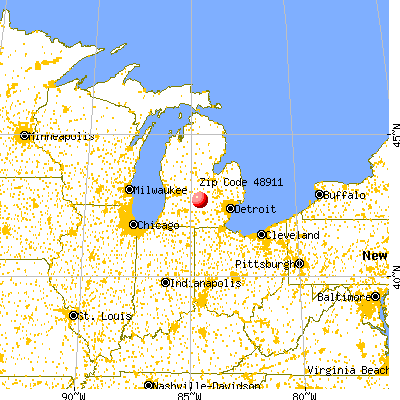


 Nearest zip codes: 48921, 48842, 48910, 48933, 48915, 48912.


 Based on the data from the years 2002 - 2018 the average number of fires per year is 88. The highest number of fire incidents - 130 took place in 2002, and the least - 8 in 2008. The data has a decreasing trend.
 When looking into fire subcategories, the most reports belonged to: Structure Fires (51.2%), and Outside Fires (19.5%).