Estimated zip code population in 2022: 3,224 Zip code population in 2010: 3,105 Zip code population in 2000: 3,422
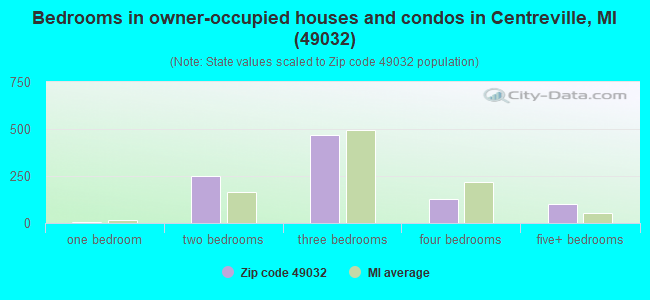
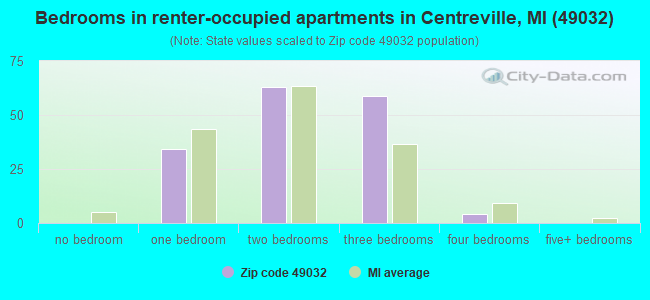
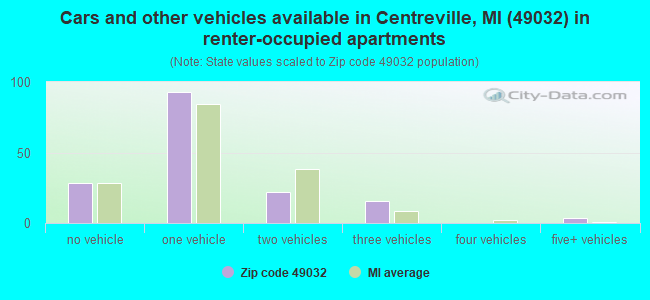
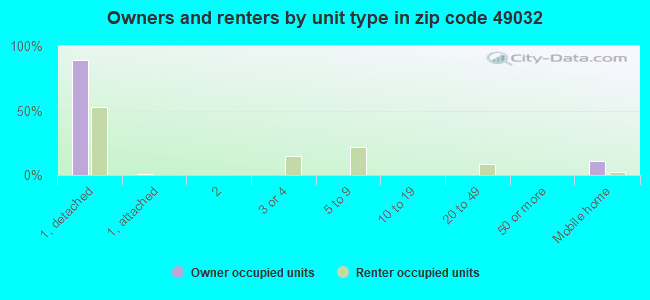
Houses and condos: 1,141 Renter-occupied apartments: 161
% of renters here:
15%
State:
27%
March 2022 cost of living index in zip code 49032: 80.2 (low, U.S. average is 100)
Land area: 36.8 sq. mi. Water area: 0.6 sq. mi.
Population density: 88 people per square mile
(very low).
OSM Map
General Map
Google Map
MSN Map
OSM Map
General Map
Google Map
MSN Map
OSM Map
General Map
Google Map
MSN Map
OSM Map
General Map
Google Map
MSN Map
Please wait while loading the map...
Real estate property taxes paid for housing units in 2022:
This zip code:
1.1% ($1,869)
Michigan:
1.2% ($2,746)
Median real estate property taxes paid for housing units with mortgages in 2022: $1,935 (1.0%) Median real estate property taxes paid for housing units with no mortgage in 2022: $1,711 (1.2%)
Business Search- 14 Million verified businesses
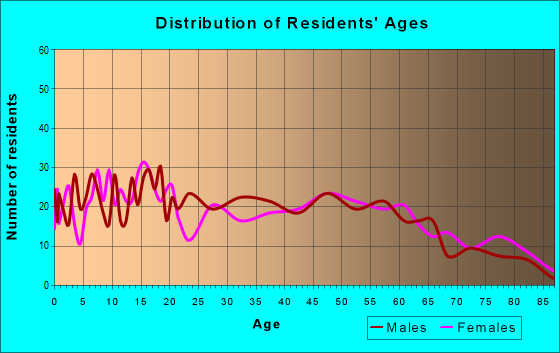
Males: 1,651
(51.2%)
Females: 1,573
(48.8%)
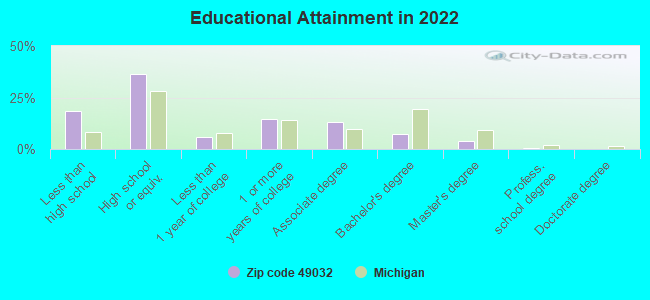
For population 25 years and over in 49032:
High school or higher: 79.8%
Bachelor's degree or higher: 11.2%
Graduate or professional degree: 4.2%
Unemployed: 3.6%
Mean travel time to work (commute): 21.7 minutes
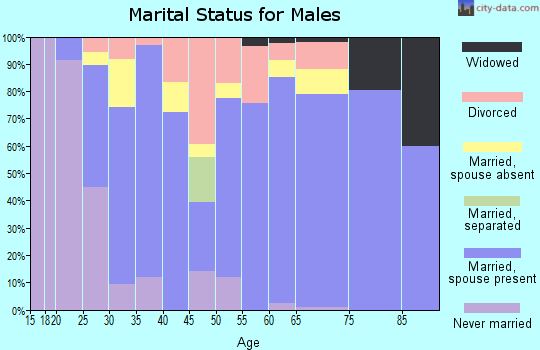
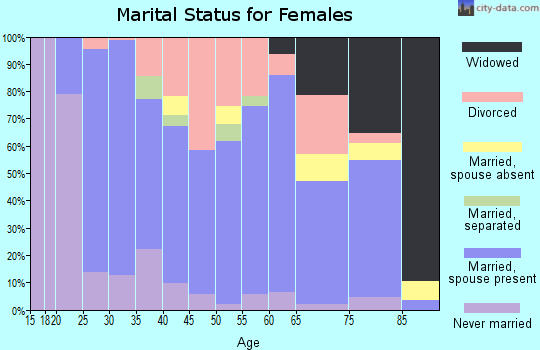
For population 15 years and over in 49032:
Never married: 36.3%
Now married: 49.2%
Separated: 0.1%
Widowed: 5.4%
Divorced: 9.1%
Zip code 49032 compared to state average:
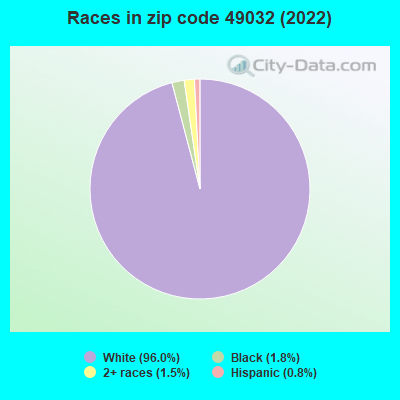
Black race population percentage significantly below state average.
Hispanic race population percentage significantly below state average.
Foreign-born population percentage significantly below state average.
Renting percentage below state average.
Length of stay since moving in significantly above state average.
Number of college students below state average.
Percentage of population with a bachelor's degree or higher significantly below state average.
Averages for the 2020 tax year for zip code 49032, filed in 2021:
Average Adjusted Gross Income (AGI) in 2020: $49,420 (Individual Income Tax Returns)
Here:
$49,420
State:
$68,945
Salary/wage: $41,674 (reported on 79.6% of returns)
Here:
$41,674
State:
$57,142
(% of AGI for various income ranges: 1200.9% for AGIs below $25k, 3641.1% for AGIs $25k-50k, 6607.6% for AGIs $50k-75k, 10525.6% for AGIs $75k-100k, 18160.0% for AGIs $100k-200k)
Taxable interest for individuals: $805 (reported on 28.2% of returns)
This zip code:
$805
Michigan:
$1,630
(% of AGI for various income ranges: 18.1% for AGIs below $25k, 15.9% for AGIs $25k-50k, 30.6% for AGIs $50k-75k, 13.3% for AGIs $75k-100k, 224.3% for AGIs $100k-200k)
Ordinary dividends: $2,772 (reported on 12.7% of returns)
Here:
$2,772
State:
$6,972
(% of AGI for various income ranges: 34.4% for AGIs below $25k, 30.7% for AGIs $25k-50k, 40.6% for AGIs $50k-75k, 338.6% for AGIs $100k-200k)
Net capital gain/loss in AGI: +$8,553 (reported on 12.0% of returns)
Here:
+$8,553
State:
+$20,064
(% of AGI for various income ranges: 34.1% for AGIs below $25k, 45.6% for AGIs $25k-50k, 102.9% for AGIs $50k-75k, 1495.7% for AGIs $100k-200k)
Profit/loss from business: +$17,621 (reported on 16.9% of returns)
Here:
+$17,621
State:
+$11,172
(% of AGI for various income ranges: 221.6% for AGIs below $25k, 417.0% for AGIs $25k-50k, 395.3% for AGIs $50k-75k, 292.2% for AGIs $75k-100k, 2084.3% for AGIs $100k-200k)
Taxable individual retirement arrangement distribution: $14,473 (reported on 7.7% of returns)
49032:
$14,473
Michigan:
$19,803
(% of AGI for various income ranges: 80.0% for AGIs below $25k, 82.2% for AGIs $25k-50k, 308.8% for AGIs $50k-75k, 841.4% for AGIs $100k-200k)
Total itemized deductions: $35,150 (reported on 1.4% of returns)
Here:
$35,150
State:
$34,117
(% of AGI for various income ranges: 219.7% for AGIs below $25k)
Taxes paid: $5,933 (reported on 2.1% of returns)
49032:
$5,933
State:
$7,972
(% of AGI for various income ranges: 104.7% for AGIs $50k-75k)
Earned income credit: $2,242 (reported on 13.4% of returns)
Here:
$2,242
State:
$2,251
(% of AGI for various income ranges: 78.4% for AGIs below $25k, 64.8% for AGIs $25k-50k)
Percentage of individuals using paid preparers for their 2020 taxes: 90.1%
Here:
90%
State:
93%
(% for various income ranges: 88.5% for AGIs below $25k, 89.5% for AGIs $25k-50k, 91.7% for AGIs $50k-75k, 92.9% for AGIs $75k-100k, 91.7% for AGIs $100k-200k, 100.0% for AGIs over 200k)
Averages for the 2012 tax year for zip code 49032, filed in 2013:
Average Adjusted Gross Income (AGI) in 2012: $39,286 (Individual Income Tax Returns)
Here:
$39,286
State:
$55,609
Salary/wage: $34,631 (reported on 80.3% of returns)
Here:
$34,631
State:
$46,782
(% of AGI for various income ranges: 66.7% for AGIs below $25k, 73.3% for AGIs $25k-50k, 80.8% for AGIs $50k-75k, 78.0% for AGIs $75k-100k, 52.2% for AGIs $100k-200k)
Taxable interest for individuals: $924 (reported on 28.0% of returns)
This zip code:
$924
Michigan:
$1,491
(% of AGI for various income ranges: 1.5% for AGIs below $25k, 0.7% for AGIs $25k-50k, 0.5% for AGIs $50k-75k, 0.2% for AGIs $75k-100k, 0.7% for AGIs $100k-200k)
Ordinary dividends: $1,606 (reported on 12.1% of returns)
Here:
$1,606
State:
$6,225
(% of AGI for various income ranges: 0.6% for AGIs below $25k, 0.8% for AGIs $25k-50k, 0.3% for AGIs $50k-75k, 0.7% for AGIs $100k-200k)
Net capital gain/loss in AGI: +$4,087 (reported on 11.4% of returns)
Here:
+$4,087
State:
+$9,326
(% of AGI for various income ranges: 1.0% for AGIs below $25k, 0.8% for AGIs $25k-50k, 0.5% for AGIs $50k-75k, 4.0% for AGIs $75k-100k)
Profit/loss from business: +$9,196 (reported on 18.9% of returns)
Here:
+$9,196
State:
+$11,523
(% of AGI for various income ranges: 12.0% for AGIs below $25k, 7.5% for AGIs $25k-50k, 3.2% for AGIs $50k-75k, 1.8% for AGIs $75k-100k)
Taxable individual retirement arrangement distribution: $11,683 (reported on 9.1% of returns)
49032:
$11,683
Michigan:
$15,298
(% of AGI for various income ranges: 2.4% for AGIs below $25k, 2.4% for AGIs $25k-50k, 2.5% for AGIs $50k-75k, 6.6% for AGIs $75k-100k)
Total itemized deductions: $16,635 (22% of AGI, reported on 17.4% of returns)
Here:
$16,635
State:
$21,628
Here:
22.4% of AGI
State:
18.4% of AGI
(% of AGI for various income ranges: 7.4% for AGIs below $25k, 5.7% for AGIs $25k-50k, 7.1% for AGIs $50k-75k, 8.8% for AGIs $75k-100k, 8.3% for AGIs $100k-200k)
Charity contributions: $3,659 (reported on 12.9% of returns)
Here:
$3,659
State:
$4,225
(% of AGI for various income ranges: 0.4% for AGIs below $25k, 0.7% for AGIs $25k-50k, 1.3% for AGIs $50k-75k, 1.7% for AGIs $75k-100k, 1.8% for AGIs $100k-200k)
Taxes paid: $4,952 (reported on 17.4% of returns)
49032:
$4,952
State:
$8,327
(% of AGI for various income ranges: 0.9% for AGIs below $25k, 1.1% for AGIs $25k-50k, 2.0% for AGIs $50k-75k, 3.0% for AGIs $75k-100k, 3.8% for AGIs $100k-200k)
Earned income credit: $1,975 (reported on 21.2% of returns)
Here:
$1,975
State:
$2,306
(% of AGI for various income ranges: 5.5% for AGIs below $25k, 1.5% for AGIs $25k-50k)
Percentage of individuals using paid preparers for their 2012 taxes: 59.8%
Here:
60%
State:
57%
(% for various income ranges: 55.2% for AGIs below $25k, 62.9% for AGIs $25k-50k, 61.9% for AGIs $50k-75k, 63.6% for AGIs $75k-100k, 71.4% for AGIs $100k-200k)
Averages for the 2004 tax year for zip code 49032, filed in 2005:
Average Adjusted Gross Income (AGI) in 2004: $35,591 (Individual Income Tax Returns)
Here:
$35,591
State:
$48,204
Salary/wage: $34,230 (reported on 84.5% of returns)
Here:
$34,230
State:
$42,791
(% of AGI for various income ranges: 118.3% for AGIs below $10k, 73.6% for AGIs $10k-25k, 84.0% for AGIs $25k-50k, 86.5% for AGIs $50k-75k, 89.4% for AGIs $75k-100k, 62.3% for AGIs over 100k)
Taxable interest for individuals: $996 (reported on 40.7% of returns)
This zip code:
$996
Michigan:
$1,725
(% of AGI for various income ranges: 9.7% for AGIs below $10k, 1.6% for AGIs $10k-25k, 1.2% for AGIs $25k-50k, 0.6% for AGIs $50k-75k, 0.2% for AGIs $75k-100k, 1.3% for AGIs over 100k)
Taxable dividends: $889 (reported on 15.4% of returns)
Here:
$889
State:
$3,420
(% of AGI for various income ranges: 1.1% for AGIs below $10k, 0.7% for AGIs $10k-25k, 0.2% for AGIs $25k-50k, 0.2% for AGIs $50k-75k, 0.1% for AGIs $75k-100k, 0.9% for AGIs over 100k)
Net capital gain/loss: +$3,957 (reported on 11.0% of returns)
Here:
+$3,957
State:
+$8,532
(% of AGI for various income ranges: 3.5% for AGIs below $10k, 1.2% for AGIs $10k-25k, -0.2% for AGIs $25k-50k, 1.3% for AGIs $50k-75k, 4.2% for AGIs over 100k)
Profit/loss from business: +$6,754 (reported on 19.0% of returns)
Here:
+$6,754
State:
+$9,547
(% of AGI for various income ranges: 4.1% for AGIs below $10k, 9.6% for AGIs $10k-25k, 4.8% for AGIs $25k-50k, 2.4% for AGIs $50k-75k, 2.5% for AGIs $75k-100k)
IRA payment deduction: $3,071 (reported on 2.2% of returns)
49032:
$3,071
Michigan:
$2,875
Total itemized deductions: $13,834 (21% of AGI, reported on 20.2% of returns)
Here:
$13,834
State:
$18,509
Here:
20.7% of AGI
State:
20.7% of AGI
(% of AGI for various income ranges: 5.5% for AGIs $10k-25k, 6.5% for AGIs $25k-50k, 9.0% for AGIs $50k-75k, 11.3% for AGIs $75k-100k, 8.5% for AGIs over 100k)
Charity contributions deductions: $2,374 (3% of AGI, reported on 16.1% of returns)
Here:
$2,374
State:
$3,365
Here:
3.2% of AGI
State:
3.6% of AGI
(% of AGI for various income ranges: 0.7% for AGIs $10k-25k, 0.8% for AGIs $25k-50k, 1.2% for AGIs $50k-75k, 1.5% for AGIs $75k-100k, 1.4% for AGIs over 100k)
Total tax: $4,134 (reported on 71.7% of returns)
49032:
$4,134
State:
$7,691
(% of AGI for various income ranges: 4.0% for AGIs below $10k, 4.3% for AGIs $10k-25k, 6.4% for AGIs $25k-50k, 7.8% for AGIs $50k-75k, 10.3% for AGIs $75k-100k, 14.9% for AGIs over 100k)
Earned income credit: $1,665 (reported on 13.7% of returns)
Here:
$1,665
State:
$1,737
Percentage of individuals using paid preparers for their 2004 taxes: 64.0%
Here:
64%
State:
60%
(% for various income ranges: 57.4% for AGIs below $10k, 69.2% for AGIs $10k-25k, 64.6% for AGIs $25k-50k, 65.9% for AGIs $50k-75k, 65.5% for AGIs $75k-100k, 53.1% for AGIs over 100k)
Household received Food Stamps/SNAP in the past 12 months: 157 Household did not receive Food Stamps/SNAP in the past 12 months: 949
Women who had a birth in the past 12 months: 40 (23 now married, 16 unmarried) Women who did not have a birth in the past 12 months: 602 (240 now married, 361 unmarried)
Housing units in zip code 49032 with a mortgage: 580 (105 second mortgage, 3 home equity loan, 99 both second mortgage and home equity loan) Houses without a mortgage: 37
Median monthly owner costs for units with a mortgage: $1,234 Median monthly owner costs for units without a mortgage: $456
Residents with income below the poverty level in 2022:
This zip code:
8.0%
Whole state:
13.4%
Residents with income below 50% of the poverty level in 2022:
This zip code:
2.3%
Whole state:
6.9%
Median number of rooms in houses and condos:
Here:
6.9
State:
6.5
Median number of rooms in apartments:
Here:
5.3
State:
4.3
Notable locations in this zip code not listed on our city pages
Notable locations in zip code 49032: Saint Joseph County Fairgrounds (A), Prairie River Speedway (B), Saint Joseph County Courthouse (C), Saint Joseph Sheriffs Office (D), Centreville Fire Department (E), Nottowa Township Hall (F), Centreville Police Department (G), Nottowa Township Library (H). Display/hide their locations on the map
Churches in zip code 49032 include: Oak Grove Church (A), Pilgrim Fellowship Church (B), Word Fellowship Church (C), Wasepi Mennonite Chapel (D), Centreville Seventh Day Adventist Church (E), Saint Paul's Lutheran Church (F), Centreville United Methodist Church (G), Centreville Baptist Church (H), Burr Oak Methodist Church (I). Display/hide their locations on the map
Cemeteries: Oak Grove Mennonite Cemetery (1), Prairie River Cemetery (2), Babcock Cemetery (3), Amish Cemetery (4), Centreville Village Cemetery (5). Display/hide their locations on the map
In group quarters: 253 (-1 institutionalized population)
Size of family households: 401 2-persons, 174 3-persons, 111 4-persons, 61 5-persons, 8 6-persons, 55 7-or-more-persons
Size of nonfamily households: 200 1-person, 92 2-persons
577 married couples with children.
122 single-parent households (25 men, 97 women).
81.7% of residents of 49032 zip code speak English at home.
0.4% of residents speak Spanish at home (100% very well).
17.3% of residents speak other Indo-European language at home (66% very well, 31% well, 3% not well).
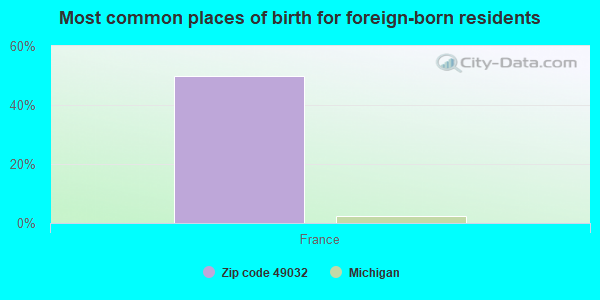
Foreign born population: 2 (0.1%) (100.0% of them are naturalized citizens)
This zip code:
0.1%
Whole state:
6.9%
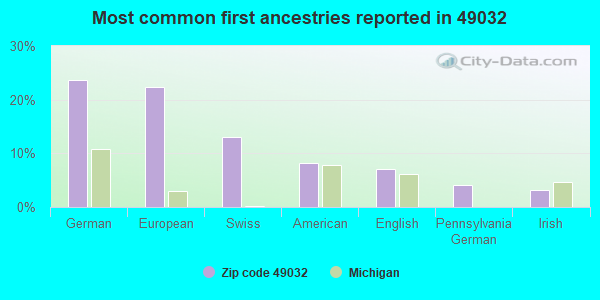
50%France
24%German
22%European
13%Swiss
8%American
7%English
4%Pennsylvania German
3%Irish
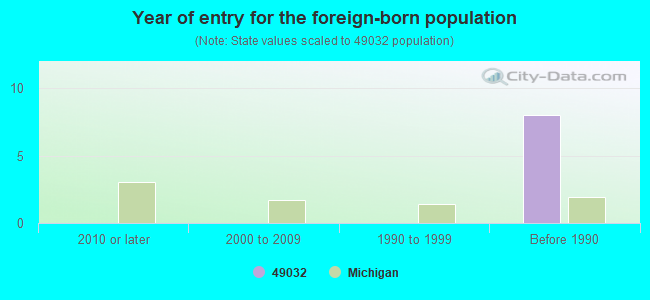
Year of entry for the foreign-born population
02010 or later
02000 to 2009
01990 to 1999
8Before 1990
Facilities with environmental interests located in this zip code:
CENTREVILLE ELEMENTARY SCHOOL (190 HOGAN STREET in CENTREVILLE, MI)
(National Center for Education Statistics) - STATE ID-00628 Organizations: CENTREVILLE PUBLIC SCHOOLS (SCHOOL DISTRICT)
CENTREVILLE HIGH SCHOOL (190 HOGAN STREET in CENTREVILLE, MI)
(National Center for Education Statistics) - STATE ID-00627 Organizations: CENTREVILLE PUBLIC SCHOOLS (SCHOOL DISTRICT)
CENTREVILLE MIDDLE SCHOOL (190 HOGAN STREET in CENTREVILLE, MI)
(National Center for Education Statistics) - STATE ID-00626 Organizations: CENTREVILLE PUBLIC SCHOOLS (SCHOOL DISTRICT)
CENTREVILLE WWSL (CORNER RD in CENTREVILLE, MI)
National Pollutant Discharge Elimination System NON-MAJOR (Tracking pollutant discharge elimination systems) - permit Business SIC classification: SEWERAGE SYSTEMS
CENTREVILLE WWSL (212 WEST MAIN STREET in CENTREVILLE, MI)
National Pollutant Discharge Elimination System NON-MAJOR (Tracking pollutant discharge elimination systems) - permit Business SIC classification: SEWERAGE SYSTEMS
FINNERMANS FARM AND GARDEN SVC (21189 M86 in CENTREVILLE, MI)
Conditionally Exempt Small Quantity Generators, less than 100 kg/month of hazardous waste (Resource Conservation and Recovery Act (tracking hazardous waste)) - notification
GLENN OAKS COMMUNITY COLLEGE (622496 SHIMMEL RD in CENTREVILLE, MI)
Conditionally Exempt Small Quantity Generators, less than 100 kg/month of hazardous waste (Resource Conservation and Recovery Act (tracking hazardous waste)) - notification Alternative names: GLENN OAKS COMM COLLEGE
Housing units lacking complete plumbing facilities: 2.6% Housing units lacking complete kitchen facilities: 1.0%
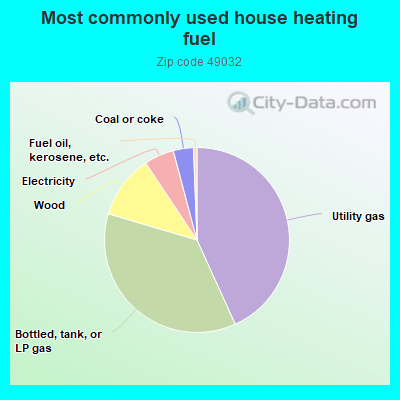
43.0%Utility gas
36.2%Bottled, tank, or LP gas
11.0%Wood
5.2%Electricity
3.5%Coal or coke
0.6%Fuel oil, kerosene, etc.
Population in 1990: 3,606.
Place of birth for U.S.-born residents:
This state: 2,450
Northeast: 40
Midwest: 595
South: 82
West: 51
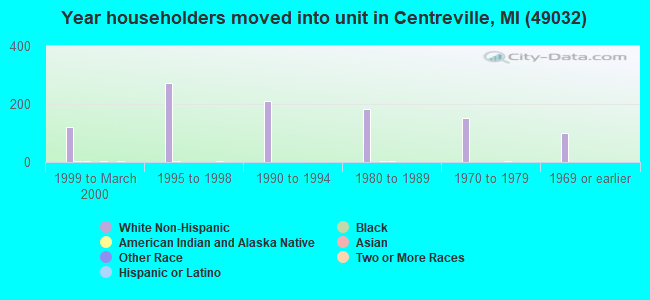
64% of the 49032 zip code residents lived in the same house 5 years ago. Out of people who lived in different houses, 64% lived in this county. Out of people who lived in different counties, 50% lived in Michigan.
90% of the 49032 zip code residents lived in the same house 1 year ago. Out of people who lived in different houses, 73% moved from this county. Out of people who lived in different houses, 18% moved from different county within same state. Out of people who lived in different houses, 5% moved from different state.
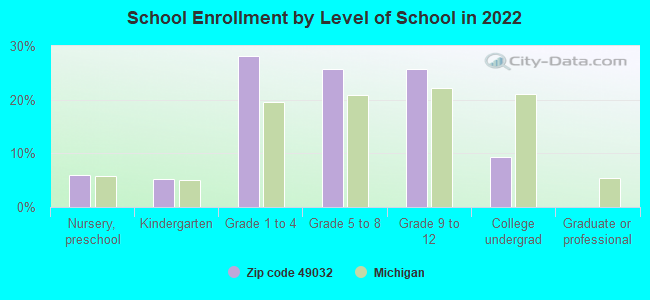
Private vs. public school enrollment:
Students in private schools in grades 1 to 8 (elementary and middle school): 142
Here:
39.8%
Michigan:
12.4%
Students in private schools in grades 9 to 12 (high school): 16
Here:
9.5%
Michigan:
9.8%
Students in private undergraduate colleges: 6
Here:
10.0%
Michigan:
14.9%
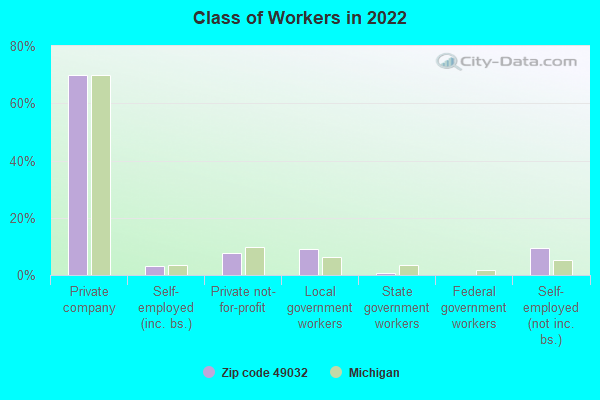
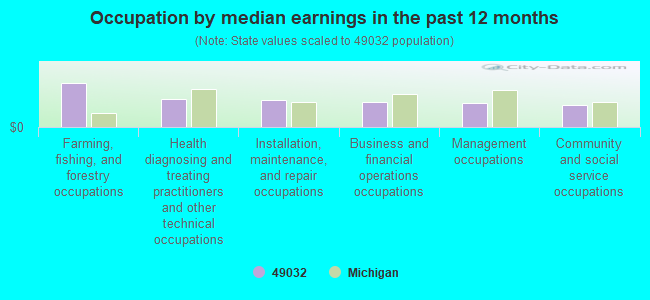
Occupation by median earnings in the past 12 months ($)
110,253Farming, fishing, and forestry occupations
69,087Health diagnosing and treating practitioners and other technical occupations
68,418Installation, maintenance, and repair occupations
63,690Business and financial operations occupations
61,026Management occupations
56,310Community and social service occupations
Top industries in this zip code by the number of employees in 2005:
Health Care and Social Assistance: Continuing Care Retirement Communities (50-99 employees: 1 establishment)
Construction: Oil and Gas Pipeline and Related Structures Construction (50-99: 1)
Accommodation and Food Services: Limited-Service Restaurants (20-49: 1)
Health Care and Social Assistance: Residential Mental Retardation Facilities (10-19: 2)
People in group quarters in 2010:
138 people in local jails and other municipal confinement facilities
55 people in nursing facilities/skilled-nursing facilities
25 people in emergency and transitional shelters (with sleeping facilities) for people experiencing homelessness
24 people in group homes intended for adults
16 people in other noninstitutional facilities
People in group quarters in 2000:
160 people in local jails and other confinement facilities (including police lockups)
60 people in nursing homes
9 people in other noninstitutional group quarters
7 people in homes for the mentally ill
6 people in homes for the mentally retarded
2 people in agriculture workers' dormitories on farms
2002 - 2018 National Fire Incident Reporting System (NFIRS) incidents
According to the data from the years 2002 - 2018 the average number of fire incidents per year is 10. The highest number of reported fires - 24 took place in 2003, and the least - 0 in 2013. The data has a declining trend.
When looking into fire subcategories, the most reports belonged to: Structure Fires (39.2%), and Outside Fires (37.3%).
Fire incident types reported to NFIRS in Zip Code 49032
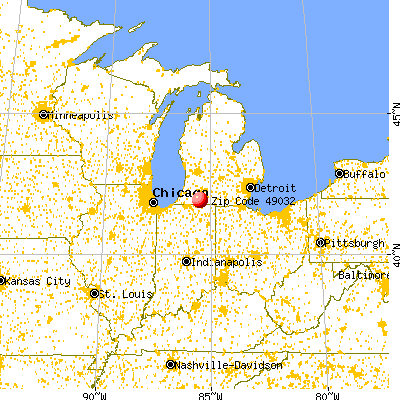


 Nearest zip codes: 49075, 49091, 49072, 49093, 49042, 49099.
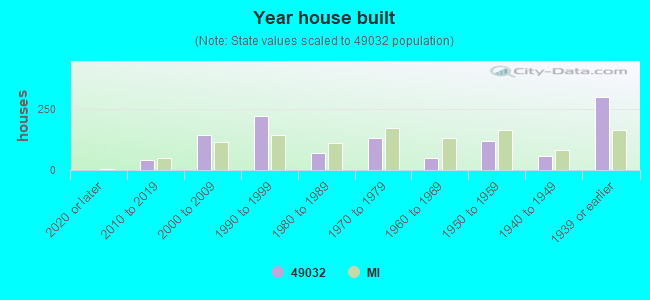


 According to the data from the years 2002 - 2018 the average number of fire incidents per year is 10. The highest number of reported fires - 24 took place in 2003, and the least - 0 in 2013. The data has a declining trend.
 When looking into fire subcategories, the most reports belonged to: Structure Fires (39.2%), and Outside Fires (37.3%).