Estimated zip code population in 2022: 3,381
Zip code population in 2010: 3,951
Zip code population in 2000: 4,291
Houses and condos: 3,676
Renter-occupied apartments: 394
% of renters here:
22%State:
27%
March 2022 cost of living index in zip code 49117: 84.3
(less than average, U.S. average is 100)
Land area: 19.1
sq. mi.
Water area: 2.0
sq. mi.
Population density: 177 people per square mile (very low).
OSM Map
General Map
Google Map
MSN Map
OSM Map
General Map
Google Map
MSN Map
OSM Map
General Map
Google Map
MSN Map
OSM Map
General Map
Google Map
MSN Map
Please wait while loading the map...
Real estate property taxes paid for housing units in 2022:
This zip code:
0.8% ($3,547)Michigan:
1.2% ($2,746)
Median real estate property taxes paid for housing units with mortgages in 2022: $3,727 (0.9%)
Median real estate property taxes paid for housing units with no mortgage in 2022: $3,306 (0.7%)
Profiles of local businesses
Business Search - 14 Million verified businesses
Males: 1,750 Females: 1,631
For population 25 years and over in 49117:
High school or higher: 95.4%Bachelor's degree or higher: 45.8%Graduate or professional degree: 24.4%Unemployed: 7.4%Mean travel time to work (commute): 24.6 minutes
For population 15 years and over in 49117:
Never married: 22.4%Now married: 56.0%Separated: 3.4%Widowed: 5.5%Divorced: 12.7%
Zip code 49117 compared to state average:
Median house value above state average. Black race population percentage significantly below state average. Median age significantly above state average. Foreign-born population percentage below state average. Length of stay since moving in significantly above state average. Number of college students below state average. Percentage of population with a bachelor's degree or higher above state average. 3,054 90.4% White 189 5.6% Hispanic or Latino 74 2.2% Two or more races 28 0.8% Asian 22 0.7% American Indian 10 0.3% Black
Data:
Median household income ($)
Median household income (% change since 2000)
Household income diversity
Ratio of average income to average house value (%)
Ratio of average income to average rent
Median household income ($) - White
Median household income ($) - Black or African American
Median household income ($) - Asian
Median household income ($) - Hispanic or Latino
Median household income ($) - American Indian and Alaska Native
Median household income ($) - Multirace
Median household income ($) - Other Race
Median household income for houses/condos with a mortgage ($)
Median household income for apartments without a mortgage ($)
Races - White alone (%)
Races - White alone (% change since 2000)
Races - Black alone (%)
Races - Black alone (% change since 2000)
Races - American Indian alone (%)
Races - American Indian alone (% change since 2000)
Races - Asian alone (%)
Races - Asian alone (% change since 2000)
Races - Hispanic (%)
Races - Hispanic (% change since 2000)
Races - Native Hawaiian and Other Pacific Islander alone (%)
Races - Native Hawaiian and Other Pacific Islander alone (% change since 2000)
Races - Two or more races (%)
Races - Two or more races (% change since 2000)
Races - Other race alone (%)
Races - Other race alone (% change since 2000)
Racial diversity
Unemployment (%)
Unemployment (% change since 2000)
Unemployment (%) - White
Unemployment (%) - Black or African American
Unemployment (%) - Asian
Unemployment (%) - Hispanic or Latino
Unemployment (%) - American Indian and Alaska Native
Unemployment (%) - Multirace
Unemployment (%) - Other Race
Population density (people per square mile)
Population - Males (%)
Population - Females (%)
Population - Males (%) - White
Population - Males (%) - Black or African American
Population - Males (%) - Asian
Population - Males (%) - Hispanic or Latino
Population - Males (%) - American Indian and Alaska Native
Population - Males (%) - Multirace
Population - Males (%) - Other Race
Population - Females (%) - White
Population - Females (%) - Black or African American
Population - Females (%) - Asian
Population - Females (%) - Hispanic or Latino
Population - Females (%) - American Indian and Alaska Native
Population - Females (%) - Multirace
Population - Females (%) - Other Race
Coronavirus confirmed cases (Apr 24, 2024)
Deaths caused by coronavirus (Apr 24, 2024)
Coronavirus confirmed cases (per 100k population) (Apr 24, 2024)
Deaths caused by coronavirus (per 100k population) (Apr 24, 2024)
Daily increase in number of cases (Apr 24, 2024)
Weekly increase in number of cases (Apr 24, 2024)
Cases doubled (in days) (Apr 24, 2024)
Hospitalized patients (Apr 18, 2022)
Negative test results (Apr 18, 2022)
Total test results (Apr 18, 2022)
COVID Vaccine doses distributed (per 100k population) (Sep 19, 2023)
COVID Vaccine doses administered (per 100k population) (Sep 19, 2023)
COVID Vaccine doses distributed (Sep 19, 2023)
COVID Vaccine doses administered (Sep 19, 2023)
Likely homosexual households (%)
Likely homosexual households (% change since 2000)
Likely homosexual households - Lesbian couples (%)
Likely homosexual households - Lesbian couples (% change since 2000)
Likely homosexual households - Gay men (%)
Likely homosexual households - Gay men (% change since 2000)
Cost of living index
Median gross rent ($)
Median contract rent ($)
Median monthly housing costs ($)
Median house or condo value ($)
Median house or condo value ($ change since 2000)
Mean house or condo value by units in structure - 1, detached ($)
Mean house or condo value by units in structure - 1, attached ($)
Mean house or condo value by units in structure - 2 ($)
Mean house or condo value by units in structure by units in structure - 3 or 4 ($)
Mean house or condo value by units in structure - 5 or more ($)
Mean house or condo value by units in structure - Boat, RV, van, etc. ($)
Mean house or condo value by units in structure - Mobile home ($)
Median house or condo value ($) - White
Median house or condo value ($) - Black or African American
Median house or condo value ($) - Asian
Median house or condo value ($) - Hispanic or Latino
Median house or condo value ($) - American Indian and Alaska Native
Median house or condo value ($) - Multirace
Median house or condo value ($) - Other Race
Median resident age
Resident age diversity
Median resident age - Males
Median resident age - Females
Median resident age - White
Median resident age - Black or African American
Median resident age - Asian
Median resident age - Hispanic or Latino
Median resident age - American Indian and Alaska Native
Median resident age - Multirace
Median resident age - Other Race
Median resident age - Males - White
Median resident age - Males - Black or African American
Median resident age - Males - Asian
Median resident age - Males - Hispanic or Latino
Median resident age - Males - American Indian and Alaska Native
Median resident age - Males - Multirace
Median resident age - Males - Other Race
Median resident age - Females - White
Median resident age - Females - Black or African American
Median resident age - Females - Asian
Median resident age - Females - Hispanic or Latino
Median resident age - Females - American Indian and Alaska Native
Median resident age - Females - Multirace
Median resident age - Females - Other Race
Commute - mean travel time to work (minutes)
Travel time to work - Less than 5 minutes (%)
Travel time to work - Less than 5 minutes (% change since 2000)
Travel time to work - 5 to 9 minutes (%)
Travel time to work - 5 to 9 minutes (% change since 2000)
Travel time to work - 10 to 19 minutes (%)
Travel time to work - 10 to 19 minutes (% change since 2000)
Travel time to work - 20 to 29 minutes (%)
Travel time to work - 20 to 29 minutes (% change since 2000)
Travel time to work - 30 to 39 minutes (%)
Travel time to work - 30 to 39 minutes (% change since 2000)
Travel time to work - 40 to 59 minutes (%)
Travel time to work - 40 to 59 minutes (% change since 2000)
Travel time to work - 60 to 89 minutes (%)
Travel time to work - 60 to 89 minutes (% change since 2000)
Travel time to work - 90 or more minutes (%)
Travel time to work - 90 or more minutes (% change since 2000)
Marital status - Never married (%)
Marital status - Now married (%)
Marital status - Separated (%)
Marital status - Widowed (%)
Marital status - Divorced (%)
Median family income ($)
Median family income (% change since 2000)
Median non-family income ($)
Median non-family income (% change since 2000)
Median per capita income ($)
Median per capita income (% change since 2000)
Median family income ($) - White
Median family income ($) - Black or African American
Median family income ($) - Asian
Median family income ($) - Hispanic or Latino
Median family income ($) - American Indian and Alaska Native
Median family income ($) - Multirace
Median family income ($) - Other Race
Median year house/condo built
Median year apartment built
Year house built - Built 2005 or later (%)
Year house built - Built 2000 to 2004 (%)
Year house built - Built 1990 to 1999 (%)
Year house built - Built 1980 to 1989 (%)
Year house built - Built 1970 to 1979 (%)
Year house built - Built 1960 to 1969 (%)
Year house built - Built 1950 to 1959 (%)
Year house built - Built 1940 to 1949 (%)
Year house built - Built 1939 or earlier (%)
Average household size
Household density (households per square mile)
Average household size - White
Average household size - Black or African American
Average household size - Asian
Average household size - Hispanic or Latino
Average household size - American Indian and Alaska Native
Average household size - Multirace
Average household size - Other Race
Occupied housing units (%)
Vacant housing units (%)
Owner occupied housing units (%)
Renter occupied housing units (%)
Vacancy status - For rent (%)
Vacancy status - For sale only (%)
Vacancy status - Rented or sold, not occupied (%)
Vacancy status - For seasonal, recreational, or occasional use (%)
Vacancy status - For migrant workers (%)
Vacancy status - Other vacant (%)
Residents with income below the poverty level (%)
Residents with income below 50% of the poverty level (%)
Children below poverty level (%)
Poor families by family type - Married-couple family (%)
Poor families by family type - Male, no wife present (%)
Poor families by family type - Female, no husband present (%)
Poverty status for native-born residents (%)
Poverty status for foreign-born residents (%)
Poverty among high school graduates not in families (%)
Poverty among people who did not graduate high school not in families (%)
Residents with income below the poverty level (%) - White
Residents with income below the poverty level (%) - Black or African American
Residents with income below the poverty level (%) - Asian
Residents with income below the poverty level (%) - Hispanic or Latino
Residents with income below the poverty level (%) - American Indian and Alaska Native
Residents with income below the poverty level (%) - Multirace
Residents with income below the poverty level (%) - Other Race
Air pollution - Air Quality Index (AQI)
Air pollution - CO
Air pollution - NO2
Air pollution - SO2
Air pollution - Ozone
Air pollution - PM10
Air pollution - PM25
Air pollution - Pb
Crime - Murders per 100,000 population
Crime - Rapes per 100,000 population
Crime - Robberies per 100,000 population
Crime - Assaults per 100,000 population
Crime - Burglaries per 100,000 population
Crime - Thefts per 100,000 population
Crime - Auto thefts per 100,000 population
Crime - Arson per 100,000 population
Crime - City-data.com crime index
Crime - Violent crime index
Crime - Property crime index
Crime - Murders per 100,000 population (5 year average)
Crime - Rapes per 100,000 population (5 year average)
Crime - Robberies per 100,000 population (5 year average)
Crime - Assaults per 100,000 population (5 year average)
Crime - Burglaries per 100,000 population (5 year average)
Crime - Thefts per 100,000 population (5 year average)
Crime - Auto thefts per 100,000 population (5 year average)
Crime - Arson per 100,000 population (5 year average)
Crime - City-data.com crime index (5 year average)
Crime - Violent crime index (5 year average)
Crime - Property crime index (5 year average)
1996 Presidential Elections Results (%) - Democratic Party (Clinton)
1996 Presidential Elections Results (%) - Republican Party (Dole)
1996 Presidential Elections Results (%) - Other
2000 Presidential Elections Results (%) - Democratic Party (Gore)
2000 Presidential Elections Results (%) - Republican Party (Bush)
2000 Presidential Elections Results (%) - Other
2004 Presidential Elections Results (%) - Democratic Party (Kerry)
2004 Presidential Elections Results (%) - Republican Party (Bush)
2004 Presidential Elections Results (%) - Other
2008 Presidential Elections Results (%) - Democratic Party (Obama)
2008 Presidential Elections Results (%) - Republican Party (McCain)
2008 Presidential Elections Results (%) - Other
2012 Presidential Elections Results (%) - Democratic Party (Obama)
2012 Presidential Elections Results (%) - Republican Party (Romney)
2012 Presidential Elections Results (%) - Other
2016 Presidential Elections Results (%) - Democratic Party (Clinton)
2016 Presidential Elections Results (%) - Republican Party (Trump)
2016 Presidential Elections Results (%) - Other
2020 Presidential Elections Results (%) - Democratic Party (Biden)
2020 Presidential Elections Results (%) - Republican Party (Trump)
2020 Presidential Elections Results (%) - Other
Ancestries Reported - Arab (%)
Ancestries Reported - Czech (%)
Ancestries Reported - Danish (%)
Ancestries Reported - Dutch (%)
Ancestries Reported - English (%)
Ancestries Reported - French (%)
Ancestries Reported - French Canadian (%)
Ancestries Reported - German (%)
Ancestries Reported - Greek (%)
Ancestries Reported - Hungarian (%)
Ancestries Reported - Irish (%)
Ancestries Reported - Italian (%)
Ancestries Reported - Lithuanian (%)
Ancestries Reported - Norwegian (%)
Ancestries Reported - Polish (%)
Ancestries Reported - Portuguese (%)
Ancestries Reported - Russian (%)
Ancestries Reported - Scotch-Irish (%)
Ancestries Reported - Scottish (%)
Ancestries Reported - Slovak (%)
Ancestries Reported - Subsaharan African (%)
Ancestries Reported - Swedish (%)
Ancestries Reported - Swiss (%)
Ancestries Reported - Ukrainian (%)
Ancestries Reported - United States (%)
Ancestries Reported - Welsh (%)
Ancestries Reported - West Indian (%)
Ancestries Reported - Other (%)
Educational Attainment - No schooling completed (%)
Educational Attainment - Less than high school (%)
Educational Attainment - High school or equivalent (%)
Educational Attainment - Less than 1 year of college (%)
Educational Attainment - 1 or more years of college (%)
Educational Attainment - Associate degree (%)
Educational Attainment - Bachelor's degree (%)
Educational Attainment - Master's degree (%)
Educational Attainment - Professional school degree (%)
Educational Attainment - Doctorate degree (%)
School Enrollment - Nursery, preschool (%)
School Enrollment - Kindergarten (%)
School Enrollment - Grade 1 to 4 (%)
School Enrollment - Grade 5 to 8 (%)
School Enrollment - Grade 9 to 12 (%)
School Enrollment - College undergrad (%)
School Enrollment - Graduate or professional (%)
School Enrollment - Not enrolled in school (%)
School enrollment - Public schools (%)
School enrollment - Private schools (%)
School enrollment - Not enrolled (%)
Median number of rooms in houses and condos
Median number of rooms in apartments
Housing units lacking complete plumbing facilities (%)
Housing units lacking complete kitchen facilities (%)
Density of houses
Urban houses (%)
Rural houses (%)
Households with people 60 years and over (%)
Households with people 65 years and over (%)
Households with people 75 years and over (%)
Households with one or more nonrelatives (%)
Households with no nonrelatives (%)
Population in households (%)
Family households (%)
Nonfamily households (%)
Population in families (%)
Family households with own children (%)
Median number of bedrooms in owner occupied houses
Mean number of bedrooms in owner occupied houses
Median number of bedrooms in renter occupied houses
Mean number of bedrooms in renter occupied houses
Median number of vehichles in owner occupied houses
Mean number of vehichles in owner occupied houses
Median number of vehichles in renter occupied houses
Mean number of vehichles in renter occupied houses
Mortgage status - with mortgage (%)
Mortgage status - with second mortgage (%)
Mortgage status - with home equity loan (%)
Mortgage status - with both second mortgage and home equity loan (%)
Mortgage status - without a mortgage (%)
Average family size
Average family size - White
Average family size - Black or African American
Average family size - Asian
Average family size - Hispanic or Latino
Average family size - American Indian and Alaska Native
Average family size - Multirace
Average family size - Other Race
Geographical mobility - Same house 1 year ago (%)
Geographical mobility - Moved within same county (%)
Geographical mobility - Moved from different county within same state (%)
Geographical mobility - Moved from different state (%)
Geographical mobility - Moved from abroad (%)
Place of birth - Born in state of residence (%)
Place of birth - Born in other state (%)
Place of birth - Native, outside of US (%)
Place of birth - Foreign born (%)
Housing units in structures - 1, detached (%)
Housing units in structures - 1, attached (%)
Housing units in structures - 2 (%)
Housing units in structures - 3 or 4 (%)
Housing units in structures - 5 to 9 (%)
Housing units in structures - 10 to 19 (%)
Housing units in structures - 20 to 49 (%)
Housing units in structures - 50 or more (%)
Housing units in structures - Mobile home (%)
Housing units in structures - Boat, RV, van, etc. (%)
House/condo owner moved in on average (years ago)
Renter moved in on average (years ago)
Year householder moved into unit - Moved in 1999 to March 2000 (%)
Year householder moved into unit - Moved in 1995 to 1998 (%)
Year householder moved into unit - Moved in 1990 to 1994 (%)
Year householder moved into unit - Moved in 1980 to 1989 (%)
Year householder moved into unit - Moved in 1970 to 1979 (%)
Year householder moved into unit - Moved in 1969 or earlier (%)
Means of transportation to work - Drove car alone (%)
Means of transportation to work - Carpooled (%)
Means of transportation to work - Public transportation (%)
Means of transportation to work - Bus or trolley bus (%)
Means of transportation to work - Streetcar or trolley car (%)
Means of transportation to work - Subway or elevated (%)
Means of transportation to work - Railroad (%)
Means of transportation to work - Ferryboat (%)
Means of transportation to work - Taxicab (%)
Means of transportation to work - Motorcycle (%)
Means of transportation to work - Bicycle (%)
Means of transportation to work - Walked (%)
Means of transportation to work - Other means (%)
Working at home (%)
Industry diversity
Most Common Industries - Agriculture, forestry, fishing and hunting, and mining (%)
Most Common Industries - Agriculture, forestry, fishing and hunting (%)
Most Common Industries - Mining, quarrying, and oil and gas extraction (%)
Most Common Industries - Construction (%)
Most Common Industries - Manufacturing (%)
Most Common Industries - Wholesale trade (%)
Most Common Industries - Retail trade (%)
Most Common Industries - Transportation and warehousing, and utilities (%)
Most Common Industries - Transportation and warehousing (%)
Most Common Industries - Utilities (%)
Most Common Industries - Information (%)
Most Common Industries - Finance and insurance, and real estate and rental and leasing (%)
Most Common Industries - Finance and insurance (%)
Most Common Industries - Real estate and rental and leasing (%)
Most Common Industries - Professional, scientific, and management, and administrative and waste management services (%)
Most Common Industries - Professional, scientific, and technical services (%)
Most Common Industries - Management of companies and enterprises (%)
Most Common Industries - Administrative and support and waste management services (%)
Most Common Industries - Educational services, and health care and social assistance (%)
Most Common Industries - Educational services (%)
Most Common Industries - Health care and social assistance (%)
Most Common Industries - Arts, entertainment, and recreation, and accommodation and food services (%)
Most Common Industries - Arts, entertainment, and recreation (%)
Most Common Industries - Accommodation and food services (%)
Most Common Industries - Other services, except public administration (%)
Most Common Industries - Public administration (%)
Occupation diversity
Most Common Occupations - Management, business, science, and arts occupations (%)
Most Common Occupations - Management, business, and financial occupations (%)
Most Common Occupations - Management occupations (%)
Most Common Occupations - Business and financial operations occupations (%)
Most Common Occupations - Computer, engineering, and science occupations (%)
Most Common Occupations - Computer and mathematical occupations (%)
Most Common Occupations - Architecture and engineering occupations (%)
Most Common Occupations - Life, physical, and social science occupations (%)
Most Common Occupations - Education, legal, community service, arts, and media occupations (%)
Most Common Occupations - Community and social service occupations (%)
Most Common Occupations - Legal occupations (%)
Most Common Occupations - Education, training, and library occupations (%)
Most Common Occupations - Arts, design, entertainment, sports, and media occupations (%)
Most Common Occupations - Healthcare practitioners and technical occupations (%)
Most Common Occupations - Health diagnosing and treating practitioners and other technical occupations (%)
Most Common Occupations - Health technologists and technicians (%)
Most Common Occupations - Service occupations (%)
Most Common Occupations - Healthcare support occupations (%)
Most Common Occupations - Protective service occupations (%)
Most Common Occupations - Fire fighting and prevention, and other protective service workers including supervisors (%)
Most Common Occupations - Law enforcement workers including supervisors (%)
Most Common Occupations - Food preparation and serving related occupations (%)
Most Common Occupations - Building and grounds cleaning and maintenance occupations (%)
Most Common Occupations - Personal care and service occupations (%)
Most Common Occupations - Sales and office occupations (%)
Most Common Occupations - Sales and related occupations (%)
Most Common Occupations - Office and administrative support occupations (%)
Most Common Occupations - Natural resources, construction, and maintenance occupations (%)
Most Common Occupations - Farming, fishing, and forestry occupations (%)
Most Common Occupations - Construction and extraction occupations (%)
Most Common Occupations - Installation, maintenance, and repair occupations (%)
Most Common Occupations - Production, transportation, and material moving occupations (%)
Most Common Occupations - Production occupations (%)
Most Common Occupations - Transportation occupations (%)
Most Common Occupations - Material moving occupations (%)
People in Group quarters - Institutionalized population (%)
People in Group quarters - Correctional institutions (%)
People in Group quarters - Federal prisons and detention centers (%)
People in Group quarters - Halfway houses (%)
People in Group quarters - Local jails and other confinement facilities (including police lockups) (%)
People in Group quarters - Military disciplinary barracks (%)
People in Group quarters - State prisons (%)
People in Group quarters - Other types of correctional institutions (%)
People in Group quarters - Nursing homes (%)
People in Group quarters - Hospitals/wards, hospices, and schools for the handicapped (%)
People in Group quarters - Hospitals/wards and hospices for chronically ill (%)
People in Group quarters - Hospices or homes for chronically ill (%)
People in Group quarters - Military hospitals or wards for chronically ill (%)
People in Group quarters - Other hospitals or wards for chronically ill (%)
People in Group quarters - Hospitals or wards for drug/alcohol abuse (%)
People in Group quarters - Mental (Psychiatric) hospitals or wards (%)
People in Group quarters - Schools, hospitals, or wards for the mentally retarded (%)
People in Group quarters - Schools, hospitals, or wards for the physically handicapped (%)
People in Group quarters - Institutions for the deaf (%)
People in Group quarters - Institutions for the blind (%)
People in Group quarters - Orthopedic wards and institutions for the physically handicapped (%)
People in Group quarters - Wards in general hospitals for patients who have no usual home elsewhere (%)
People in Group quarters - Wards in military hospitals for patients who have no usual home elsewhere (%)
People in Group quarters - Juvenile institutions (%)
People in Group quarters - Long-term care (%)
People in Group quarters - Homes for abused, dependent, and neglected children (%)
People in Group quarters - Residential treatment centers for emotionally disturbed children (%)
People in Group quarters - Training schools for juvenile delinquents (%)
People in Group quarters - Short-term care, detention or diagnostic centers for delinquent children (%)
People in Group quarters - Type of juvenile institution unknown (%)
People in Group quarters - Noninstitutionalized population (%)
People in Group quarters - College dormitories (includes college quarters off campus) (%)
People in Group quarters - Military quarters (%)
People in Group quarters - On base (%)
People in Group quarters - Barracks, unaccompanied personnel housing (UPH), (Enlisted/Officer), ;and similar group living quarters for military personnel (%)
People in Group quarters - Transient quarters for temporary residents (%)
People in Group quarters - Military ships (%)
People in Group quarters - Group homes (%)
People in Group quarters - Homes or halfway houses for drug/alcohol abuse (%)
People in Group quarters - Homes for the mentally ill (%)
People in Group quarters - Homes for the mentally retarded (%)
People in Group quarters - Homes for the physically handicapped (%)
People in Group quarters - Other group homes (%)
People in Group quarters - Religious group quarters (%)
People in Group quarters - Dormitories (%)
People in Group quarters - Agriculture workers' dormitories on farms (%)
People in Group quarters - Job Corps and vocational training facilities (%)
People in Group quarters - Other workers' dormitories (%)
People in Group quarters - Crews of maritime vessels (%)
People in Group quarters - Other nonhousehold living situations (%)
People in Group quarters - Other noninstitutional group quarters (%)
Residents speaking English at home (%)
Residents speaking English at home - Born in the United States (%)
Residents speaking English at home - Native, born elsewhere (%)
Residents speaking English at home - Foreign born (%)
Residents speaking Spanish at home (%)
Residents speaking Spanish at home - Born in the United States (%)
Residents speaking Spanish at home - Native, born elsewhere (%)
Residents speaking Spanish at home - Foreign born (%)
Residents speaking other language at home (%)
Residents speaking other language at home - Born in the United States (%)
Residents speaking other language at home - Native, born elsewhere (%)
Residents speaking other language at home - Foreign born (%)
Class of Workers - Employee of private company (%)
Class of Workers - Self-employed in own incorporated business (%)
Class of Workers - Private not-for-profit wage and salary workers (%)
Class of Workers - Local government workers (%)
Class of Workers - State government workers (%)
Class of Workers - Federal government workers (%)
Class of Workers - Self-employed workers in own not incorporated business and Unpaid family workers (%)
House heating fuel used in houses and condos - Utility gas (%)
House heating fuel used in houses and condos - Bottled, tank, or LP gas (%)
House heating fuel used in houses and condos - Electricity (%)
House heating fuel used in houses and condos - Fuel oil, kerosene, etc. (%)
House heating fuel used in houses and condos - Coal or coke (%)
House heating fuel used in houses and condos - Wood (%)
House heating fuel used in houses and condos - Solar energy (%)
House heating fuel used in houses and condos - Other fuel (%)
House heating fuel used in houses and condos - No fuel used (%)
House heating fuel used in apartments - Utility gas (%)
House heating fuel used in apartments - Bottled, tank, or LP gas (%)
House heating fuel used in apartments - Electricity (%)
House heating fuel used in apartments - Fuel oil, kerosene, etc. (%)
House heating fuel used in apartments - Coal or coke (%)
House heating fuel used in apartments - Wood (%)
House heating fuel used in apartments - Solar energy (%)
House heating fuel used in apartments - Other fuel (%)
House heating fuel used in apartments - No fuel used (%)
Armed forces status - In Armed Forces (%)
Armed forces status - Civilian (%)
Armed forces status - Civilian - Veteran (%)
Armed forces status - Civilian - Nonveteran (%)
Fatal accidents locations in years 2005-2021
Fatal accidents locations in 2005
Fatal accidents locations in 2006
Fatal accidents locations in 2007
Fatal accidents locations in 2008
Fatal accidents locations in 2009
Fatal accidents locations in 2010
Fatal accidents locations in 2011
Fatal accidents locations in 2012
Fatal accidents locations in 2013
Fatal accidents locations in 2014
Fatal accidents locations in 2015
Fatal accidents locations in 2016
Fatal accidents locations in 2017
Fatal accidents locations in 2018
Fatal accidents locations in 2019
Fatal accidents locations in 2020
Fatal accidents locations in 2021
Alcohol use - People drinking some alcohol every month (%)
Alcohol use - People not drinking at all (%)
Alcohol use - Average days/month drinking alcohol
Alcohol use - Average drinks/week
Alcohol use - Average days/year people drink much
Audiometry - Average condition of hearing (%)
Audiometry - People that can hear a whisper from across a quiet room (%)
Audiometry - People that can hear normal voice from across a quiet room (%)
Audiometry - Ears ringing, roaring, buzzing (%)
Audiometry - Had a job exposure to loud noise (%)
Audiometry - Had off-work exposure to loud noise (%)
Blood Pressure & Cholesterol - Has high blood pressure (%)
Blood Pressure & Cholesterol - Checking blood pressure at home (%)
Blood Pressure & Cholesterol - Frequently checking blood cholesterol (%)
Blood Pressure & Cholesterol - Has high cholesterol level (%)
Consumer Behavior - Money monthly spent on food at supermarket/grocery store
Consumer Behavior - Money monthly spent on food at other stores
Consumer Behavior - Money monthly spent on eating out
Consumer Behavior - Money monthly spent on carryout/delivered foods
Consumer Behavior - Income spent on food at supermarket/grocery store (%)
Consumer Behavior - Income spent on food at other stores (%)
Consumer Behavior - Income spent on eating out (%)
Consumer Behavior - Income spent on carryout/delivered foods (%)
Current Health Status - General health condition (%)
Current Health Status - Blood donors (%)
Current Health Status - Has blood ever tested for HIV virus (%)
Current Health Status - Left-handed people (%)
Dermatology - People using sunscreen (%)
Diabetes - Diabetics (%)
Diabetes - Had a blood test for high blood sugar (%)
Diabetes - People taking insulin (%)
Diet Behavior & Nutrition - Diet health (%)
Diet Behavior & Nutrition - Milk product consumption (# of products/month)
Diet Behavior & Nutrition - Meals not home prepared (#/week)
Diet Behavior & Nutrition - Meals from fast food or pizza place (#/week)
Diet Behavior & Nutrition - Ready-to-eat foods (#/month)
Diet Behavior & Nutrition - Frozen meals/pizza (#/month)
Drug Use - People that ever used marijuana or hashish (%)
Drug Use - Ever used hard drugs (%)
Drug Use - Ever used any form of cocaine (%)
Drug Use - Ever used heroin (%)
Drug Use - Ever used methamphetamine (%)
Health Insurance - People covered by health insurance (%)
Kidney Conditions-Urology - Avg. # of times urinating at night
Medical Conditions - People with asthma (%)
Medical Conditions - People with anemia (%)
Medical Conditions - People with psoriasis (%)
Medical Conditions - People with overweight (%)
Medical Conditions - Elderly people having difficulties in thinking or remembering (%)
Medical Conditions - People who ever received blood transfusion (%)
Medical Conditions - People having trouble seeing even with glass/contacts (%)
Medical Conditions - People with arthritis (%)
Medical Conditions - People with gout (%)
Medical Conditions - People with congestive heart failure (%)
Medical Conditions - People with coronary heart disease (%)
Medical Conditions - People with angina pectoris (%)
Medical Conditions - People who ever had heart attack (%)
Medical Conditions - People who ever had stroke (%)
Medical Conditions - People with emphysema (%)
Medical Conditions - People with thyroid problem (%)
Medical Conditions - People with chronic bronchitis (%)
Medical Conditions - People with any liver condition (%)
Medical Conditions - People who ever had cancer or malignancy (%)
Mental Health - People who have little interest in doing things (%)
Mental Health - People feeling down, depressed, or hopeless (%)
Mental Health - People who have trouble sleeping or sleeping too much (%)
Mental Health - People feeling tired or having little energy (%)
Mental Health - People with poor appetite or overeating (%)
Mental Health - People feeling bad about themself (%)
Mental Health - People who have trouble concentrating on things (%)
Mental Health - People moving or speaking slowly or too fast (%)
Mental Health - People having thoughts they would be better off dead (%)
Oral Health - Average years since last visit a dentist
Oral Health - People embarrassed because of mouth (%)
Oral Health - People with gum disease (%)
Oral Health - General health of teeth and gums (%)
Oral Health - Average days a week using dental floss/device
Oral Health - Average days a week using mouthwash for dental problem
Oral Health - Average number of teeth
Pesticide Use - Households using pesticides to control insects (%)
Pesticide Use - Households using pesticides to kill weeds (%)
Physical Activity - People doing vigorous-intensity work activities (%)
Physical Activity - People doing moderate-intensity work activities (%)
Physical Activity - People walking or bicycling (%)
Physical Activity - People doing vigorous-intensity recreational activities (%)
Physical Activity - People doing moderate-intensity recreational activities (%)
Physical Activity - Average hours a day doing sedentary activities
Physical Activity - Average hours a day watching TV or videos
Physical Activity - Average hours a day using computer
Physical Functioning - People having limitations keeping them from working (%)
Physical Functioning - People limited in amount of work they can do (%)
Physical Functioning - People that need special equipment to walk (%)
Physical Functioning - People experiencing confusion/memory problems (%)
Physical Functioning - People requiring special healthcare equipment (%)
Prescription Medications - Average number of prescription medicines taking
Preventive Aspirin Use - Adults 40+ taking low-dose aspirin (%)
Reproductive Health - Vaginal deliveries (%)
Reproductive Health - Cesarean deliveries (%)
Reproductive Health - Deliveries resulted in a live birth (%)
Reproductive Health - Pregnancies resulted in a delivery (%)
Reproductive Health - Women breastfeeding newborns (%)
Reproductive Health - Women that had a hysterectomy (%)
Reproductive Health - Women that had both ovaries removed (%)
Reproductive Health - Women that have ever taken birth control pills (%)
Reproductive Health - Women taking birth control pills (%)
Reproductive Health - Women that have ever used Depo-Provera or injectables (%)
Reproductive Health - Women that have ever used female hormones (%)
Sexual Behavior - People 18+ that ever had sex (vaginal, anal, or oral) (%)
Sexual Behavior - Males 18+ that ever had vaginal sex with a woman (%)
Sexual Behavior - Males 18+ that ever performed oral sex on a woman (%)
Sexual Behavior - Males 18+ that ever had anal sex with a woman (%)
Sexual Behavior - Males 18+ that ever had any sex with a man (%)
Sexual Behavior - Females 18+ that ever had vaginal sex with a man (%)
Sexual Behavior - Females 18+ that ever performed oral sex on a man (%)
Sexual Behavior - Females 18+ that ever had anal sex with a man (%)
Sexual Behavior - Females 18+ that ever had any kind of sex with a woman (%)
Sexual Behavior - Average age people first had sex
Sexual Behavior - Average number of female sex partners in lifetime (males 18+)
Sexual Behavior - Average number of female vaginal sex partners in lifetime (males 18+)
Sexual Behavior - Average age people first performed oral sex on a woman (18+)
Sexual Behavior - Average number of woman performed oral sex on in lifetime (18+)
Sexual Behavior - Average number of male sex partners in lifetime (males 18+)
Sexual Behavior - Average number of male anal sex partners in lifetime (males 18+)
Sexual Behavior - Average age people first performed oral sex on a man (18+)
Sexual Behavior - Average number of male oral sex partners in lifetime (18+)
Sexual Behavior - People using protection when performing oral sex (%)
Sexual Behavior - Average number of times people have vaginal or anal sex a year
Sexual Behavior - People having sex without condom (%)
Sexual Behavior - Average number of male sex partners in lifetime (females 18+)
Sexual Behavior - Average number of male vaginal sex partners in lifetime (females 18+)
Sexual Behavior - Average number of female sex partners in lifetime (females 18+)
Sexual Behavior - Circumcised males 18+ (%)
Sleep Disorders - Average hours sleeping at night
Sleep Disorders - People that has trouble sleeping (%)
Smoking-Cigarette Use - People smoking cigarettes (%)
Taste & Smell - People 40+ having problems with smell (%)
Taste & Smell - People 40+ having problems with taste (%)
Taste & Smell - People 40+ that ever had wisdom teeth removed (%)
Taste & Smell - People 40+ that ever had tonsils teeth removed (%)
Taste & Smell - People 40+ that ever had a loss of consciousness because of a head injury (%)
Taste & Smell - People 40+ that ever had a broken nose or other serious injury to face or skull (%)
Taste & Smell - People 40+ that ever had two or more sinus infections (%)
Weight - Average height (inches)
Weight - Average weight (pounds)
Weight - Average BMI
Weight - People that are obese (%)
Weight - People that ever were obese (%)
Weight - People trying to lose weight (%)
Urban population: 2,288
Rural population: 1,092
Estimated median house/condo value in 2022: $456,388
49117:
$456,388Michigan:
$224,400
According to our research of Michigan and other state lists, there were 9 registered sex offenders living in 49117 zip code as of April 24, 2024 . The ratio of all residents to sex offenders in zip code 49117 is 432 to 1.The ratio of registered sex offenders to all residents in this zip code is lower than the state average.
Median resident age: This zip code:
57.3 yearsMichigan median age:
40.3 years
Average household size: This zip code:
1.9 peopleMichigan:
2.4 people
Averages for the 2020 tax year for zip code 49117, filed in 2021:
Average Adjusted Gross Income (AGI) in 2020: $134,383 (Individual Income Tax Returns) Here:
$134,383State:
$68,945
Salary/wage: $94,765 (reported on 68.8% of returns )Here:
$94,765State:
$57,142
(% of AGI for various income ranges: 1086.1% for AGIs below $25k , 3247.7% for AGIs $25k-50k , 5900.8% for AGIs $50k-75k , 7746.0% for AGIs $75k-100k , 15691.3% for AGIs $100k-200k , 122970.0% for AGIs over 200k ) Taxable interest for individuals: $3,146 (reported on 44.3% of returns )This zip code:
$3,146Michigan:
$1,630
(% of AGI for various income ranges: 44.2% for AGIs below $25k , 48.8% for AGIs $25k-50k , 84.6% for AGIs $50k-75k , 92.0% for AGIs $75k-100k , 372.0% for AGIs $100k-200k , 2713.3% for AGIs over 200k ) Ordinary dividends: $15,489 (reported on 33.9% of returns )(% of AGI for various income ranges: 104.2% for AGIs below $25k , 149.2% for AGIs $25k-50k , 338.5% for AGIs $50k-75k , 407.0% for AGIs $75k-100k , 1368.0% for AGIs $100k-200k , 10676.7% for AGIs over 200k ) Net capital gain/loss in AGI: +$83,626 (reported on 34.4% of returns )Here:
+$83,626State:
+$20,064
(% of AGI for various income ranges: 65.6% for AGIs below $25k , 126.2% for AGIs $25k-50k , 213.8% for AGIs $50k-75k , 351.0% for AGIs $75k-100k , 1925.3% for AGIs $100k-200k , 85186.7% for AGIs over 200k ) Profit/loss from business: +$26,634 (reported on 19.8% of returns )Here:
+$26,634State:
+$11,172
(% of AGI for various income ranges: 153.6% for AGIs below $25k , 316.5% for AGIs $25k-50k , 489.2% for AGIs $50k-75k , 189.0% for AGIs $75k-100k , 1484.0% for AGIs $100k-200k , 9490.0% for AGIs over 200k ) Taxable individual retirement arrangement distribution: $28,500 (reported on 16.1% of returns )49117:
$28,500Michigan:
$19,803
(% of AGI for various income ranges: 93.6% for AGIs below $25k , 235.8% for AGIs $25k-50k , 543.1% for AGIs $50k-75k , 808.0% for AGIs $75k-100k , 1566.0% for AGIs $100k-200k , 6703.3% for AGIs over 200k ) Self-employed (Keogh) retirement plans: $33,375 (reported on 2.1% of returns )49117:
$33,375Michigan:
$25,132
(% of AGI for various income ranges: 2225.0% for AGIs over 200k ) Total itemized deductions: $42,010 (reported on 16.1% of returns )Here:
$42,010State:
$34,117
(% of AGI for various income ranges: 356.2% for AGIs $25k-50k , 423.8% for AGIs $50k-75k , 709.0% for AGIs $75k-100k , 2031.3% for AGIs $100k-200k , 12983.3% for AGIs over 200k ) Charity contributions: $17,020 (reported on 13.0% of returns )Here:
$17,020State:
$13,548
(% of AGI for various income ranges: 59.6% for AGIs $25k-50k , 158.0% for AGIs $75k-100k , 332.7% for AGIs $100k-200k , 5738.3% for AGIs over 200k ) Taxes paid: $8,732 (reported on 16.1% of returns )(% of AGI for various income ranges: 98.1% for AGIs $25k-50k , 108.5% for AGIs $50k-75k , 202.0% for AGIs $75k-100k , 563.3% for AGIs $100k-200k , 2106.7% for AGIs over 200k ) Earned income credit: $1,750 (reported on 9.4% of returns )(% of AGI for various income ranges: 49.7% for AGIs below $25k , 52.3% for AGIs $25k-50k ) Percentage of individuals using paid preparers for their 2020 taxes: 92.2%(% for various income ranges: 90.2% for AGIs below $25k , 94.7% for AGIs $25k-50k , 90.9% for AGIs $50k-75k , 93.3% for AGIs $75k-100k , 90.6% for AGIs $100k-200k , 95.8% for AGIs over 200k )
Averages for the 2012 tax year for zip code 49117, filed in 2013:
Average Adjusted Gross Income (AGI) in 2012: $73,385 (Individual Income Tax Returns) Here:
$73,385State:
$55,609
Salary/wage: $55,344 (reported on 72.6% of returns )Here:
$55,344State:
$46,782
(% of AGI for various income ranges: 60.9% for AGIs below $25k , 71.6% for AGIs $25k-50k , 66.3% for AGIs $50k-75k , 64.0% for AGIs $75k-100k , 53.2% for AGIs $100k-200k , 46.7% for AGIs over 200k ) Taxable interest for individuals: $2,257 (reported on 41.6% of returns )This zip code:
$2,257Michigan:
$1,491
(% of AGI for various income ranges: 2.3% for AGIs below $25k , 1.2% for AGIs $25k-50k , 1.0% for AGIs $50k-75k , 1.9% for AGIs $75k-100k , 1.6% for AGIs $100k-200k , 0.9% for AGIs over 200k ) Ordinary dividends: $10,207 (reported on 28.4% of returns )(% of AGI for various income ranges: 4.4% for AGIs below $25k , 1.6% for AGIs $25k-50k , 2.9% for AGIs $50k-75k , 2.4% for AGIs $75k-100k , 5.4% for AGIs $100k-200k , 4.2% for AGIs over 200k ) Net capital gain/loss in AGI: +$16,533 (reported on 22.6% of returns )Here:
+$16,533State:
+$9,326
(% of AGI for various income ranges: 0.6% for AGIs below $25k , 0.5% for AGIs $25k-50k , 0.4% for AGIs $50k-75k , 2.1% for AGIs $75k-100k , 4.7% for AGIs $100k-200k , 8.6% for AGIs over 200k ) Profit/loss from business: +$11,242 (reported on 18.9% of returns )Here:
+$11,242State:
+$11,523
(% of AGI for various income ranges: 10.4% for AGIs below $25k , 6.1% for AGIs $25k-50k , 7.6% for AGIs $50k-75k , 5.4% for AGIs $75k-100k , 4.6% for AGIs $100k-200k ) Taxable individual retirement arrangement distribution: $21,210 (reported on 15.8% of returns )49117:
$21,210Michigan:
$15,298
(% of AGI for various income ranges: 5.9% for AGIs below $25k , 3.9% for AGIs $25k-50k , 5.1% for AGIs $50k-75k , 3.9% for AGIs $75k-100k , 8.5% for AGIs $100k-200k , 2.5% for AGIs over 200k ) Total itemized deductions: $33,416 (20% of AGI, reported on 32.6% of returns )Here:
$33,416State:
$21,628
Here:
20.3% of AGIState:
18.4% of AGI
(% of AGI for various income ranges: 15.2% for AGIs below $25k , 12.0% for AGIs $25k-50k , 12.0% for AGIs $50k-75k , 17.2% for AGIs $75k-100k , 17.8% for AGIs $100k-200k , 14.1% for AGIs over 200k ) Charity contributions: $7,387 (reported on 27.4% of returns )(% of AGI for various income ranges: 0.9% for AGIs below $25k , 1.0% for AGIs $25k-50k , 1.3% for AGIs $50k-75k , 1.7% for AGIs $75k-100k , 2.3% for AGIs $100k-200k , 4.2% for AGIs over 200k ) Taxes paid: $13,998 (reported on 32.6% of returns )49117:
$13,998State:
$8,327
(% of AGI for various income ranges: 3.9% for AGIs below $25k , 3.5% for AGIs $25k-50k , 4.3% for AGIs $50k-75k , 6.0% for AGIs $75k-100k , 7.3% for AGIs $100k-200k , 7.1% for AGIs over 200k ) Earned income credit: $1,846 (reported on 13.7% of returns )(% of AGI for various income ranges: 4.2% for AGIs below $25k , 0.8% for AGIs $25k-50k ) Percentage of individuals using paid preparers for their 2012 taxes: 58.4%(% for various income ranges: 48.8% for AGIs below $25k , 58.3% for AGIs $25k-50k , 56.5% for AGIs $50k-75k , 64.3% for AGIs $75k-100k , 77.3% for AGIs $100k-200k , 90.9% for AGIs over 200k )
Averages for the 2004 tax year for zip code 49117, filed in 2005:
Average Adjusted Gross Income (AGI) in 2004: $50,807 (Individual Income Tax Returns) Here:
$50,807State:
$48,204
Salary/wage: $38,466 (reported on 72.5% of returns )Here:
$38,466State:
$42,791
(% of AGI for various income ranges: 457.0% for AGIs below $10k , 67.1% for AGIs $10k-25k , 65.5% for AGIs $25k-50k , 69.1% for AGIs $50k-75k , 61.9% for AGIs $75k-100k , 41.4% for AGIs over 100k ) Taxable interest for individuals: $3,637 (reported on 55.4% of returns )This zip code:
$3,637Michigan:
$1,725
(% of AGI for various income ranges: 100.3% for AGIs below $10k , 5.6% for AGIs $10k-25k , 2.7% for AGIs $25k-50k , 2.2% for AGIs $50k-75k , 1.4% for AGIs $75k-100k , 4.5% for AGIs over 100k ) Taxable dividends: $4,625 (reported on 31.4% of returns )(% of AGI for various income ranges: 30.5% for AGIs below $10k , 3.1% for AGIs $10k-25k , 3.0% for AGIs $25k-50k , 1.3% for AGIs $50k-75k , 2.5% for AGIs $75k-100k , 3.2% for AGIs over 100k ) Net capital gain/loss: +$17,501 (reported on 26.3% of returns )Here:
+$17,501State:
+$8,532
(% of AGI for various income ranges: 88.9% for AGIs below $10k , 0.4% for AGIs $10k-25k , 1.3% for AGIs $25k-50k , 1.8% for AGIs $50k-75k , 8.1% for AGIs $75k-100k , 14.6% for AGIs over 100k ) Profit/loss from business: +$16,601 (reported on 19.1% of returns )Here:
+$16,601State:
+$9,547
(% of AGI for various income ranges: 59.7% for AGIs below $10k , 10.0% for AGIs $10k-25k , 7.6% for AGIs $25k-50k , 6.6% for AGIs $50k-75k , -1.2% for AGIs $75k-100k , 6.6% for AGIs over 100k ) IRA payment deduction: $3,072 (reported on 3.9% of returns )49117:
$3,072Michigan:
$2,875
(% of AGI for various income ranges: 0.4% for AGIs $10k-25k , 0.7% for AGIs $25k-50k , 0.5% for AGIs $50k-75k , 0.1% for AGIs over 100k ) Self-employed pension: $23,944 (reported on 1.0% of returns )Here:
$23,944Michigan:
$13,826
Total itemized deductions: $24,148 (23% of AGI, reported on 33.7% of returns )Here:
$24,148State:
$18,509
Here:
22.9% of AGIState:
20.7% of AGI
(% of AGI for various income ranges: 103.9% for AGIs below $10k , 15.6% for AGIs $10k-25k , 14.0% for AGIs $25k-50k , 14.7% for AGIs $50k-75k , 15.2% for AGIs $75k-100k , 16.6% for AGIs over 100k ) Charity contributions deductions: $3,060 (3% of AGI, reported on 29.3% of returns )Here:
2.8% of AGIState:
3.6% of AGI
(% of AGI for various income ranges: 5.6% for AGIs below $10k , 1.1% for AGIs $10k-25k , 1.9% for AGIs $25k-50k , 1.4% for AGIs $50k-75k , 2.3% for AGIs $75k-100k , 1.8% for AGIs over 100k ) Total tax: $9,939 (reported on 71.9% of returns )(% of AGI for various income ranges: 25.2% for AGIs below $10k , 4.3% for AGIs $10k-25k , 7.3% for AGIs $25k-50k , 9.8% for AGIs $50k-75k , 11.3% for AGIs $75k-100k , 19.4% for AGIs over 100k ) Earned income credit: $1,502 (reported on 13.3% of returns )Percentage of individuals using paid preparers for their 2004 taxes: 65.4%(% for various income ranges: 56.0% for AGIs below $10k , 64.9% for AGIs $10k-25k , 66.7% for AGIs $25k-50k , 65.8% for AGIs $50k-75k , 68.3% for AGIs $75k-100k , 83.4% for AGIs over 100k )
Estimated median household income in 2022: This zip code:
$67,124Michigan:
$66,986
Nearest zip codes: 49129 ,
49116 ,
49128 ,
49115 ,
46371 ,
46360 .
Percentage of family households: This zip code:
23.0%Michigan:
43.3%
Percentage of households with unmarried partners: This zip code:
5.4%Michigan:
45.7%
Likely homosexual households (counted as self-reported same-sex unmarried-partner households)
Lesbian couples: 1.1% of all households Gay men: 0.1% of all households
Household received Food Stamps/SNAP in the past 12 months: 122Household did not receive Food Stamps/SNAP in the past 12 months: 1,667
Women who had a birth in the past 12 months: 11 (6 now married , 4 unmarried) Women who did not have a birth in the past 12 months: 435 (202 now married , 232 unmarried)
Housing units in zip code 49117 with a mortgage: 664 (58
second mortgage , 61
both second mortgage and home equity loan )
Houses without a mortgage: 18
Median monthly owner costs for units with a mortgage: $1,900
Median monthly owner costs for units without a mortgage: $747
Residents with income below the poverty level in 2022:
This zip code:
15.0%Whole state:
13.4%
Residents with income below 50% of the poverty level in 2022:
This zip code:
6.8%Whole state:
6.9%
Median number of rooms in houses and condos: Median number of rooms in apartments: Notable locations in this zip code not listed on our city pages
Click to draw/clear zip code borders Notable locations in zip code 49117: (A) , Lake Michigan Yacht Club (B) , Oselkas Snug Harbor Marina (C) , Grand Beach Station (D) , Grand Beach Golf Course (E) , Whittaker Woods Golf Course (F) , New Buffalo Station (G) , New Buffalo Township Fire Department Station 2 (H) , Medic 1 Emergency Medical Services New Buffalo (I) , New Buffalo City Hall (J) , New Buffalo Police Department (K) , New Buffalo Public Library (L) , New Buffalo Railroad Museum (M) , Grand Beach Police Department (N) , Michiana Village Police Department (O) , New Buffalo City Fire Department (P) . Display/hide their locations on the map
Churches in zip code 49117 include: (A) , Bible Baptist Church (B) , Living Way Foursquare Church (C) , Saint Mary of the Lake Church (D) , Lighthouse Village Church of God (E) , United Methodist Church (F) , Prince of Peace Lutheran Church (G) . Display/hide their locations on the map
Cemeteries: (1) , Pine Grove Cemetery (2) . Display/hide their locations on the map
Streams, rivers, and creeks: (A) , Blood Run (B) , Deer Creek (C) , White Ditch (D) . Display/hide their locations on the map
Parks in zip code 49117 include: (1) , New Buffalo Public Beach (2) . Display/hide their locations on the map
Year house built (houses)
1 2020 or later214 2010 to 2019546 2000 to 2009571 1990 to 1999546 1980 to 1989267 1970 to 1979477 1960 to 1969383 1950 to 1959111 1940 to 1949545 1939 or earlier
Zip code 49117 household income distribution in 2022 209 Less than $10,00067 $10,000 to $14,99986 $15,000 to $19,99976 $20,000 to $24,99967 $25,000 to $29,99993 $30,000 to $34,99974 $35,000 to $39,99952 $40,000 to $44,99918 $45,000 to $49,999108 $50,000 to $59,999183 $60,000 to $74,999117 $75,000 to $99,999125 $100,000 to $124,999130 $125,000 to $149,999156 $150,000 to $199,999245 $200,000 or moreEstimate of home value of owner-occupied houses/condos in 2022 in zip code 49117 11 $15,000 to $19,9994 $20,000 to $24,9997 $30,000 to $34,9998 $40,000 to $49,99916 $60,000 to $69,9995 $90,000 to $99,99934 $100,000 to $124,99917 $125,000 to $149,99932 $150,000 to $174,9993 $175,000 to $199,999172 $200,000 to $249,999108 $250,000 to $299,999301 $300,000 to $399,999189 $400,000 to $499,999308 $500,000 to $749,999116 $750,000 to $999,999111 $1,000,000 to $1,499,99969 $1,500,000 to $1,999,99970 $2,000,000 or moreRent paid by renters in 2022 in zip code 49117 4 $100 to $1494 $150 to $1993 $300 to $34921 $400 to $44914 $450 to $49914 $500 to $54914 $550 to $599145 $600 to $64912 $650 to $69916 $700 to $74912 $800 to $89922 $900 to $99967 $1,000 to $1,24913 $1,250 to $1,4996 $1,500 to $1,99919 No cash rent
Median gross rent in 2022: $706.
Median price asked for vacant for-sale houses and condos in 2022: $461,427.
Estimated median house (or condo) value in 2022 for: White Non-Hispanic householders: $462,639Black or African American householders: $238,961American Indian or Alaska Native householders: $281,334Two or more races householders: $419,571Estimated median house or condo value in 2022: $456,388
49117:
$456,388Michigan:
$224,400
Lower value quartile - upper value quartile: $285,494 - $798,396
Mean price in 2022: Detached houses: $270,584Here:
$270,584State:
$280,038
Townhouses or other attached units: $202,137Here:
$202,137State:
$239,520
In 2-unit structures: $135,034Here:
$135,034State:
$219,481
In 3-to-4-unit structures: $443,747Here:
$443,747State:
$207,067
In 5-or-more-unit structures: $415,224Here:
$415,224State:
$192,733
Mobile homes: $69,456Here:
$69,456State:
$72,868
Occupied boats, RVs, vans, etc.: $925,537Here:
$925,537State:
$102,281
Housing units in structures:
One, detached: 2,940One, attached: 138Two: 93 or 4: 1315 to 9: 15310 to 19: 520 to 49: 18950 or more: 75Mobile homes: 21Boats, RVs, vans, etc.: 7Unemployment : 7.4%
Means of transportation to work in zip code 49117 65.4% 955 Drove a car alone6.9% 101 Carpooled0.6% 9 Bus or trolley bus0.1% 1 Streetcar or trolley car1.4% 20 Subway or elevated0.1% 1 Taxi2.7% 39 Walked0.1% 2 Other means24.0% 351 Worked at homeTravel time to work (commute) in zip code 49117 146 Less than 5 minutes171 5 to 9 minutes196 10 to 14 minutes169 15 to 19 minutes80 20 to 24 minutes12 25 to 29 minutes105 30 to 34 minutes15 35 to 39 minutes55 40 to 44 minutes66 45 to 59 minutes41 60 to 89 minutes89 90 or more minutes
Percentage of zip code residents living and working in this county: 67.5%
Household type by relationship:
Households: 3,381
Male householders: 991 (331 living alone ), Female householders: 805 (386 living alone )791 spouses (773 opposite-sex spouses ), 45 unmarried partners , (43 opposite-sex unmarried partners ), 594 children (544 natural , 18 adopted , 32 stepchildren ), 31 grandchildren , 16 brothers or sisters , 38 parents , 0 foster children , 41 other relatives , 36 non-relatives In group quarters: 12 (-1 institutionalized population )
Size of family households: 709 2-persons , 152 3-persons , 135 4-persons , 34 5-persons , 5 7-or-more-persons
Size of nonfamily households: 717 1-person , 37 2-persons , 15 3-persons , 1 4-persons
281 married couples with children. single-parent households (4 men , 69 women ).
93.2% of residents of 49117 zip code speak English at home. of residents speak Spanish at home (92% very well, 8% not well ).of residents speak other Indo-European language at home (80% very well, 19% well, 1% not well ).of residents speak Asian or Pacific Island language at home (76% very well, 24% well ).
Foreign born population: 130 (3.9%)
(70.3%
of them are naturalized citizens )
This zip code:
3.9%Whole state:
6.9%
15% Honduras 15% France 10% Barbados 9% North Macedonia (Macedonia) 6% Croatia 5% China, excluding Hong Kong and Taiwan 5% Australia 18% Irish 15% German 10% Polish 6% American 5% Czech 5% European 4% English
Year of entry for the foreign-born population
19 2010 or later 22 2000 to 2009 9 1990 to 1999 86 Before 1990
Facilities with environmental interests located in this zip code:
BARTON FOOD MART (102 W. BUFFALO STREET in NEW BUFFALO, MI)
(Integrated Compliance Information System) - ICIS-05-2006-0003, ENFORCEMENT/COMPLIANCE ACTIVITY FORMAL ENFORCEMENT ACTION (Integrated Compliance Information System) - ICIS-05-2006-0003, ENFORCEMENT/COMPLIANCE ACTIVITY
MI DEPT/TRANSPORTATION R01-11015 R02-11 (I-94 OVER AMTRACK RAILROAD in NEW BUFFALO, MI)
(Resource Conservation and Recovery Act (tracking hazardous waste)) Organizations: MICH DEPT OF TRANSPORTATION (CONTACT/OPERATOR)
Alternative names: MIDOT BRIDGE I-94 OVER AMTRACK RR
MI DEPT/TRANSPORTATION BRIDGE (US-12 OVER GALIEN ROAD in NEW BUFFALO, MI)
(Resource Conservation and Recovery Act (tracking hazardous waste)) Organizations: MICH DEPT OF TRANSPORTATION (CONTACT/OPERATOR)
Alternative names: MIDOT BRIDGE US-12 OVER GALIEN RD
BERRY METAL CO (RTE 1 SAND RD in NEW BUFFALO, MI)
(Resource Conservation and Recovery Act (tracking hazardous waste))
MI DEPT/NATURAL RESOURCES (2 TRACK N OF KRUEGER ROAD in NEW BUFFALO, MI)
(Resource Conservation and Recovery Act (tracking hazardous waste)) Alternative names: MI DEPT/DNR
Housing units lacking complete plumbing facilities: 1.0%
Housing units lacking complete kitchen facilities: 0.8%
68.0% Utility gas 23.3% Electricity 6.4% Bottled, tank, or LP gas 1.9% Wood 0.5% Fuel oil, kerosene, etc.
Population in 1990: 4,389.
Place of birth for U.S.-born residents:
This state: 709Northeast: 270Midwest: 2,119South: 129West: 56
62% of the 49117 zip code residents lived in the same house 5 years ago.
Out of people who lived in different houses, 49% lived in this county.
Out of people who lived in different counties, 50% lived in Michigan.
86% of the 49117 zip code residents lived in the same house 1 year ago.
Out of people who lived in different houses, 61% moved from this county.
Out of people who lived in different houses, 5% moved from different county within same state.
Out of people who lived in different houses, 34% moved from different state.
Private vs. public school enrollment:
Students in private schools in grades 1 to 8 (elementary and middle school): 27
Students in private schools in grades 9 to 12 (high school): 19
Students in private undergraduate colleges: 11
Occupation by median earnings in the past 12 months ($)
145,286 Legal occupations 114,029 Business and financial operations occupations 101,393 Life, physical, and social science occupations 84,116 Computer and mathematical occupations 83,776 Transportation occupations 80,966 Management occupations
Companies with federal contracts located in this zip code:
GLOBAL PROCUREMENT SERVICES, L (12630 TURTLE CREEK DR in NEW BUFFALO, MI; small business) in 35 contracts from 2003 to 2005
Contracts for Office Information System Equipment, Communications Security Equipment and Components, ADP Input/Output and Storage Devices, ADP Components, and more by Navy, Air Force, Bureau of Land Management, Army, and others Signed by year: 2000: $0; 2001: $0; 2002: $0; 2003: $39,622; 2004: $272,826; 2005: $51,538; 2006: $0.
Biggest contracts: with Navy for Office Information System Equipment. Signed on 2004-09-14. Completion date: 2004-10-15.
with Navy for Communications Security Equipment and Components. Signed on 2003-08-28. Completion date: 2003-09-30.
with Navy for ADP Input/Output and Storage Devices. Signed on 2004-04-20. Completion date: 2004-05-20.
with Navy for ADP Components. Signed on 2004-04-21. Completion date: 2004-05-19.
VAN AIR MANUFACTURING INC (19015 US HIGHWAY 12 in NEW BUFFALO, MI; small business) in 2 contracts from 2004 to 2005
$16,337 with Army for Miscellaneous Vehicular Components. Signed on 2005-04-29. Completion date: 2005-01-07.
, same as above. Signed on 2004-11-23. Completion date: 2005-01-07.
Top industries in this zip code by the number of employees in 2005:
Accommodation and Food Services: Full-Service Restaurants (100-249 employees: 1 establishment, 20-49 employees: 7 establishments, 10-19 employees: 2 establishments, 5-9 employees: 2 establishments, 1-4 employees: 5 establishments)Accommodation and Food Services: Limited-Service Restaurants (20-49: 2, 5-9: 2, 1-4: 1)Arts, Entertainment, and Recreation: Golf Courses and Country Clubs (50-99: 1)Accommodation and Food Services: Hotels (except Casino Hotels) and Motels (20-49: 2, 1-4: 2)Other Services (except Public Administration): Religious Organizations (20-49: 1, 1-4: 3)Other Services (except Public Administration): Beauty Salons (10-19: 2, 5-9: 1)Finance and Insurance: Commercial Banking (20-49: 1, 1-4: 1)Finance and Insurance: Savings Institutions (20-49: 1)
People in group quarters in 2010:
11 people in group homes intended for adults
6 people in residential treatment centers for adults
People in group quarters in 2000:
18 people in other noninstitutional group quarters
8 people in homes for the mentally ill
4 people in other group homes
Fatal accident statistics in 2013:
Fatal accident count: 2Vehicles involved in fatal accidents: 6Fatal accidents caused by drunken drivers: 1Fatalities: 2Persons involved in fatal accidents: 12Pedestrians involved in fatal accidents: 0
Fatal accident statistics in 2012:
Fatal accident count: 2Vehicles involved in fatal accidents: 3Fatal accidents caused by drunken drivers: 1Fatalities: 3Persons involved in fatal accidents: 5Pedestrians involved in fatal accidents: 0
Home Mortgage Disclosure Act Aggregated Statistics For Year 2009(Based on 2 partial tracts) A) FHA, FSA/RHS & VA B) Conventional C) Refinancings D) Home Improvement Loans F) Non-occupant Loans on G) Loans On Manufactured Number Average Value Number Average Value Number Average Value Number Average Value Number Average Value Number Average Value
LOANS ORIGINATED 12 $170,148 115 $293,067 516 $254,687 15 $641,512 376 $303,395 8 $154,050 APPLICATIONS APPROVED, NOT ACCEPTED 5 $151,552 13 $246,223 28 $294,657 2 $7,495 30 $277,289 0 $0 APPLICATIONS DENIED 0 $0 10 $469,643 143 $260,979 3 $252,587 63 $327,502 2 $106,585 APPLICATIONS WITHDRAWN 0 $0 13 $371,256 58 $227,069 2 $11,660 43 $264,837 0 $0 FILES CLOSED FOR INCOMPLETENESS 0 $0 2 $666,160 25 $218,967 2 $49,960 17 $286,155 0 $0
Aggregated Statistics For Year 2008(Based on 2 partial tracts) A) FHA, FSA/RHS & VA B) Conventional C) Refinancings D) Home Improvement Loans F) Non-occupant Loans on G) Loans On Manufactured Number Average Value Number Average Value Number Average Value Number Average Value Number Average Value Number Average Value
LOANS ORIGINATED 2 $114,080 142 $336,634 288 $285,269 15 $79,495 260 $342,611 7 $98,734 APPLICATIONS APPROVED, NOT ACCEPTED 2 $114,080 32 $250,278 30 $296,885 0 $0 35 $294,252 0 $0 APPLICATIONS DENIED 2 $168,205 20 $293,943 88 $325,396 10 $90,431 47 $304,379 5 $155,216 APPLICATIONS WITHDRAWN 0 $0 13 $337,820 53 $255,560 2 $44,135 37 $323,088 2 $126,570 FILES CLOSED FOR INCOMPLETENESS 0 $0 2 $123,240 8 $320,174 2 $41,635 5 $269,128 0 $0
Aggregated Statistics For Year 2007(Based on 2 partial tracts) A) FHA, FSA/RHS & VA B) Conventional C) Refinancings D) Home Improvement Loans F) Non-occupant Loans on G) Loans On Manufactured Number Average Value Number Average Value Number Average Value Number Average Value Number Average Value Number Average Value
LOANS ORIGINATED 0 $0 192 $422,535 300 $277,633 27 $262,270 243 $397,489 3 $89,930 APPLICATIONS APPROVED, NOT ACCEPTED 0 $0 25 $392,435 48 $285,408 2 $41,635 27 $398,647 2 $13,325 APPLICATIONS DENIED 2 $146,555 35 $392,368 125 $272,273 15 $110,027 42 $441,252 2 $146,555 APPLICATIONS WITHDRAWN 0 $0 15 $328,528 80 $284,888 5 $275,458 30 $302,548 0 $0 FILES CLOSED FOR INCOMPLETENESS 0 $0 2 $229,825 18 $432,264 0 $0 7 $213,171 0 $0
Aggregated Statistics For Year 2006(Based on 2 partial tracts) A) FHA, FSA/RHS & VA B) Conventional C) Refinancings D) Home Improvement Loans E) Loans on Dwellings For 5+ Families F) Non-occupant Loans on G) Loans On Manufactured Number Average Value Number Average Value Number Average Value Number Average Value Number Average Value Number Average Value Number Average Value
LOANS ORIGINATED 2 $71,610 293 $330,886 303 $408,358 30 $148,387 7 $1,871,910 340 $449,638 0 $0 APPLICATIONS APPROVED, NOT ACCEPTED 0 $0 20 $327,668 52 $319,244 12 $185,553 0 $0 37 $340,417 2 $27,480 APPLICATIONS DENIED 0 $0 52 $388,294 112 $411,830 20 $73,777 0 $0 58 $431,712 5 $86,600 APPLICATIONS WITHDRAWN 2 $164,875 35 $300,153 82 $341,915 7 $142,749 0 $0 33 $377,238 0 $0 FILES CLOSED FOR INCOMPLETENESS 0 $0 10 $223,663 17 $254,022 0 $0 0 $0 8 $222,122 0 $0
Aggregated Statistics For Year 2005(Based on 2 partial tracts) A) FHA, FSA/RHS & VA B) Conventional C) Refinancings D) Home Improvement Loans F) Non-occupant Loans on G) Loans On Manufactured Number Average Value Number Average Value Number Average Value Number Average Value Number Average Value Number Average Value
LOANS ORIGINATED 2 $122,405 318 $325,224 395 $320,372 25 $81,738 410 $347,679 7 $97,544 APPLICATIONS APPROVED, NOT ACCEPTED 0 $0 18 $390,166 45 $302,770 3 $98,260 20 $335,828 3 $94,373 APPLICATIONS DENIED 2 $129,900 47 $253,672 172 $330,175 20 $56,707 63 $390,153 8 $77,232 APPLICATIONS WITHDRAWN 0 $0 32 $320,642 113 $248,999 8 $210,672 43 $394,119 0 $0 FILES CLOSED FOR INCOMPLETENESS 0 $0 13 $285,680 30 $497,510 2 $74,945 15 $412,686 2 $88,265
Aggregated Statistics For Year 2004(Based on 2 partial tracts) A) FHA, FSA/RHS & VA B) Conventional C) Refinancings D) Home Improvement Loans F) Non-occupant Loans on G) Loans On Manufactured Number Average Value Number Average Value Number Average Value Number Average Value Number Average Value Number Average Value
LOANS ORIGINATED 2 $119,075 286 $290,327 426 $210,661 28 $115,567 371 $272,201 2 $99,925 APPLICATIONS APPROVED, NOT ACCEPTED 0 $0 23 $387,387 28 $178,376 2 $4,165 15 $330,082 3 $99,370 APPLICATIONS DENIED 3 $169,870 35 $232,966 113 $219,759 15 $54,070 37 $430,213 12 $102,561 APPLICATIONS WITHDRAWN 0 $0 32 $355,927 77 $271,395 3 $22,207 23 $540,748 0 $0 FILES CLOSED FOR INCOMPLETENESS 0 $0 12 $291,445 27 $205,769 2 $12,490 5 $213,504 0 $0
Aggregated Statistics For Year 2003(Based on 2 partial tracts) A) FHA, FSA/RHS & VA B) Conventional C) Refinancings D) Home Improvement Loans F) Non-occupant Loans on Number Average Value Number Average Value Number Average Value Number Average Value Number Average Value
LOANS ORIGINATED 5 $145,890 293 $237,669 828 $213,038 7 $24,506 588 $249,246 APPLICATIONS APPROVED, NOT ACCEPTED 0 $0 8 $282,910 88 $174,280 3 $68,280 32 $190,636 APPLICATIONS DENIED 2 $170,705 22 $226,419 150 $197,827 5 $49,628 42 $281,968 APPLICATIONS WITHDRAWN 0 $0 13 $159,494 80 $186,421 2 $20,815 20 $338,992 FILES CLOSED FOR INCOMPLETENESS 0 $0 2 $124,905 23 $164,802 0 $0 10 $187,358
Aggregated Statistics For Year 2002(Based on 2 partial tracts) B) Conventional C) Refinancings D) Home Improvement Loans F) Non-occupant Loans on Number Average Value Number Average Value Number Average Value Number Average Value
LOANS ORIGINATED 266 $219,695 583 $191,598 13 $51,628 415 $217,862 APPLICATIONS APPROVED, NOT ACCEPTED 13 $167,181 78 $183,834 2 $22,485 32 $152,905 APPLICATIONS DENIED 18 $109,731 110 $169,038 13 $32,027 17 $242,462 APPLICATIONS WITHDRAWN 8 $99,300 100 $174,867 2 $124,905 28 $216,443 FILES CLOSED FOR INCOMPLETENESS 2 $416,350 20 $215,752 2 $20,815 5 $415,684
Aggregated Statistics For Year 2001(Based on 2 partial tracts) A) FHA, FSA/RHS & VA B) Conventional C) Refinancings D) Home Improvement Loans E) Loans on Dwellings For 5+ Families F) Non-occupant Loans on Number Average Value Number Average Value Number Average Value Number Average Value Number Average Value Number Average Value
LOANS ORIGINATED 2 $92,430 178 $207,838 460 $175,826 13 $37,023 2 $104,920 258 $227,392 APPLICATIONS APPROVED, NOT ACCEPTED 0 $0 7 $88,980 35 $90,360 3 $22,760 0 $0 13 $97,234 APPLICATIONS DENIED 0 $0 22 $137,623 88 $127,744 5 $41,636 0 $0 32 $223,944 APPLICATIONS WITHDRAWN 0 $0 22 $225,889 82 $204,702 0 $0 0 $0 25 $228,160 FILES CLOSED FOR INCOMPLETENESS 0 $0 2 $271,460 22 $100,757 0 $0 0 $0 3 $285,893
Aggregated Statistics For Year 2000(Based on 2 partial tracts) A) FHA, FSA/RHS & VA B) Conventional C) Refinancings D) Home Improvement Loans F) Non-occupant Loans on Number Average Value Number Average Value Number Average Value Number Average Value Number Average Value
LOANS ORIGINATED 7 $103,493 235 $198,374 125 $121,601 17 $20,181 153 $229,553 APPLICATIONS APPROVED, NOT ACCEPTED 0 $0 22 $127,327 30 $107,085 10 $38,304 8 $138,436 APPLICATIONS DENIED 0 $0 35 $85,839 47 $135,996 22 $25,208 13 $135,794 APPLICATIONS WITHDRAWN 2 $73,280 13 $125,930 43 $74,672 8 $26,022 8 $101,381 FILES CLOSED FOR INCOMPLETENESS 0 $0 5 $236,486 22 $94,095 5 $12,658 2 $171,535
Aggregated Statistics For Year 1999(Based on 1 partial tract) A) FHA, FSA/RHS & VA B) Conventional C) Refinancings D) Home Improvement Loans E) Loans on Dwellings For 5+ Families F) Non-occupant Loans on Number Average Value Number Average Value Number Average Value Number Average Value Number Average Value Number Average Value
LOANS ORIGINATED 3 $95,393 128 $189,199 135 $162,461 7 $94,407 2 $218,770 107 $223,904 APPLICATIONS APPROVED, NOT ACCEPTED 1 $50,450 6 $149,567 12 $78,850 2 $52,935 0 $0 4 $170,795 APPLICATIONS DENIED 2 $59,965 22 $120,681 33 $105,894 9 $20,493 0 $0 12 $170,107 APPLICATIONS WITHDRAWN 0 $0 9 $190,968 31 $107,390 0 $0 0 $0 10 $274,101 FILES CLOSED FOR INCOMPLETENESS 0 $0 2 $131,095 2 $451,185 0 $0 0 $0 1 $159,630
Detailed HMDA statistics for the following Tracts:
0113.00
Private Mortgage Insurance Companies Aggregated Statistics For Year 2009(Based on 2 partial tracts) A) Conventional B) Refinancings C) Non-occupant Loans on Number Average Value Number Average Value Number Average Value
LOANS ORIGINATED 5 $226,828 3 $214,280 2 $97,425 APPLICATIONS APPROVED, NOT ACCEPTED 0 $0 2 $222,330 0 $0 APPLICATIONS DENIED 0 $0 2 $157,380 0 $0 APPLICATIONS WITHDRAWN 0 $0 0 $0 0 $0 FILES CLOSED FOR INCOMPLETENESS 0 $0 0 $0 0 $0
Aggregated Statistics For Year 2008(Based on 2 partial tracts) A) Conventional B) Refinancings C) Non-occupant Loans on Number Average Value Number Average Value Number Average Value
LOANS ORIGINATED 13 $297,082 8 $250,435 8 $276,665 APPLICATIONS APPROVED, NOT ACCEPTED 15 $167,428 7 $242,197 8 $202,762 APPLICATIONS DENIED 7 $254,569 0 $0 3 $351,953 APPLICATIONS WITHDRAWN 2 $181,530 2 $125,740 0 $0 FILES CLOSED FOR INCOMPLETENESS 0 $0 0 $0 0 $0
Aggregated Statistics For Year 2007(Based on 2 partial tracts) A) Conventional B) Refinancings C) Non-occupant Loans on Number Average Value Number Average Value Number Average Value
LOANS ORIGINATED 25 $203,845 13 $272,613 17 $216,404 APPLICATIONS APPROVED, NOT ACCEPTED 7 $288,114 0 $0 5 $264,798 APPLICATIONS DENIED 7 $424,439 0 $0 0 $0 APPLICATIONS WITHDRAWN 0 $0 2 $201,515 0 $0 FILES CLOSED FOR INCOMPLETENESS 2 $266,465 0 $0 2 $266,465
Aggregated Statistics For Year 2006(Based on 2 partial tracts) A) Conventional B) Refinancings C) Non-occupant Loans on Number Average Value Number Average Value Number Average Value
LOANS ORIGINATED 23 $193,621 7 $175,104 17 $181,039 APPLICATIONS APPROVED, NOT ACCEPTED 5 $242,150 0 $0 2 $219,835 APPLICATIONS DENIED 0 $0 0 $0 0 $0 APPLICATIONS WITHDRAWN 0 $0 0 $0 0 $0 FILES CLOSED FOR INCOMPLETENESS 0 $0 0 $0 0 $0
Aggregated Statistics For Year 2005(Based on 2 partial tracts) A) Conventional B) Refinancings C) Non-occupant Loans on Number Average Value Number Average Value Number Average Value
LOANS ORIGINATED 28 $221,974 3 $187,080 20 $234,489 APPLICATIONS APPROVED, NOT ACCEPTED 0 $0 2 $291,445 0 $0 APPLICATIONS DENIED 0 $0 0 $0 0 $0 APPLICATIONS WITHDRAWN 0 $0 3 $133,787 0 $0 FILES CLOSED FOR INCOMPLETENESS 2 $54,960 2 $127,405 0 $0
Aggregated Statistics For Year 2004(Based on 2 partial tracts) A) Conventional B) Refinancings C) Non-occupant Loans on Number Average Value Number Average Value Number Average Value
LOANS ORIGINATED 28 $225,364 8 $169,455 17 $242,365 APPLICATIONS APPROVED, NOT ACCEPTED 0 $0 2 $217,335 2 $217,335 APPLICATIONS DENIED 2 $112,415 2 $507,115 0 $0 APPLICATIONS WITHDRAWN 3 $419,680 7 $137,514 2 $252,310 FILES CLOSED FOR INCOMPLETENESS 0 $0 0 $0 0 $0
Aggregated Statistics For Year 2003(Based on 2 partial tracts) A) Conventional B) Refinancings C) Non-occupant Loans on Number Average Value Number Average Value Number Average Value
LOANS ORIGINATED 55 $190,946 17 $137,249 45 $198,220 APPLICATIONS APPROVED, NOT ACCEPTED 3 $192,630 12 $199,154 3 $222,610 APPLICATIONS DENIED 3 $137,117 2 $187,355 5 $157,214 APPLICATIONS WITHDRAWN 3 $269,240 3 $155,437 3 $269,240 FILES CLOSED FOR INCOMPLETENESS 0 $0 0 $0 0 $0
Aggregated Statistics For Year 2002(Based on 2 partial tracts) A) Conventional B) Refinancings C) Non-occupant Loans on Number Average Value Number Average Value Number Average Value
LOANS ORIGINATED 45 $138,339 0 $0 27 $149,454 APPLICATIONS APPROVED, NOT ACCEPTED 8 $84,728 0 $0 3 $76,053 APPLICATIONS DENIED 0 $0 0 $0 0 $0 APPLICATIONS WITHDRAWN 2 $85,770 2 $63,285 0 $0 FILES CLOSED FOR INCOMPLETENESS 0 $0 0 $0 0 $0
Aggregated Statistics For Year 2001(Based on 2 partial tracts) A) Conventional B) Refinancings C) Non-occupant Loans on Number Average Value Number Average Value Number Average Value
LOANS ORIGINATED 17 $150,866 17 $88,658 7 $94,214 APPLICATIONS APPROVED, NOT ACCEPTED 7 $107,061 2 $164,875 0 $0 APPLICATIONS DENIED 2 $169,870 0 $0 0 $0 APPLICATIONS WITHDRAWN 0 $0 2 $69,945 0 $0 FILES CLOSED FOR INCOMPLETENESS 0 $0 0 $0 0 $0
Aggregated Statistics For Year 2000(Based on 2 partial tracts) A) Conventional B) Refinancings C) Non-occupant Loans on Number Average Value Number Average Value Number Average Value
LOANS ORIGINATED 42 $116,697 3 $108,250 25 $126,970 APPLICATIONS APPROVED, NOT ACCEPTED 0 $0 0 $0 0 $0 APPLICATIONS DENIED 3 $123,240 0 $0 0 $0 APPLICATIONS WITHDRAWN 0 $0 0 $0 0 $0 FILES CLOSED FOR INCOMPLETENESS 0 $0 0 $0 0 $0
Aggregated Statistics For Year 1999(Based on 1 partial tract) A) Conventional B) Refinancings C) Non-occupant Loans on Number Average Value Number Average Value Number Average Value
LOANS ORIGINATED 22 $137,110 5 $95,448 10 $148,630 APPLICATIONS APPROVED, NOT ACCEPTED 1 $164,590 0 $0 0 $0 APPLICATIONS DENIED 1 $95,120 0 $0 1 $95,120 APPLICATIONS WITHDRAWN 0 $0 0 $0 0 $0 FILES CLOSED FOR INCOMPLETENESS 1 $95,120 0 $0 1 $95,120
Detailed PMIC statistics for the following Tracts:
0113.00
2002 - 2018 National Fire Incident Reporting System (NFIRS) incidents See full 2006 National Fire Incident Reporting System statistics for zip code 49117, Michigan
Most common first names in zip code 49117 among deceased individuals Name Count Lived (average)
John 42 77.9 years William 35 75.9 years Frank 30 79.9 years Mary 29 78.2 years James 27 73.0 years Robert 25 70.5 years Joseph 25 76.8 years Edward 24 71.7 years Charles 19 72.5 years Helen 18 79.6 years
Most common last names in zip code 49117 among deceased individuals Last name Count Lived (average)
Krueger 10 72.6 years Smith 10 71.2 years Jones 8 62.5 years Schroeder 7 72.6 years Gropp 6 76.7 years Roberts 6 75.5 years Kruger 5 80.6 years Krycka 5 70.8 years Mrozek 5 72.0 years Kliss 5 60.4 years
Businesses in zip code 49117
Name Count Name Count
Comfort Inn 1 Pizza Hut 1 Curves 1 Quiznos 1 FedEx 2 Subway 1 Holiday Inn 1 U-Haul 1 Marriott 1 UPS 1 McDonald's 1 Wendy's 1
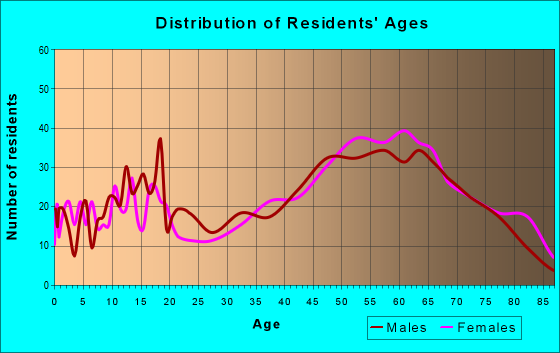
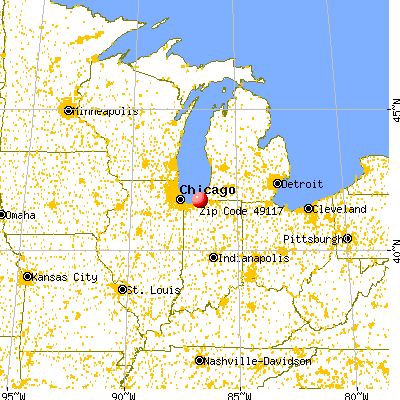


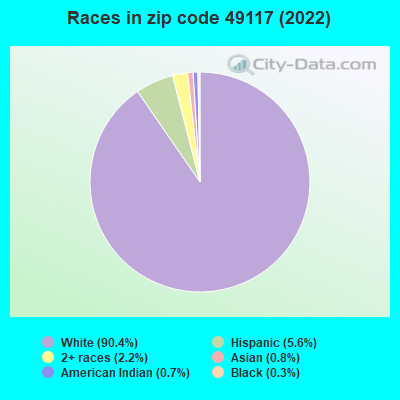


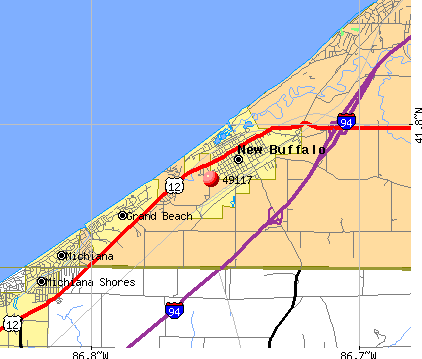 Nearest zip codes: 49129, 49116, 49128, 49115, 46371, 46360.
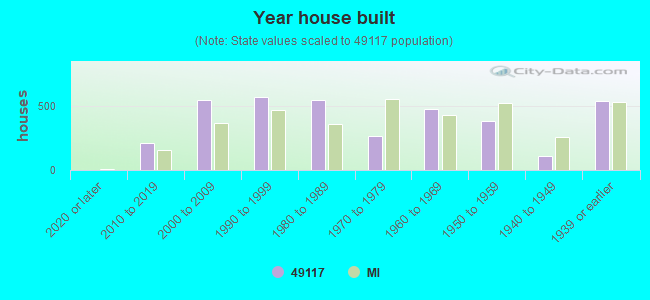
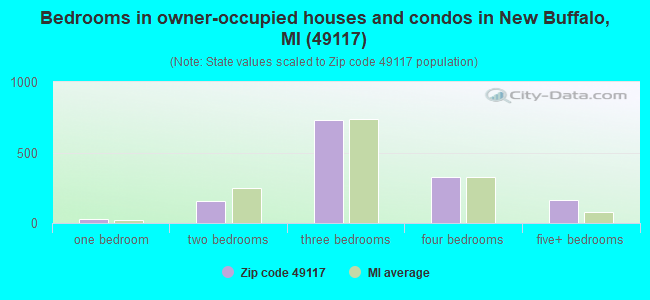
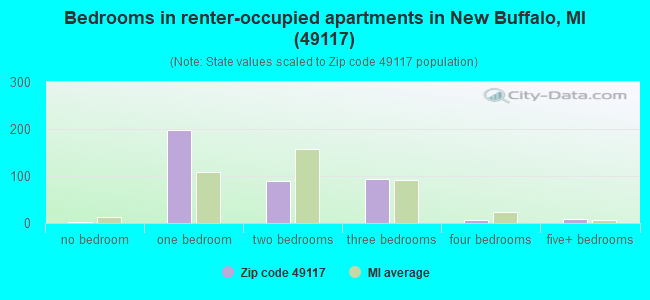
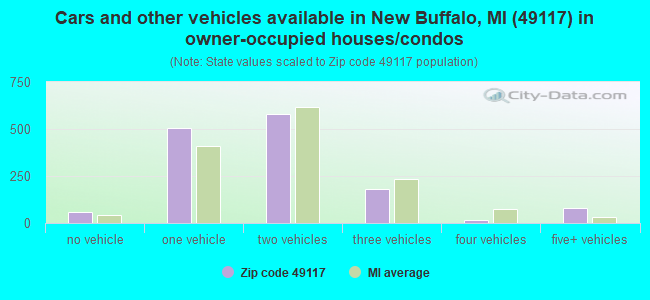
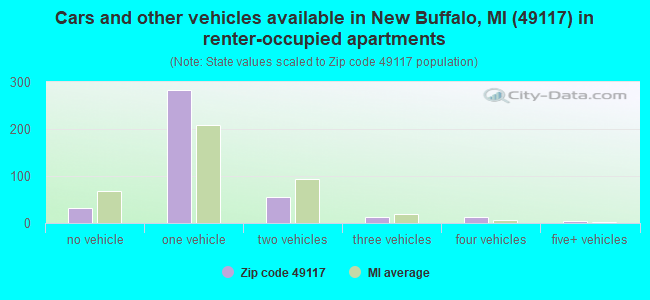


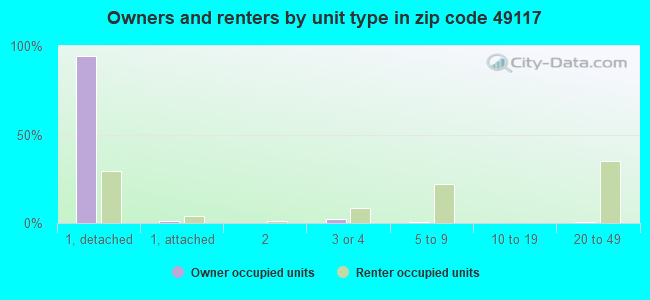
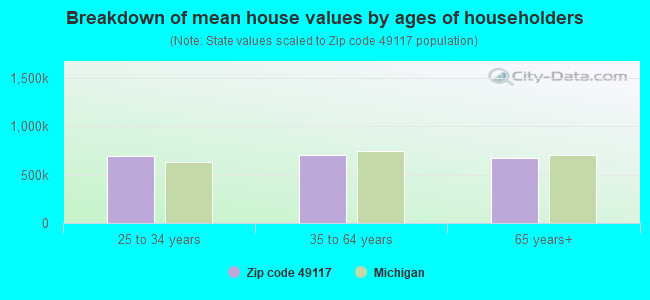


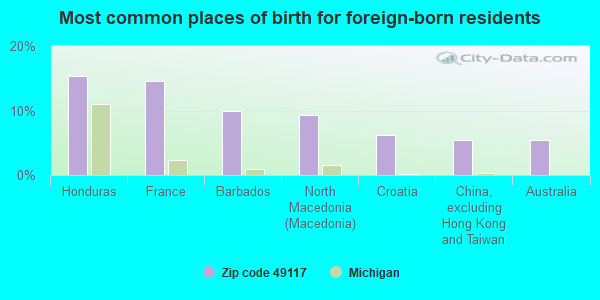
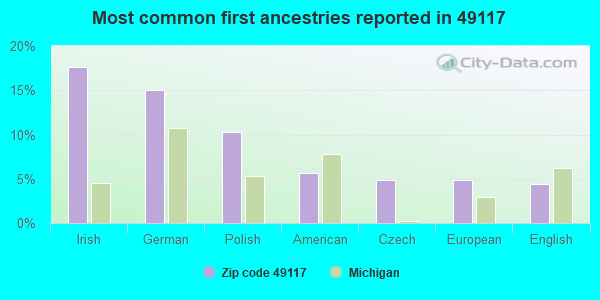
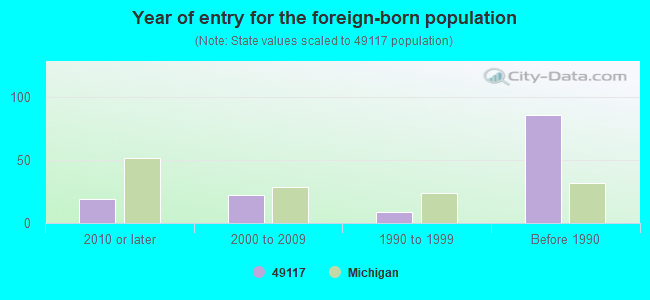
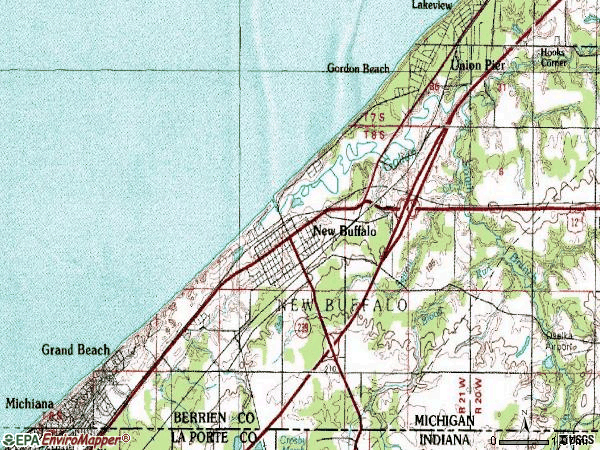

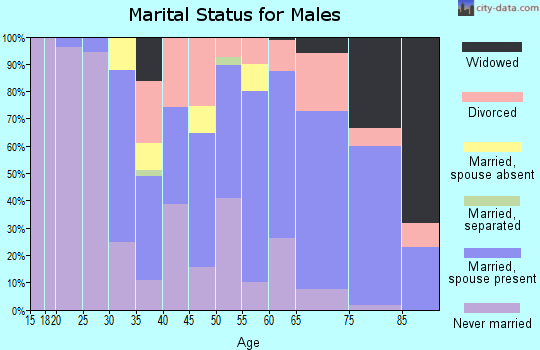
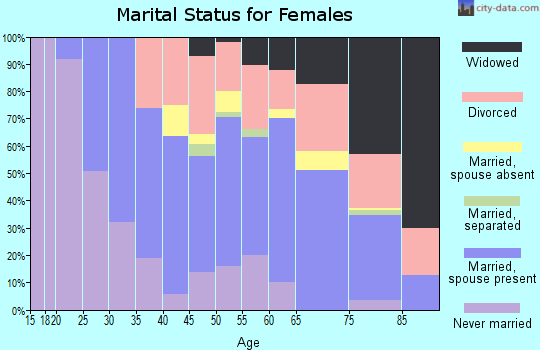
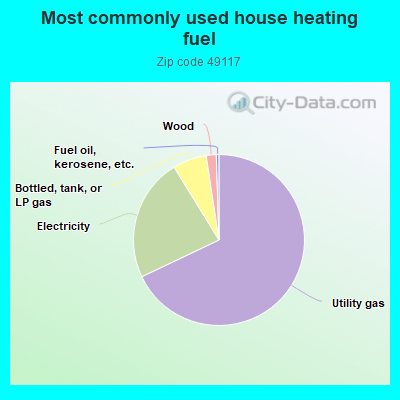
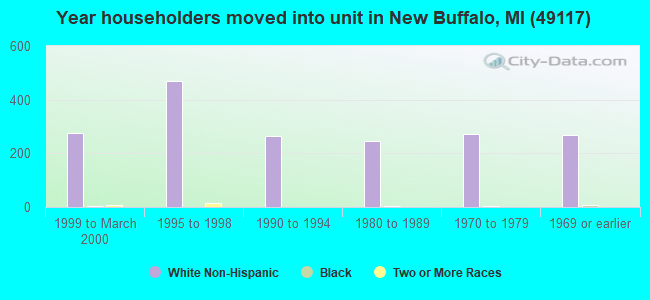
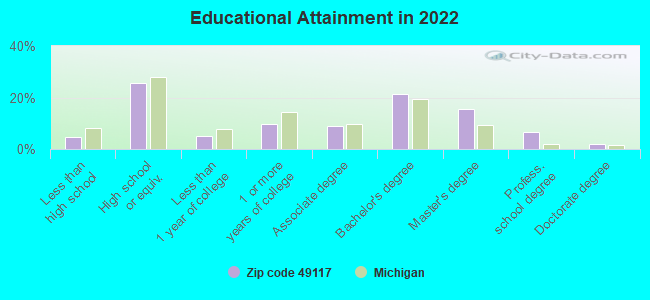
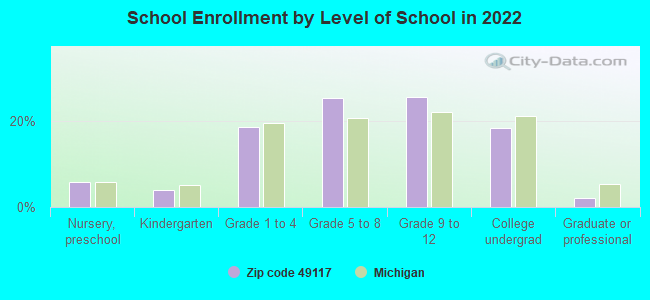
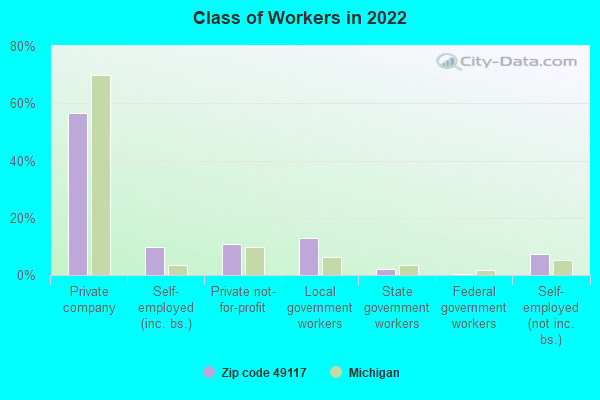
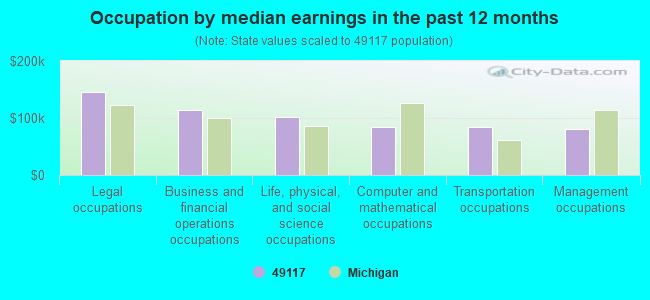
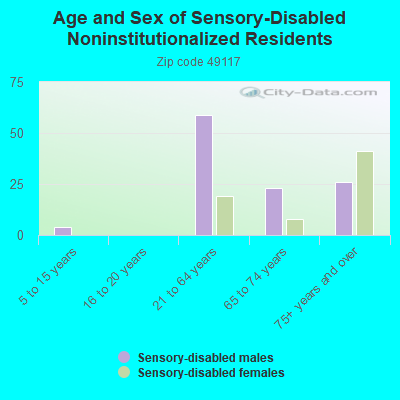
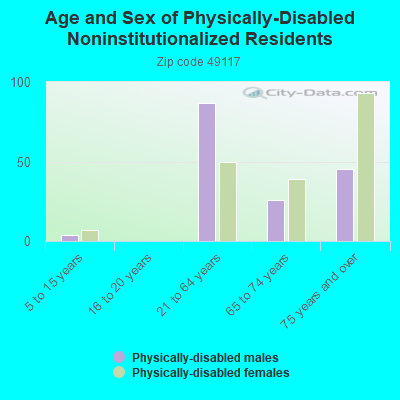
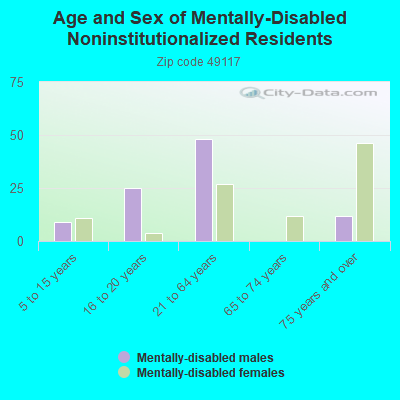
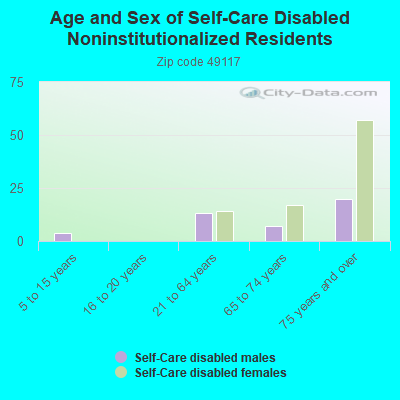
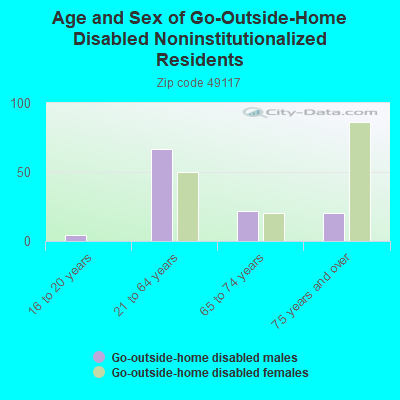

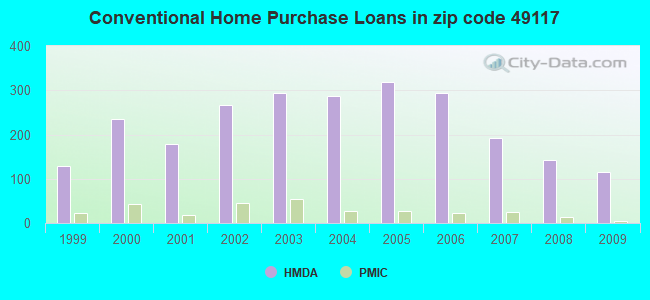
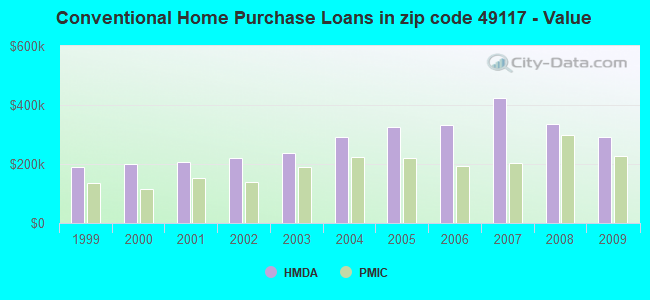
 According to the data from the years 2002 - 2018 the average number of fires per year is 25. The highest number of fires - 37 took place in 2013, and the least - 16 in 2010. The data has a growing trend.
 When looking into fire subcategories, the most reports belonged to: Outside Fires (39.0%), and Structure Fires (34.2%).