Estimated zip code population in 2022: 11,196
Zip code population in 2010: 10,694
Zip code population in 2000: 9,287
Houses and condos: 5,120
Renter-occupied apartments: 987
% of renters here:
22%State:
27%
March 2022 cost of living index in zip code 49127: 82.7
(low, U.S. average is 100)
Land area: 16.2
sq. mi.
Water area: 2.3
sq. mi.
Population density: 692 people per square mile (low).
OSM Map
General Map
Google Map
MSN Map
OSM Map
General Map
Google Map
MSN Map
OSM Map
General Map
Google Map
MSN Map
OSM Map
General Map
Google Map
MSN Map
Please wait while loading the map...
Real estate property taxes paid for housing units in 2022:
This zip code:
1.0% ($2,920)Michigan:
1.2% ($2,746)
Median real estate property taxes paid for housing units with mortgages in 2022: $3,087 (1.0%)
Median real estate property taxes paid for housing units with no mortgage in 2022: $2,699 (1.0%)
Profiles of local businesses
Business Search - 14 Million verified businesses
Males: 5,702 Females: 5,494
For population 25 years and over in 49127:
High school or higher: 98.3%Bachelor's degree or higher: 49.0%Graduate or professional degree: 16.1%Unemployed: 4.3%Mean travel time to work (commute): 18.2 minutes
For population 15 years and over in 49127:
Never married: 27.0%Now married: 54.8%Separated: 0.9%Widowed: 4.8%Divorced: 12.4%
Zip code 49127 compared to state average:
Black race population percentage significantly below state average. Length of stay since moving in above state average. Number of college students below state average. Percentage of population with a bachelor's degree or higher above state average. 9,510 85.0% White 587 5.2% Hispanic or Latino 467 4.2% Two or more races 439 3.9% Black 153 1.4% Asian 27 0.2% American Indian 8 0.07% Some other race
Data:
Median household income ($)
Median household income (% change since 2000)
Household income diversity
Ratio of average income to average house value (%)
Ratio of average income to average rent
Median household income ($) - White
Median household income ($) - Black or African American
Median household income ($) - Asian
Median household income ($) - Hispanic or Latino
Median household income ($) - American Indian and Alaska Native
Median household income ($) - Multirace
Median household income ($) - Other Race
Median household income for houses/condos with a mortgage ($)
Median household income for apartments without a mortgage ($)
Races - White alone (%)
Races - White alone (% change since 2000)
Races - Black alone (%)
Races - Black alone (% change since 2000)
Races - American Indian alone (%)
Races - American Indian alone (% change since 2000)
Races - Asian alone (%)
Races - Asian alone (% change since 2000)
Races - Hispanic (%)
Races - Hispanic (% change since 2000)
Races - Native Hawaiian and Other Pacific Islander alone (%)
Races - Native Hawaiian and Other Pacific Islander alone (% change since 2000)
Races - Two or more races (%)
Races - Two or more races (% change since 2000)
Races - Other race alone (%)
Races - Other race alone (% change since 2000)
Racial diversity
Unemployment (%)
Unemployment (% change since 2000)
Unemployment (%) - White
Unemployment (%) - Black or African American
Unemployment (%) - Asian
Unemployment (%) - Hispanic or Latino
Unemployment (%) - American Indian and Alaska Native
Unemployment (%) - Multirace
Unemployment (%) - Other Race
Population density (people per square mile)
Population - Males (%)
Population - Females (%)
Population - Males (%) - White
Population - Males (%) - Black or African American
Population - Males (%) - Asian
Population - Males (%) - Hispanic or Latino
Population - Males (%) - American Indian and Alaska Native
Population - Males (%) - Multirace
Population - Males (%) - Other Race
Population - Females (%) - White
Population - Females (%) - Black or African American
Population - Females (%) - Asian
Population - Females (%) - Hispanic or Latino
Population - Females (%) - American Indian and Alaska Native
Population - Females (%) - Multirace
Population - Females (%) - Other Race
Coronavirus confirmed cases (Apr 17, 2024)
Deaths caused by coronavirus (Apr 17, 2024)
Coronavirus confirmed cases (per 100k population) (Apr 17, 2024)
Deaths caused by coronavirus (per 100k population) (Apr 17, 2024)
Daily increase in number of cases (Apr 17, 2024)
Weekly increase in number of cases (Apr 17, 2024)
Cases doubled (in days) (Apr 17, 2024)
Hospitalized patients (Apr 18, 2022)
Negative test results (Apr 18, 2022)
Total test results (Apr 18, 2022)
COVID Vaccine doses distributed (per 100k population) (Sep 19, 2023)
COVID Vaccine doses administered (per 100k population) (Sep 19, 2023)
COVID Vaccine doses distributed (Sep 19, 2023)
COVID Vaccine doses administered (Sep 19, 2023)
Likely homosexual households (%)
Likely homosexual households (% change since 2000)
Likely homosexual households - Lesbian couples (%)
Likely homosexual households - Lesbian couples (% change since 2000)
Likely homosexual households - Gay men (%)
Likely homosexual households - Gay men (% change since 2000)
Cost of living index
Median gross rent ($)
Median contract rent ($)
Median monthly housing costs ($)
Median house or condo value ($)
Median house or condo value ($ change since 2000)
Mean house or condo value by units in structure - 1, detached ($)
Mean house or condo value by units in structure - 1, attached ($)
Mean house or condo value by units in structure - 2 ($)
Mean house or condo value by units in structure by units in structure - 3 or 4 ($)
Mean house or condo value by units in structure - 5 or more ($)
Mean house or condo value by units in structure - Boat, RV, van, etc. ($)
Mean house or condo value by units in structure - Mobile home ($)
Median house or condo value ($) - White
Median house or condo value ($) - Black or African American
Median house or condo value ($) - Asian
Median house or condo value ($) - Hispanic or Latino
Median house or condo value ($) - American Indian and Alaska Native
Median house or condo value ($) - Multirace
Median house or condo value ($) - Other Race
Median resident age
Resident age diversity
Median resident age - Males
Median resident age - Females
Median resident age - White
Median resident age - Black or African American
Median resident age - Asian
Median resident age - Hispanic or Latino
Median resident age - American Indian and Alaska Native
Median resident age - Multirace
Median resident age - Other Race
Median resident age - Males - White
Median resident age - Males - Black or African American
Median resident age - Males - Asian
Median resident age - Males - Hispanic or Latino
Median resident age - Males - American Indian and Alaska Native
Median resident age - Males - Multirace
Median resident age - Males - Other Race
Median resident age - Females - White
Median resident age - Females - Black or African American
Median resident age - Females - Asian
Median resident age - Females - Hispanic or Latino
Median resident age - Females - American Indian and Alaska Native
Median resident age - Females - Multirace
Median resident age - Females - Other Race
Commute - mean travel time to work (minutes)
Travel time to work - Less than 5 minutes (%)
Travel time to work - Less than 5 minutes (% change since 2000)
Travel time to work - 5 to 9 minutes (%)
Travel time to work - 5 to 9 minutes (% change since 2000)
Travel time to work - 10 to 19 minutes (%)
Travel time to work - 10 to 19 minutes (% change since 2000)
Travel time to work - 20 to 29 minutes (%)
Travel time to work - 20 to 29 minutes (% change since 2000)
Travel time to work - 30 to 39 minutes (%)
Travel time to work - 30 to 39 minutes (% change since 2000)
Travel time to work - 40 to 59 minutes (%)
Travel time to work - 40 to 59 minutes (% change since 2000)
Travel time to work - 60 to 89 minutes (%)
Travel time to work - 60 to 89 minutes (% change since 2000)
Travel time to work - 90 or more minutes (%)
Travel time to work - 90 or more minutes (% change since 2000)
Marital status - Never married (%)
Marital status - Now married (%)
Marital status - Separated (%)
Marital status - Widowed (%)
Marital status - Divorced (%)
Median family income ($)
Median family income (% change since 2000)
Median non-family income ($)
Median non-family income (% change since 2000)
Median per capita income ($)
Median per capita income (% change since 2000)
Median family income ($) - White
Median family income ($) - Black or African American
Median family income ($) - Asian
Median family income ($) - Hispanic or Latino
Median family income ($) - American Indian and Alaska Native
Median family income ($) - Multirace
Median family income ($) - Other Race
Median year house/condo built
Median year apartment built
Year house built - Built 2005 or later (%)
Year house built - Built 2000 to 2004 (%)
Year house built - Built 1990 to 1999 (%)
Year house built - Built 1980 to 1989 (%)
Year house built - Built 1970 to 1979 (%)
Year house built - Built 1960 to 1969 (%)
Year house built - Built 1950 to 1959 (%)
Year house built - Built 1940 to 1949 (%)
Year house built - Built 1939 or earlier (%)
Average household size
Household density (households per square mile)
Average household size - White
Average household size - Black or African American
Average household size - Asian
Average household size - Hispanic or Latino
Average household size - American Indian and Alaska Native
Average household size - Multirace
Average household size - Other Race
Occupied housing units (%)
Vacant housing units (%)
Owner occupied housing units (%)
Renter occupied housing units (%)
Vacancy status - For rent (%)
Vacancy status - For sale only (%)
Vacancy status - Rented or sold, not occupied (%)
Vacancy status - For seasonal, recreational, or occasional use (%)
Vacancy status - For migrant workers (%)
Vacancy status - Other vacant (%)
Residents with income below the poverty level (%)
Residents with income below 50% of the poverty level (%)
Children below poverty level (%)
Poor families by family type - Married-couple family (%)
Poor families by family type - Male, no wife present (%)
Poor families by family type - Female, no husband present (%)
Poverty status for native-born residents (%)
Poverty status for foreign-born residents (%)
Poverty among high school graduates not in families (%)
Poverty among people who did not graduate high school not in families (%)
Residents with income below the poverty level (%) - White
Residents with income below the poverty level (%) - Black or African American
Residents with income below the poverty level (%) - Asian
Residents with income below the poverty level (%) - Hispanic or Latino
Residents with income below the poverty level (%) - American Indian and Alaska Native
Residents with income below the poverty level (%) - Multirace
Residents with income below the poverty level (%) - Other Race
Air pollution - Air Quality Index (AQI)
Air pollution - CO
Air pollution - NO2
Air pollution - SO2
Air pollution - Ozone
Air pollution - PM10
Air pollution - PM25
Air pollution - Pb
Crime - Murders per 100,000 population
Crime - Rapes per 100,000 population
Crime - Robberies per 100,000 population
Crime - Assaults per 100,000 population
Crime - Burglaries per 100,000 population
Crime - Thefts per 100,000 population
Crime - Auto thefts per 100,000 population
Crime - Arson per 100,000 population
Crime - City-data.com crime index
Crime - Violent crime index
Crime - Property crime index
Crime - Murders per 100,000 population (5 year average)
Crime - Rapes per 100,000 population (5 year average)
Crime - Robberies per 100,000 population (5 year average)
Crime - Assaults per 100,000 population (5 year average)
Crime - Burglaries per 100,000 population (5 year average)
Crime - Thefts per 100,000 population (5 year average)
Crime - Auto thefts per 100,000 population (5 year average)
Crime - Arson per 100,000 population (5 year average)
Crime - City-data.com crime index (5 year average)
Crime - Violent crime index (5 year average)
Crime - Property crime index (5 year average)
1996 Presidential Elections Results (%) - Democratic Party (Clinton)
1996 Presidential Elections Results (%) - Republican Party (Dole)
1996 Presidential Elections Results (%) - Other
2000 Presidential Elections Results (%) - Democratic Party (Gore)
2000 Presidential Elections Results (%) - Republican Party (Bush)
2000 Presidential Elections Results (%) - Other
2004 Presidential Elections Results (%) - Democratic Party (Kerry)
2004 Presidential Elections Results (%) - Republican Party (Bush)
2004 Presidential Elections Results (%) - Other
2008 Presidential Elections Results (%) - Democratic Party (Obama)
2008 Presidential Elections Results (%) - Republican Party (McCain)
2008 Presidential Elections Results (%) - Other
2012 Presidential Elections Results (%) - Democratic Party (Obama)
2012 Presidential Elections Results (%) - Republican Party (Romney)
2012 Presidential Elections Results (%) - Other
2016 Presidential Elections Results (%) - Democratic Party (Clinton)
2016 Presidential Elections Results (%) - Republican Party (Trump)
2016 Presidential Elections Results (%) - Other
2020 Presidential Elections Results (%) - Democratic Party (Biden)
2020 Presidential Elections Results (%) - Republican Party (Trump)
2020 Presidential Elections Results (%) - Other
Ancestries Reported - Arab (%)
Ancestries Reported - Czech (%)
Ancestries Reported - Danish (%)
Ancestries Reported - Dutch (%)
Ancestries Reported - English (%)
Ancestries Reported - French (%)
Ancestries Reported - French Canadian (%)
Ancestries Reported - German (%)
Ancestries Reported - Greek (%)
Ancestries Reported - Hungarian (%)
Ancestries Reported - Irish (%)
Ancestries Reported - Italian (%)
Ancestries Reported - Lithuanian (%)
Ancestries Reported - Norwegian (%)
Ancestries Reported - Polish (%)
Ancestries Reported - Portuguese (%)
Ancestries Reported - Russian (%)
Ancestries Reported - Scotch-Irish (%)
Ancestries Reported - Scottish (%)
Ancestries Reported - Slovak (%)
Ancestries Reported - Subsaharan African (%)
Ancestries Reported - Swedish (%)
Ancestries Reported - Swiss (%)
Ancestries Reported - Ukrainian (%)
Ancestries Reported - United States (%)
Ancestries Reported - Welsh (%)
Ancestries Reported - West Indian (%)
Ancestries Reported - Other (%)
Educational Attainment - No schooling completed (%)
Educational Attainment - Less than high school (%)
Educational Attainment - High school or equivalent (%)
Educational Attainment - Less than 1 year of college (%)
Educational Attainment - 1 or more years of college (%)
Educational Attainment - Associate degree (%)
Educational Attainment - Bachelor's degree (%)
Educational Attainment - Master's degree (%)
Educational Attainment - Professional school degree (%)
Educational Attainment - Doctorate degree (%)
School Enrollment - Nursery, preschool (%)
School Enrollment - Kindergarten (%)
School Enrollment - Grade 1 to 4 (%)
School Enrollment - Grade 5 to 8 (%)
School Enrollment - Grade 9 to 12 (%)
School Enrollment - College undergrad (%)
School Enrollment - Graduate or professional (%)
School Enrollment - Not enrolled in school (%)
School enrollment - Public schools (%)
School enrollment - Private schools (%)
School enrollment - Not enrolled (%)
Median number of rooms in houses and condos
Median number of rooms in apartments
Housing units lacking complete plumbing facilities (%)
Housing units lacking complete kitchen facilities (%)
Density of houses
Urban houses (%)
Rural houses (%)
Households with people 60 years and over (%)
Households with people 65 years and over (%)
Households with people 75 years and over (%)
Households with one or more nonrelatives (%)
Households with no nonrelatives (%)
Population in households (%)
Family households (%)
Nonfamily households (%)
Population in families (%)
Family households with own children (%)
Median number of bedrooms in owner occupied houses
Mean number of bedrooms in owner occupied houses
Median number of bedrooms in renter occupied houses
Mean number of bedrooms in renter occupied houses
Median number of vehichles in owner occupied houses
Mean number of vehichles in owner occupied houses
Median number of vehichles in renter occupied houses
Mean number of vehichles in renter occupied houses
Mortgage status - with mortgage (%)
Mortgage status - with second mortgage (%)
Mortgage status - with home equity loan (%)
Mortgage status - with both second mortgage and home equity loan (%)
Mortgage status - without a mortgage (%)
Average family size
Average family size - White
Average family size - Black or African American
Average family size - Asian
Average family size - Hispanic or Latino
Average family size - American Indian and Alaska Native
Average family size - Multirace
Average family size - Other Race
Geographical mobility - Same house 1 year ago (%)
Geographical mobility - Moved within same county (%)
Geographical mobility - Moved from different county within same state (%)
Geographical mobility - Moved from different state (%)
Geographical mobility - Moved from abroad (%)
Place of birth - Born in state of residence (%)
Place of birth - Born in other state (%)
Place of birth - Native, outside of US (%)
Place of birth - Foreign born (%)
Housing units in structures - 1, detached (%)
Housing units in structures - 1, attached (%)
Housing units in structures - 2 (%)
Housing units in structures - 3 or 4 (%)
Housing units in structures - 5 to 9 (%)
Housing units in structures - 10 to 19 (%)
Housing units in structures - 20 to 49 (%)
Housing units in structures - 50 or more (%)
Housing units in structures - Mobile home (%)
Housing units in structures - Boat, RV, van, etc. (%)
House/condo owner moved in on average (years ago)
Renter moved in on average (years ago)
Year householder moved into unit - Moved in 1999 to March 2000 (%)
Year householder moved into unit - Moved in 1995 to 1998 (%)
Year householder moved into unit - Moved in 1990 to 1994 (%)
Year householder moved into unit - Moved in 1980 to 1989 (%)
Year householder moved into unit - Moved in 1970 to 1979 (%)
Year householder moved into unit - Moved in 1969 or earlier (%)
Means of transportation to work - Drove car alone (%)
Means of transportation to work - Carpooled (%)
Means of transportation to work - Public transportation (%)
Means of transportation to work - Bus or trolley bus (%)
Means of transportation to work - Streetcar or trolley car (%)
Means of transportation to work - Subway or elevated (%)
Means of transportation to work - Railroad (%)
Means of transportation to work - Ferryboat (%)
Means of transportation to work - Taxicab (%)
Means of transportation to work - Motorcycle (%)
Means of transportation to work - Bicycle (%)
Means of transportation to work - Walked (%)
Means of transportation to work - Other means (%)
Working at home (%)
Industry diversity
Most Common Industries - Agriculture, forestry, fishing and hunting, and mining (%)
Most Common Industries - Agriculture, forestry, fishing and hunting (%)
Most Common Industries - Mining, quarrying, and oil and gas extraction (%)
Most Common Industries - Construction (%)
Most Common Industries - Manufacturing (%)
Most Common Industries - Wholesale trade (%)
Most Common Industries - Retail trade (%)
Most Common Industries - Transportation and warehousing, and utilities (%)
Most Common Industries - Transportation and warehousing (%)
Most Common Industries - Utilities (%)
Most Common Industries - Information (%)
Most Common Industries - Finance and insurance, and real estate and rental and leasing (%)
Most Common Industries - Finance and insurance (%)
Most Common Industries - Real estate and rental and leasing (%)
Most Common Industries - Professional, scientific, and management, and administrative and waste management services (%)
Most Common Industries - Professional, scientific, and technical services (%)
Most Common Industries - Management of companies and enterprises (%)
Most Common Industries - Administrative and support and waste management services (%)
Most Common Industries - Educational services, and health care and social assistance (%)
Most Common Industries - Educational services (%)
Most Common Industries - Health care and social assistance (%)
Most Common Industries - Arts, entertainment, and recreation, and accommodation and food services (%)
Most Common Industries - Arts, entertainment, and recreation (%)
Most Common Industries - Accommodation and food services (%)
Most Common Industries - Other services, except public administration (%)
Most Common Industries - Public administration (%)
Occupation diversity
Most Common Occupations - Management, business, science, and arts occupations (%)
Most Common Occupations - Management, business, and financial occupations (%)
Most Common Occupations - Management occupations (%)
Most Common Occupations - Business and financial operations occupations (%)
Most Common Occupations - Computer, engineering, and science occupations (%)
Most Common Occupations - Computer and mathematical occupations (%)
Most Common Occupations - Architecture and engineering occupations (%)
Most Common Occupations - Life, physical, and social science occupations (%)
Most Common Occupations - Education, legal, community service, arts, and media occupations (%)
Most Common Occupations - Community and social service occupations (%)
Most Common Occupations - Legal occupations (%)
Most Common Occupations - Education, training, and library occupations (%)
Most Common Occupations - Arts, design, entertainment, sports, and media occupations (%)
Most Common Occupations - Healthcare practitioners and technical occupations (%)
Most Common Occupations - Health diagnosing and treating practitioners and other technical occupations (%)
Most Common Occupations - Health technologists and technicians (%)
Most Common Occupations - Service occupations (%)
Most Common Occupations - Healthcare support occupations (%)
Most Common Occupations - Protective service occupations (%)
Most Common Occupations - Fire fighting and prevention, and other protective service workers including supervisors (%)
Most Common Occupations - Law enforcement workers including supervisors (%)
Most Common Occupations - Food preparation and serving related occupations (%)
Most Common Occupations - Building and grounds cleaning and maintenance occupations (%)
Most Common Occupations - Personal care and service occupations (%)
Most Common Occupations - Sales and office occupations (%)
Most Common Occupations - Sales and related occupations (%)
Most Common Occupations - Office and administrative support occupations (%)
Most Common Occupations - Natural resources, construction, and maintenance occupations (%)
Most Common Occupations - Farming, fishing, and forestry occupations (%)
Most Common Occupations - Construction and extraction occupations (%)
Most Common Occupations - Installation, maintenance, and repair occupations (%)
Most Common Occupations - Production, transportation, and material moving occupations (%)
Most Common Occupations - Production occupations (%)
Most Common Occupations - Transportation occupations (%)
Most Common Occupations - Material moving occupations (%)
People in Group quarters - Institutionalized population (%)
People in Group quarters - Correctional institutions (%)
People in Group quarters - Federal prisons and detention centers (%)
People in Group quarters - Halfway houses (%)
People in Group quarters - Local jails and other confinement facilities (including police lockups) (%)
People in Group quarters - Military disciplinary barracks (%)
People in Group quarters - State prisons (%)
People in Group quarters - Other types of correctional institutions (%)
People in Group quarters - Nursing homes (%)
People in Group quarters - Hospitals/wards, hospices, and schools for the handicapped (%)
People in Group quarters - Hospitals/wards and hospices for chronically ill (%)
People in Group quarters - Hospices or homes for chronically ill (%)
People in Group quarters - Military hospitals or wards for chronically ill (%)
People in Group quarters - Other hospitals or wards for chronically ill (%)
People in Group quarters - Hospitals or wards for drug/alcohol abuse (%)
People in Group quarters - Mental (Psychiatric) hospitals or wards (%)
People in Group quarters - Schools, hospitals, or wards for the mentally retarded (%)
People in Group quarters - Schools, hospitals, or wards for the physically handicapped (%)
People in Group quarters - Institutions for the deaf (%)
People in Group quarters - Institutions for the blind (%)
People in Group quarters - Orthopedic wards and institutions for the physically handicapped (%)
People in Group quarters - Wards in general hospitals for patients who have no usual home elsewhere (%)
People in Group quarters - Wards in military hospitals for patients who have no usual home elsewhere (%)
People in Group quarters - Juvenile institutions (%)
People in Group quarters - Long-term care (%)
People in Group quarters - Homes for abused, dependent, and neglected children (%)
People in Group quarters - Residential treatment centers for emotionally disturbed children (%)
People in Group quarters - Training schools for juvenile delinquents (%)
People in Group quarters - Short-term care, detention or diagnostic centers for delinquent children (%)
People in Group quarters - Type of juvenile institution unknown (%)
People in Group quarters - Noninstitutionalized population (%)
People in Group quarters - College dormitories (includes college quarters off campus) (%)
People in Group quarters - Military quarters (%)
People in Group quarters - On base (%)
People in Group quarters - Barracks, unaccompanied personnel housing (UPH), (Enlisted/Officer), ;and similar group living quarters for military personnel (%)
People in Group quarters - Transient quarters for temporary residents (%)
People in Group quarters - Military ships (%)
People in Group quarters - Group homes (%)
People in Group quarters - Homes or halfway houses for drug/alcohol abuse (%)
People in Group quarters - Homes for the mentally ill (%)
People in Group quarters - Homes for the mentally retarded (%)
People in Group quarters - Homes for the physically handicapped (%)
People in Group quarters - Other group homes (%)
People in Group quarters - Religious group quarters (%)
People in Group quarters - Dormitories (%)
People in Group quarters - Agriculture workers' dormitories on farms (%)
People in Group quarters - Job Corps and vocational training facilities (%)
People in Group quarters - Other workers' dormitories (%)
People in Group quarters - Crews of maritime vessels (%)
People in Group quarters - Other nonhousehold living situations (%)
People in Group quarters - Other noninstitutional group quarters (%)
Residents speaking English at home (%)
Residents speaking English at home - Born in the United States (%)
Residents speaking English at home - Native, born elsewhere (%)
Residents speaking English at home - Foreign born (%)
Residents speaking Spanish at home (%)
Residents speaking Spanish at home - Born in the United States (%)
Residents speaking Spanish at home - Native, born elsewhere (%)
Residents speaking Spanish at home - Foreign born (%)
Residents speaking other language at home (%)
Residents speaking other language at home - Born in the United States (%)
Residents speaking other language at home - Native, born elsewhere (%)
Residents speaking other language at home - Foreign born (%)
Class of Workers - Employee of private company (%)
Class of Workers - Self-employed in own incorporated business (%)
Class of Workers - Private not-for-profit wage and salary workers (%)
Class of Workers - Local government workers (%)
Class of Workers - State government workers (%)
Class of Workers - Federal government workers (%)
Class of Workers - Self-employed workers in own not incorporated business and Unpaid family workers (%)
House heating fuel used in houses and condos - Utility gas (%)
House heating fuel used in houses and condos - Bottled, tank, or LP gas (%)
House heating fuel used in houses and condos - Electricity (%)
House heating fuel used in houses and condos - Fuel oil, kerosene, etc. (%)
House heating fuel used in houses and condos - Coal or coke (%)
House heating fuel used in houses and condos - Wood (%)
House heating fuel used in houses and condos - Solar energy (%)
House heating fuel used in houses and condos - Other fuel (%)
House heating fuel used in houses and condos - No fuel used (%)
House heating fuel used in apartments - Utility gas (%)
House heating fuel used in apartments - Bottled, tank, or LP gas (%)
House heating fuel used in apartments - Electricity (%)
House heating fuel used in apartments - Fuel oil, kerosene, etc. (%)
House heating fuel used in apartments - Coal or coke (%)
House heating fuel used in apartments - Wood (%)
House heating fuel used in apartments - Solar energy (%)
House heating fuel used in apartments - Other fuel (%)
House heating fuel used in apartments - No fuel used (%)
Armed forces status - In Armed Forces (%)
Armed forces status - Civilian (%)
Armed forces status - Civilian - Veteran (%)
Armed forces status - Civilian - Nonveteran (%)
Fatal accidents locations in years 2005-2021
Fatal accidents locations in 2005
Fatal accidents locations in 2006
Fatal accidents locations in 2007
Fatal accidents locations in 2008
Fatal accidents locations in 2009
Fatal accidents locations in 2010
Fatal accidents locations in 2011
Fatal accidents locations in 2012
Fatal accidents locations in 2013
Fatal accidents locations in 2014
Fatal accidents locations in 2015
Fatal accidents locations in 2016
Fatal accidents locations in 2017
Fatal accidents locations in 2018
Fatal accidents locations in 2019
Fatal accidents locations in 2020
Fatal accidents locations in 2021
Alcohol use - People drinking some alcohol every month (%)
Alcohol use - People not drinking at all (%)
Alcohol use - Average days/month drinking alcohol
Alcohol use - Average drinks/week
Alcohol use - Average days/year people drink much
Audiometry - Average condition of hearing (%)
Audiometry - People that can hear a whisper from across a quiet room (%)
Audiometry - People that can hear normal voice from across a quiet room (%)
Audiometry - Ears ringing, roaring, buzzing (%)
Audiometry - Had a job exposure to loud noise (%)
Audiometry - Had off-work exposure to loud noise (%)
Blood Pressure & Cholesterol - Has high blood pressure (%)
Blood Pressure & Cholesterol - Checking blood pressure at home (%)
Blood Pressure & Cholesterol - Frequently checking blood cholesterol (%)
Blood Pressure & Cholesterol - Has high cholesterol level (%)
Consumer Behavior - Money monthly spent on food at supermarket/grocery store
Consumer Behavior - Money monthly spent on food at other stores
Consumer Behavior - Money monthly spent on eating out
Consumer Behavior - Money monthly spent on carryout/delivered foods
Consumer Behavior - Income spent on food at supermarket/grocery store (%)
Consumer Behavior - Income spent on food at other stores (%)
Consumer Behavior - Income spent on eating out (%)
Consumer Behavior - Income spent on carryout/delivered foods (%)
Current Health Status - General health condition (%)
Current Health Status - Blood donors (%)
Current Health Status - Has blood ever tested for HIV virus (%)
Current Health Status - Left-handed people (%)
Dermatology - People using sunscreen (%)
Diabetes - Diabetics (%)
Diabetes - Had a blood test for high blood sugar (%)
Diabetes - People taking insulin (%)
Diet Behavior & Nutrition - Diet health (%)
Diet Behavior & Nutrition - Milk product consumption (# of products/month)
Diet Behavior & Nutrition - Meals not home prepared (#/week)
Diet Behavior & Nutrition - Meals from fast food or pizza place (#/week)
Diet Behavior & Nutrition - Ready-to-eat foods (#/month)
Diet Behavior & Nutrition - Frozen meals/pizza (#/month)
Drug Use - People that ever used marijuana or hashish (%)
Drug Use - Ever used hard drugs (%)
Drug Use - Ever used any form of cocaine (%)
Drug Use - Ever used heroin (%)
Drug Use - Ever used methamphetamine (%)
Health Insurance - People covered by health insurance (%)
Kidney Conditions-Urology - Avg. # of times urinating at night
Medical Conditions - People with asthma (%)
Medical Conditions - People with anemia (%)
Medical Conditions - People with psoriasis (%)
Medical Conditions - People with overweight (%)
Medical Conditions - Elderly people having difficulties in thinking or remembering (%)
Medical Conditions - People who ever received blood transfusion (%)
Medical Conditions - People having trouble seeing even with glass/contacts (%)
Medical Conditions - People with arthritis (%)
Medical Conditions - People with gout (%)
Medical Conditions - People with congestive heart failure (%)
Medical Conditions - People with coronary heart disease (%)
Medical Conditions - People with angina pectoris (%)
Medical Conditions - People who ever had heart attack (%)
Medical Conditions - People who ever had stroke (%)
Medical Conditions - People with emphysema (%)
Medical Conditions - People with thyroid problem (%)
Medical Conditions - People with chronic bronchitis (%)
Medical Conditions - People with any liver condition (%)
Medical Conditions - People who ever had cancer or malignancy (%)
Mental Health - People who have little interest in doing things (%)
Mental Health - People feeling down, depressed, or hopeless (%)
Mental Health - People who have trouble sleeping or sleeping too much (%)
Mental Health - People feeling tired or having little energy (%)
Mental Health - People with poor appetite or overeating (%)
Mental Health - People feeling bad about themself (%)
Mental Health - People who have trouble concentrating on things (%)
Mental Health - People moving or speaking slowly or too fast (%)
Mental Health - People having thoughts they would be better off dead (%)
Oral Health - Average years since last visit a dentist
Oral Health - People embarrassed because of mouth (%)
Oral Health - People with gum disease (%)
Oral Health - General health of teeth and gums (%)
Oral Health - Average days a week using dental floss/device
Oral Health - Average days a week using mouthwash for dental problem
Oral Health - Average number of teeth
Pesticide Use - Households using pesticides to control insects (%)
Pesticide Use - Households using pesticides to kill weeds (%)
Physical Activity - People doing vigorous-intensity work activities (%)
Physical Activity - People doing moderate-intensity work activities (%)
Physical Activity - People walking or bicycling (%)
Physical Activity - People doing vigorous-intensity recreational activities (%)
Physical Activity - People doing moderate-intensity recreational activities (%)
Physical Activity - Average hours a day doing sedentary activities
Physical Activity - Average hours a day watching TV or videos
Physical Activity - Average hours a day using computer
Physical Functioning - People having limitations keeping them from working (%)
Physical Functioning - People limited in amount of work they can do (%)
Physical Functioning - People that need special equipment to walk (%)
Physical Functioning - People experiencing confusion/memory problems (%)
Physical Functioning - People requiring special healthcare equipment (%)
Prescription Medications - Average number of prescription medicines taking
Preventive Aspirin Use - Adults 40+ taking low-dose aspirin (%)
Reproductive Health - Vaginal deliveries (%)
Reproductive Health - Cesarean deliveries (%)
Reproductive Health - Deliveries resulted in a live birth (%)
Reproductive Health - Pregnancies resulted in a delivery (%)
Reproductive Health - Women breastfeeding newborns (%)
Reproductive Health - Women that had a hysterectomy (%)
Reproductive Health - Women that had both ovaries removed (%)
Reproductive Health - Women that have ever taken birth control pills (%)
Reproductive Health - Women taking birth control pills (%)
Reproductive Health - Women that have ever used Depo-Provera or injectables (%)
Reproductive Health - Women that have ever used female hormones (%)
Sexual Behavior - People 18+ that ever had sex (vaginal, anal, or oral) (%)
Sexual Behavior - Males 18+ that ever had vaginal sex with a woman (%)
Sexual Behavior - Males 18+ that ever performed oral sex on a woman (%)
Sexual Behavior - Males 18+ that ever had anal sex with a woman (%)
Sexual Behavior - Males 18+ that ever had any sex with a man (%)
Sexual Behavior - Females 18+ that ever had vaginal sex with a man (%)
Sexual Behavior - Females 18+ that ever performed oral sex on a man (%)
Sexual Behavior - Females 18+ that ever had anal sex with a man (%)
Sexual Behavior - Females 18+ that ever had any kind of sex with a woman (%)
Sexual Behavior - Average age people first had sex
Sexual Behavior - Average number of female sex partners in lifetime (males 18+)
Sexual Behavior - Average number of female vaginal sex partners in lifetime (males 18+)
Sexual Behavior - Average age people first performed oral sex on a woman (18+)
Sexual Behavior - Average number of woman performed oral sex on in lifetime (18+)
Sexual Behavior - Average number of male sex partners in lifetime (males 18+)
Sexual Behavior - Average number of male anal sex partners in lifetime (males 18+)
Sexual Behavior - Average age people first performed oral sex on a man (18+)
Sexual Behavior - Average number of male oral sex partners in lifetime (18+)
Sexual Behavior - People using protection when performing oral sex (%)
Sexual Behavior - Average number of times people have vaginal or anal sex a year
Sexual Behavior - People having sex without condom (%)
Sexual Behavior - Average number of male sex partners in lifetime (females 18+)
Sexual Behavior - Average number of male vaginal sex partners in lifetime (females 18+)
Sexual Behavior - Average number of female sex partners in lifetime (females 18+)
Sexual Behavior - Circumcised males 18+ (%)
Sleep Disorders - Average hours sleeping at night
Sleep Disorders - People that has trouble sleeping (%)
Smoking-Cigarette Use - People smoking cigarettes (%)
Taste & Smell - People 40+ having problems with smell (%)
Taste & Smell - People 40+ having problems with taste (%)
Taste & Smell - People 40+ that ever had wisdom teeth removed (%)
Taste & Smell - People 40+ that ever had tonsils teeth removed (%)
Taste & Smell - People 40+ that ever had a loss of consciousness because of a head injury (%)
Taste & Smell - People 40+ that ever had a broken nose or other serious injury to face or skull (%)
Taste & Smell - People 40+ that ever had two or more sinus infections (%)
Weight - Average height (inches)
Weight - Average weight (pounds)
Weight - Average BMI
Weight - People that are obese (%)
Weight - People that ever were obese (%)
Weight - People trying to lose weight (%)
Urban population: 9,878
Rural population: 1,317
Estimated median house/condo value in 2022: $305,635
49127:
$305,635Michigan:
$224,400
According to our research of Michigan and other state lists, there were 24 registered sex offenders living in 49127 zip code as of April 17, 2024 . The ratio of all residents to sex offenders in zip code 49127 is 469 to 1.The ratio of registered sex offenders to all residents in this zip code is lower than the state average.
Median resident age: This zip code:
43.4 yearsMichigan median age:
40.3 years
Average household size: This zip code:
2.5 peopleMichigan:
2.4 people
Averages for the 2020 tax year for zip code 49127, filed in 2021:
Average Adjusted Gross Income (AGI) in 2020: $93,509 (Individual Income Tax Returns) Here:
$93,509State:
$68,945
Salary/wage: $79,174 (reported on 77.0% of returns )Here:
$79,174State:
$57,142
(% of AGI for various income ranges: 955.3% for AGIs below $25k , 3180.7% for AGIs $25k-50k , 5355.5% for AGIs $50k-75k , 8907.2% for AGIs $75k-100k , 16166.0% for AGIs $100k-200k , 91167.9% for AGIs over 200k ) Taxable interest for individuals: $1,455 (reported on 40.3% of returns )This zip code:
$1,455Michigan:
$1,630
(% of AGI for various income ranges: 29.7% for AGIs below $25k , 31.2% for AGIs $25k-50k , 67.1% for AGIs $50k-75k , 55.6% for AGIs $75k-100k , 125.7% for AGIs $100k-200k , 872.1% for AGIs over 200k ) Ordinary dividends: $7,815 (reported on 28.3% of returns )(% of AGI for various income ranges: 43.2% for AGIs below $25k , 56.5% for AGIs $25k-50k , 143.9% for AGIs $50k-75k , 111.6% for AGIs $75k-100k , 519.4% for AGIs $100k-200k , 4577.9% for AGIs over 200k ) Net capital gain/loss in AGI: +$16,524 (reported on 25.3% of returns )Here:
+$16,524State:
+$20,064
(% of AGI for various income ranges: 30.6% for AGIs below $25k , 76.8% for AGIs $25k-50k , 167.8% for AGIs $50k-75k , 276.2% for AGIs $75k-100k , 603.2% for AGIs $100k-200k , 11198.6% for AGIs over 200k ) Profit/loss from business: +$17,029 (reported on 14.4% of returns )Here:
+$17,029State:
+$11,172
(% of AGI for various income ranges: 99.0% for AGIs below $25k , 167.2% for AGIs $25k-50k , 214.3% for AGIs $50k-75k , 264.4% for AGIs $75k-100k , 609.5% for AGIs $100k-200k , 3407.1% for AGIs over 200k ) Taxable individual retirement arrangement distribution: $23,362 (reported on 16.3% of returns )49127:
$23,362Michigan:
$19,803
(% of AGI for various income ranges: 128.0% for AGIs below $25k , 275.2% for AGIs $25k-50k , 501.0% for AGIs $50k-75k , 655.3% for AGIs $75k-100k , 1239.8% for AGIs $100k-200k , 2826.4% for AGIs over 200k ) Self-employed (Keogh) retirement plans: $24,625 (reported on 0.7% of returns )49127:
$24,625Michigan:
$25,132
(% of AGI for various income ranges: 703.6% for AGIs over 200k ) Total itemized deductions: $36,640 (reported on 7.5% of returns )Here:
$36,640State:
$34,117
(% of AGI for various income ranges: 70.5% for AGIs below $25k , 116.9% for AGIs $25k-50k , 186.1% for AGIs $50k-75k , 165.0% for AGIs $75k-100k , 718.0% for AGIs $100k-200k , 4851.4% for AGIs over 200k ) Charity contributions: $16,703 (reported on 6.4% of returns )Here:
$16,703State:
$13,548
(% of AGI for various income ranges: 33.5% for AGIs $25k-50k , 58.6% for AGIs $50k-75k , 246.0% for AGIs $100k-200k , 2497.1% for AGIs over 200k ) Taxes paid: $8,068 (reported on 7.5% of returns )(% of AGI for various income ranges: 11.1% for AGIs below $25k , 21.9% for AGIs $25k-50k , 42.0% for AGIs $50k-75k , 49.1% for AGIs $75k-100k , 192.9% for AGIs $100k-200k , 930.0% for AGIs over 200k ) Earned income credit: $1,921 (reported on 8.8% of returns )(% of AGI for various income ranges: 45.6% for AGIs below $25k , 50.9% for AGIs $25k-50k ) Percentage of individuals using paid preparers for their 2020 taxes: 92.9%(% for various income ranges: 90.0% for AGIs below $25k , 94.5% for AGIs $25k-50k , 94.3% for AGIs $50k-75k , 93.5% for AGIs $75k-100k , 93.5% for AGIs $100k-200k , 95.2% for AGIs over 200k )
Averages for the 2012 tax year for zip code 49127, filed in 2013:
Average Adjusted Gross Income (AGI) in 2012: $71,289 (Individual Income Tax Returns) Here:
$71,289State:
$55,609
Salary/wage: $63,785 (reported on 80.3% of returns )Here:
$63,785State:
$46,782
(% of AGI for various income ranges: 65.6% for AGIs below $25k , 72.0% for AGIs $25k-50k , 70.4% for AGIs $50k-75k , 75.8% for AGIs $75k-100k , 77.8% for AGIs $100k-200k , 66.8% for AGIs over 200k ) Taxable interest for individuals: $1,342 (reported on 44.9% of returns )This zip code:
$1,342Michigan:
$1,491
(% of AGI for various income ranges: 2.5% for AGIs below $25k , 1.2% for AGIs $25k-50k , 0.7% for AGIs $50k-75k , 0.8% for AGIs $75k-100k , 0.7% for AGIs $100k-200k , 0.7% for AGIs over 200k ) Ordinary dividends: $7,142 (reported on 27.0% of returns )(% of AGI for various income ranges: 2.4% for AGIs below $25k , 1.5% for AGIs $25k-50k , 1.8% for AGIs $50k-75k , 1.4% for AGIs $75k-100k , 1.6% for AGIs $100k-200k , 5.0% for AGIs over 200k ) Net capital gain/loss in AGI: +$8,110 (reported on 21.5% of returns )Here:
+$8,110State:
+$9,326
(% of AGI for various income ranges: 0.4% for AGIs $50k-75k , 1.0% for AGIs $75k-100k , 1.5% for AGIs $100k-200k , 6.0% for AGIs over 200k ) Profit/loss from business: +$17,363 (reported on 14.0% of returns )Here:
+$17,363State:
+$11,523
(% of AGI for various income ranges: 5.6% for AGIs below $25k , 3.0% for AGIs $25k-50k , 3.5% for AGIs $50k-75k , 2.4% for AGIs $75k-100k , 2.5% for AGIs $100k-200k , 4.4% for AGIs over 200k ) Taxable individual retirement arrangement distribution: $19,352 (reported on 16.7% of returns )49127:
$19,352Michigan:
$15,298
(% of AGI for various income ranges: 6.9% for AGIs below $25k , 6.4% for AGIs $25k-50k , 5.5% for AGIs $50k-75k , 5.4% for AGIs $75k-100k , 5.0% for AGIs $100k-200k , 2.4% for AGIs over 200k ) Self-employment retirement plans: $20,667 (reported on 0.6% of returns )49127:
$20,667Michigan:
$20,834
Total itemized deductions: $23,606 (17% of AGI, reported on 35.2% of returns )Here:
$23,606State:
$21,628
Here:
16.7% of AGIState:
18.4% of AGI
(% of AGI for various income ranges: 9.4% for AGIs below $25k , 9.2% for AGIs $25k-50k , 10.5% for AGIs $50k-75k , 12.9% for AGIs $75k-100k , 14.1% for AGIs $100k-200k , 10.6% for AGIs over 200k ) Charity contributions: $4,958 (reported on 30.3% of returns )(% of AGI for various income ranges: 1.0% for AGIs below $25k , 1.2% for AGIs $25k-50k , 1.7% for AGIs $50k-75k , 2.1% for AGIs $75k-100k , 2.5% for AGIs $100k-200k , 2.4% for AGIs over 200k ) Taxes paid: $9,407 (reported on 35.2% of returns )(% of AGI for various income ranges: 1.8% for AGIs below $25k , 2.2% for AGIs $25k-50k , 3.2% for AGIs $50k-75k , 4.4% for AGIs $75k-100k , 5.7% for AGIs $100k-200k , 5.6% for AGIs over 200k ) Earned income credit: $1,951 (reported on 12.2% of returns )(% of AGI for various income ranges: 4.6% for AGIs below $25k , 0.8% for AGIs $25k-50k ) Percentage of individuals using paid preparers for their 2012 taxes: 48.5%(% for various income ranges: 41.2% for AGIs below $25k , 48.0% for AGIs $25k-50k , 52.1% for AGIs $50k-75k , 55.7% for AGIs $75k-100k , 50.6% for AGIs $100k-200k , 75.0% for AGIs over 200k )
Averages for the 2004 tax year for zip code 49127, filed in 2005:
Average Adjusted Gross Income (AGI) in 2004: $57,360 (Individual Income Tax Returns) Here:
$57,360State:
$48,204
Salary/wage: $50,473 (reported on 83.1% of returns )Here:
$50,473State:
$42,791
(% of AGI for various income ranges: 97.9% for AGIs below $10k , 67.8% for AGIs $10k-25k , 76.7% for AGIs $25k-50k , 79.6% for AGIs $50k-75k , 82.5% for AGIs $75k-100k , 66.7% for AGIs over 100k ) Taxable interest for individuals: $1,592 (reported on 55.3% of returns )This zip code:
$1,592Michigan:
$1,725
(% of AGI for various income ranges: 6.1% for AGIs below $10k , 4.0% for AGIs $10k-25k , 1.8% for AGIs $25k-50k , 1.5% for AGIs $50k-75k , 1.1% for AGIs $75k-100k , 1.2% for AGIs over 100k ) Taxable dividends: $3,090 (reported on 31.7% of returns )(% of AGI for various income ranges: 5.7% for AGIs below $10k , 2.2% for AGIs $10k-25k , 1.6% for AGIs $25k-50k , 1.2% for AGIs $50k-75k , 1.4% for AGIs $75k-100k , 1.9% for AGIs over 100k ) Net capital gain/loss: +$9,504 (reported on 24.8% of returns )Here:
+$9,504State:
+$8,532
(% of AGI for various income ranges: -3.1% for AGIs below $10k , 0.6% for AGIs $10k-25k , 0.5% for AGIs $25k-50k , 1.0% for AGIs $50k-75k , 1.1% for AGIs $75k-100k , 7.8% for AGIs over 100k ) Profit/loss from business: +$18,150 (reported on 14.1% of returns )Here:
+$18,150State:
+$9,547
(% of AGI for various income ranges: 3.6% for AGIs below $10k , 5.0% for AGIs $10k-25k , 3.2% for AGIs $25k-50k , 2.5% for AGIs $50k-75k , 2.4% for AGIs $75k-100k , 6.1% for AGIs over 100k ) IRA payment deduction: $3,189 (reported on 3.0% of returns )49127:
$3,189Michigan:
$2,875
(% of AGI for various income ranges: 0.3% for AGIs $10k-25k , 0.3% for AGIs $25k-50k , 0.2% for AGIs $50k-75k , 0.2% for AGIs $75k-100k , 0.1% for AGIs over 100k ) Self-employed pension: $15,360 (reported on 1.0% of returns )Here:
$15,360Michigan:
$13,826
Total itemized deductions: $19,428 (18% of AGI, reported on 37.4% of returns )Here:
$19,428State:
$18,509
Here:
18.0% of AGIState:
20.7% of AGI
(% of AGI for various income ranges: 16.8% for AGIs below $10k , 8.8% for AGIs $10k-25k , 10.4% for AGIs $25k-50k , 12.6% for AGIs $50k-75k , 14.8% for AGIs $75k-100k , 12.9% for AGIs over 100k ) Charity contributions deductions: $4,302 (4% of AGI, reported on 33.8% of returns )Here:
3.8% of AGIState:
3.6% of AGI
(% of AGI for various income ranges: 1.0% for AGIs below $10k , 1.0% for AGIs $10k-25k , 1.4% for AGIs $25k-50k , 2.1% for AGIs $50k-75k , 2.6% for AGIs $75k-100k , 3.2% for AGIs over 100k ) Total tax: $10,000 (reported on 77.5% of returns )49127:
$10,000State:
$7,691
(% of AGI for various income ranges: 2.3% for AGIs below $10k , 4.5% for AGIs $10k-25k , 7.2% for AGIs $25k-50k , 8.9% for AGIs $50k-75k , 10.0% for AGIs $75k-100k , 19.4% for AGIs over 100k ) Earned income credit: $1,524 (reported on 8.9% of returns )Percentage of individuals using paid preparers for their 2004 taxes: 51.5%(% for various income ranges: 45.7% for AGIs below $10k , 51.0% for AGIs $10k-25k , 52.0% for AGIs $25k-50k , 54.6% for AGIs $50k-75k , 49.4% for AGIs $75k-100k , 58.8% for AGIs over 100k )
Estimated median household income in 2022: This zip code:
$89,942Michigan:
$66,986
Nearest zip codes: 49085 ,
49101 ,
49106 ,
49125 ,
49119 ,
49126 .
Percentage of family households: This zip code:
48.6%Michigan:
43.3%
Percentage of households with unmarried partners: This zip code:
4.8%Michigan:
45.7%
No gay or lesbian households reported
Household received Food Stamps/SNAP in the past 12 months: 177Household did not receive Food Stamps/SNAP in the past 12 months: 4,335
Women who had a birth in the past 12 months: 97 (66 now married , 30 unmarried) Women who did not have a birth in the past 12 months: 1,999 (998 now married , 996 unmarried)
Housing units in zip code 49127 with a mortgage: 2,109 (205
second mortgage , 2
home equity loan , 199
both second mortgage and home equity loan )
Houses without a mortgage: 87
Median monthly owner costs for units with a mortgage: $1,709
Median monthly owner costs for units without a mortgage: $594
Residents with income below the poverty level in 2022:
This zip code:
7.3%Whole state:
13.4%
Residents with income below 50% of the poverty level in 2022:
This zip code:
4.5%Whole state:
6.9%
Median number of rooms in houses and condos: Median number of rooms in apartments: Notable locations in this zip code not listed on our city pages
Click to draw/clear zip code borders Notable locations in zip code 49127: (A) , Stevensville Station (B) , Lincoln Township Hall (C) , Lincoln Township Public Library (D) , Lincoln Township Police Department (E) , Lincoln Charter Township Fire Department (F) . Display/hide their locations on the map
Churches in zip code 49127 include: (A) , Stevensville Seventh-Day Adventist Church (B) , Kingdom Hall of Jehovah's Witnesses (C) , Saint Joseph Catholic Church (D) , Berrien County Baptist Church (E) , Saint Paul's Lutheran Church (F) , Stevensville United Methodist Church (G) , Lakeside Family Church (H) , Saint Luke Church (I) . Display/hide their locations on the map
Cemetery: (1) . Display/hide its location on the map
Lake: (A) . Display/hide its location on the map
Creek: (A) . Display/hide its location on the map
Parks in zip code 49127 include: (1) , Grand Mere State Park (2) , Rudnick Park (3) , Center Park (4) , Lion Park (5) , North Lake Park (6) . Display/hide their locations on the map
Year house built (houses)
0 2020 or later259 2010 to 2019698 2000 to 2009621 1990 to 1999575 1980 to 19891,066 1970 to 1979907 1960 to 1969333 1950 to 1959173 1940 to 1949459 1939 or earlier
Zip code 49127 household income distribution in 2022 147 Less than $10,00048 $10,000 to $14,999117 $15,000 to $19,999150 $20,000 to $24,999126 $25,000 to $29,999221 $30,000 to $34,999161 $35,000 to $39,999192 $40,000 to $44,999109 $45,000 to $49,999320 $50,000 to $59,999294 $60,000 to $74,999708 $75,000 to $99,999629 $100,000 to $124,999281 $125,000 to $149,999457 $150,000 to $199,999563 $200,000 or moreEstimate of home value of owner-occupied houses/condos in 2022 in zip code 49127 67 Less than $10,00049 $10,000 to $14,99912 $15,000 to $19,9991 $20,000 to $24,9995 $25,000 to $29,99954 $30,000 to $34,9999 $40,000 to $49,9993 $50,000 to $59,9998 $60,000 to $69,99912 $70,000 to $79,99920 $80,000 to $89,9994 $90,000 to $99,99968 $100,000 to $124,99979 $125,000 to $149,999163 $150,000 to $174,999197 $175,000 to $199,999659 $200,000 to $249,999565 $250,000 to $299,999507 $300,000 to $399,999538 $400,000 to $499,999434 $500,000 to $749,999215 $750,000 to $999,999107 $1,000,000 to $1,499,99911 $2,000,000 or moreRent paid by renters in 2022 in zip code 49127 20 $350 to $3992 $450 to $49949 $500 to $54941 $550 to $59921 $600 to $64945 $650 to $69947 $700 to $74976 $750 to $799242 $800 to $899188 $900 to $999143 $1,000 to $1,24919 $1,250 to $1,4997 $1,500 to $1,9994 $2,000 to $2,49938 No cash rent
Median gross rent in 2022: $1,059.
Median price asked for vacant for-sale houses and condos in 2022: $153,369.
Estimated median house (or condo) value in 2022 for: White Non-Hispanic householders: $330,543Black or African American householders: $330,543American Indian or Alaska Native householders: $234,643Asian householders: $442,136Two or more races householders: $271,260Hispanic or Latino householders: $1,401,137Estimated median house or condo value in 2022: $305,635
49127:
$305,635Michigan:
$224,400
Lower value quartile - upper value quartile: $224,459 - $491,791
Mean price in 2022: Detached houses: $398,412Here:
$398,412State:
$280,038
Townhouses or other attached units: $430,634Here:
$430,634State:
$239,520
In 2-unit structures: $924,140Here:
$924,140State:
$219,481
Mobile homes: $38,899Here:
$38,899State:
$72,868
Housing units in structures:
One, detached: 3,943One, attached: 195Two: 2763 or 4: 1365 to 9: 10510 to 19: 10120 to 49: 3350 or more: 21Mobile homes: 297Unemployment : 4.3%
Means of transportation to work in zip code 49127 75.7% 4,150 Drove a car alone7.3% 402 Carpooled0.0% 2 Bus or trolley bus1.0% 53 Walked0.7% 39 Other means15.9% 872 Worked at homeTravel time to work (commute) in zip code 49127 158 Less than 5 minutes502 5 to 9 minutes1,347 10 to 14 minutes1,208 15 to 19 minutes543 20 to 24 minutes227 25 to 29 minutes236 30 to 34 minutes107 35 to 39 minutes9 40 to 44 minutes142 45 to 59 minutes84 60 to 89 minutes76 90 or more minutes
Percentage of zip code residents living and working in this county: 96.8%
Household type by relationship:
Households: 11,196
Male householders: 2,219 (548 living alone ), Female householders: 2,328 (570 living alone )2,462 spouses (2,373 opposite-sex spouses ), 308 unmarried partners , (297 opposite-sex unmarried partners ), 3,150 children (3,047 natural , 21 adopted , 84 stepchildren ), 229 grandchildren , 83 brothers or sisters , 27 parents , 0 foster children , 38 other relatives , 345 non-relatives In group quarters: 34 (-1 institutionalized population )
Size of family households: 1,596 2-persons , 564 3-persons , 609 4-persons , 194 5-persons , 37 6-persons , 29 7-or-more-persons
Size of nonfamily households: 1,117 1-person , 358 2-persons , 14 3-persons , 18 6-persons
1,561 married couples with children. single-parent households (94 men , 404 women ).
95.4% of residents of 49127 zip code speak English at home. of residents speak Spanish at home (78% very well, 22% well ).of residents speak other Indo-European language at home (57% very well, 43% well ).of residents speak Asian or Pacific Island language at home (59% very well, 41% well ).of residents speak other language at home (100% very well ).
Foreign born population: 690 (6.2%)
(29.8%
of them are naturalized citizens )
This zip code:
6.2%Whole state:
6.9%
17% Uruguay 13% Honduras 11% Malaysia 11% Bolivia 8% Australia 6% Sweden 5% France 29% German 12% English 10% Irish 7% Italian 6% Polish 5% American 2% Dutch
Year of entry for the foreign-born population
490 2010 or later 94 2000 to 2009 53 1990 to 1999 170 Before 1990
Facilities with environmental interests located in this zip code:
MI DEPT/TRANSPORTATION BRIDGE S16-11015 (I-94 OVER PUETZ RD in STEVENSVILLE, MI)
(Resource Conservation and Recovery Act (tracking hazardous waste)) Organizations: MICH DEPT OF TRANSPORTATION (CONTACT/OPERATOR)
Alternative names: MIDOT BRIDGE I-94 OVER PUETZ RD
GAUGE GAL CO (2953 HINCHMAN RD in STEVENSVILLE, MI)
(Resource Conservation and Recovery Act (tracking hazardous waste)) Organizations: LYCAN G A (CONTACT/OWNER)
ALPHA RESOURCES, INC. (3090 JOHNSON RD. in STEVENSVILLE, MI)
AIR MINOR (AIRS/AFS) Business SIC classification: INSTRUMENTS FOR MEASURING AND TESTING OF ELECTRICITY AND ELECTRICAL SIGNALS
MI DEPT/NATURAL RESOURCES (UNKNOWN in STEVENSVILLE, MI)
(Resource Conservation and Recovery Act (tracking hazardous waste)) Alternative names: MI DEPT/DNR
ACCU DIE AND MOLD INC (7473 RED ARROW HWY in STEVENSVILLE, MI)
Conditionally Exempt Small Quantity Generators, less than 100 kg/month of hazardous waste (Resource Conservation and Recovery Act (tracking hazardous waste)) - notification Organizations: DAN REIFSCHNEIDER (CONTACT/OWNER)
FEDERAL EXPRESS CORP (5000 ADVANCE WAY in STEVENSVILLE, MI)
Conditionally Exempt Small Quantity Generators, less than 100 kg/month of hazardous waste (Resource Conservation and Recovery Act (tracking hazardous waste)) - notification Organizations: KRAKLAU HENRY AND DOROTHY (CONTACT/OWNER)
FORMER DADAN CHEVROLET DEALERSHIP (5647 ST JOSEPH AVE in STEVENSVILLE, MI)
Small Quantity Generators, between 100 kg and 1000 kg of hazardous waste/month (Resource Conservation and Recovery Act (tracking hazardous waste)) Business NAICS classification: GENERAL AUTOMOTIVE REPAIR.
Housing units lacking complete plumbing facilities: 0.1%
Housing units lacking complete kitchen facilities: 1.3%
72.4% Utility gas 18.9% Electricity 4.1% Bottled, tank, or LP gas 2.2% Fuel oil, kerosene, etc. 1.1% Other fuel 0.8% No fuel used 0.6% Wood
Population in 1990: 9,354.
Place of birth for U.S.-born residents:
This state: 6,992Northeast: 333Midwest: 2,270South: 662West: 193
57% of the 49127 zip code residents lived in the same house 5 years ago.
Out of people who lived in different houses, 66% lived in this county.
Out of people who lived in different counties, 50% lived in Michigan.
89% of the 49127 zip code residents lived in the same house 1 year ago.
Out of people who lived in different houses, 28% moved from this county.
Out of people who lived in different houses, 37% moved from different county within same state.
Out of people who lived in different houses, 29% moved from different state.
Out of people who lived in different houses, 9% moved from abroad.
Private vs. public school enrollment:
Students in private schools in grades 1 to 8 (elementary and middle school): 266
Students in private schools in grades 9 to 12 (high school): 26
Students in private undergraduate colleges: 58
Occupation by median earnings in the past 12 months ($)
106,231 Architecture and engineering occupations 102,043 Legal occupations 95,231 Management occupations 86,009 Life, physical, and social science occupations 82,525 Health diagnosing and treating practitioners and other technical occupations 81,820 Business and financial operations occupations
Companies with federal contracts located in this zip code:
TRI-M-MOLD, INC (3390 W LINCO ROAD in STEVENSVILLE, MI; small business) in 2 contracts from 2001 to 2002
$70,350 with Army for Miscellaneous Aircraft Accessories and Components. Signed on 2002-10-23. Completion date: 2002-11-20.
, same as above. Signed on 2001-07-13. Completion date: 2001-08-31.
CONCEPT TO PROMOTION, INC (4335 RED ARROW HIGHWAY in STEVENSVILLE, MI; small business)
-$2 with Defense Logistics Agency for Other Professional Services. Signed on 2005-02-01. Completion date: 2005-02-01.
Top industries in this zip code by the number of employees in 2005:
Accommodation and Food Services: Full-Service Restaurants (50-99 employees: 2 establishments, 20-49 employees: 6 establishments, 10-19 employees: 1 establishment, 1-4 employees: 4 establishments)Accommodation and Food Services: Limited-Service Restaurants (50-99: 1, 20-49: 2, 10-19: 4, 5-9: 1)Health Care and Social Assistance: Home Health Care Services (100-249: 1, 10-19: 1, 5-9: 1)Administrative and Support and Waste Management and Remediation Services: Professional Employer Organizations (50-99: 1, 10-19: 1)Administrative and Support and Waste Management and Remediation Services: Solid Waste Collection (50-99: 1)
People in group quarters in 2010:
8 people in workers' group living quarters and job corps centers
People in group quarters in 2000:
19 people in other noninstitutional group quarters
16 people in agriculture workers' dormitories on farms
12 people in nursing homes
9 people in other group homes
6 people in unknown juvenile institutions
6 people in homes for the mentally ill
Fatal accident statistics in 2013:
Fatal accident count: 4Vehicles involved in fatal accidents: 4Fatal accidents caused by drunken drivers: 1Fatalities: 4Persons involved in fatal accidents: 4Pedestrians involved in fatal accidents: 0
Fatal accident statistics in 2011:
Fatal accident count: 3Vehicles involved in fatal accidents: 4Fatal accidents caused by drunken drivers: 1Fatalities: 3Persons involved in fatal accidents: 14Pedestrians involved in fatal accidents: 2
Home Mortgage Disclosure Act Aggregated Statistics For Year 2009(Based on 8 partial tracts) A) FHA, FSA/RHS & VA B) Conventional C) Refinancings D) Home Improvement Loans F) Non-occupant Loans on G) Loans On Manufactured Number Average Value Number Average Value Number Average Value Number Average Value Number Average Value Number Average Value
LOANS ORIGINATED 55 $162,662 130 $216,399 589 $185,783 91 $59,416 53 $253,424 1 $3,450 APPLICATIONS APPROVED, NOT ACCEPTED 1 $224,960 11 $222,548 39 $219,890 9 $11,409 4 $189,370 0 $0 APPLICATIONS DENIED 2 $186,960 16 $337,933 112 $209,198 16 $35,172 11 $570,648 1 $3,450 APPLICATIONS WITHDRAWN 0 $0 15 $190,701 73 $183,605 18 $75,690 4 $114,768 0 $0 FILES CLOSED FOR INCOMPLETENESS 2 $186,360 2 $90,705 13 $149,725 0 $0 0 $0 0 $0
Aggregated Statistics For Year 2008(Based on 8 partial tracts) A) FHA, FSA/RHS & VA B) Conventional C) Refinancings D) Home Improvement Loans E) Loans on Dwellings For 5+ Families F) Non-occupant Loans on G) Loans On Manufactured Number Average Value Number Average Value Number Average Value Number Average Value Number Average Value Number Average Value Number Average Value
LOANS ORIGINATED 43 $158,467 205 $188,518 276 $183,810 128 $55,028 1 $2,624,920 38 $194,774 4 $25,888 APPLICATIONS APPROVED, NOT ACCEPTED 3 $118,530 20 $189,569 23 $154,010 9 $69,444 0 $0 4 $189,092 2 $42,790 APPLICATIONS DENIED 5 $138,784 13 $159,691 115 $169,474 16 $20,156 1 $122,260 9 $150,480 7 $49,284 APPLICATIONS WITHDRAWN 9 $193,527 13 $120,509 78 $186,751 18 $59,301 0 $0 5 $129,750 0 $0 FILES CLOSED FOR INCOMPLETENESS 0 $0 0 $0 6 $146,490 0 $0 0 $0 0 $0 0 $0
Aggregated Statistics For Year 2007(Based on 8 partial tracts) A) FHA, FSA/RHS & VA B) Conventional C) Refinancings D) Home Improvement Loans E) Loans on Dwellings For 5+ Families F) Non-occupant Loans on G) Loans On Manufactured Number Average Value Number Average Value Number Average Value Number Average Value Number Average Value Number Average Value Number Average Value
LOANS ORIGINATED 18 $158,402 295 $207,828 331 $180,598 153 $67,766 3 $1,039,780 57 $281,654 4 $41,965 APPLICATIONS APPROVED, NOT ACCEPTED 1 $253,080 40 $163,941 59 $171,037 12 $49,944 0 $0 3 $187,000 4 $42,985 APPLICATIONS DENIED 4 $112,385 36 $118,148 148 $178,534 41 $62,482 0 $0 18 $301,758 9 $44,819 APPLICATIONS WITHDRAWN 3 $144,910 19 $181,311 88 $178,168 41 $53,242 0 $0 6 $271,092 2 $123,690 FILES CLOSED FOR INCOMPLETENESS 0 $0 6 $292,850 20 $232,260 1 $48,900 0 $0 0 $0 0 $0
Aggregated Statistics For Year 2006(Based on 8 partial tracts) A) FHA, FSA/RHS & VA B) Conventional C) Refinancings D) Home Improvement Loans F) Non-occupant Loans on G) Loans On Manufactured Number Average Value Number Average Value Number Average Value Number Average Value Number Average Value Number Average Value
LOANS ORIGINATED 11 $160,935 446 $176,266 384 $169,419 119 $56,200 73 $363,445 8 $26,421 APPLICATIONS APPROVED, NOT ACCEPTED 0 $0 42 $186,197 55 $152,623 11 $62,602 8 $345,058 9 $32,010 APPLICATIONS DENIED 1 $6,900 51 $137,852 162 $151,096 55 $42,954 12 $169,760 12 $25,602 APPLICATIONS WITHDRAWN 0 $0 38 $165,904 113 $181,864 31 $73,312 3 $288,197 0 $0 FILES CLOSED FOR INCOMPLETENESS 4 $136,152 7 $71,264 28 $149,955 2 $29,685 2 $16,120 0 $0
Aggregated Statistics For Year 2005(Based on 8 partial tracts) A) FHA, FSA/RHS & VA B) Conventional C) Refinancings D) Home Improvement Loans F) Non-occupant Loans on G) Loans On Manufactured Number Average Value Number Average Value Number Average Value Number Average Value Number Average Value Number Average Value
LOANS ORIGINATED 24 $158,088 387 $182,236 471 $163,671 136 $50,830 67 $253,841 8 $30,430 APPLICATIONS APPROVED, NOT ACCEPTED 0 $0 46 $184,464 69 $180,637 8 $28,480 7 $149,261 12 $27,903 APPLICATIONS DENIED 5 $134,956 33 $116,081 206 $166,811 37 $45,343 8 $234,160 14 $31,722 APPLICATIONS WITHDRAWN 0 $0 28 $237,354 167 $168,229 32 $83,189 9 $106,320 2 $19,960 FILES CLOSED FOR INCOMPLETENESS 4 $170,932 5 $157,922 23 $151,104 1 $13,800 0 $0 0 $0
Aggregated Statistics For Year 2004(Based on 8 partial tracts) A) FHA, FSA/RHS & VA B) Conventional C) Refinancings D) Home Improvement Loans E) Loans on Dwellings For 5+ Families F) Non-occupant Loans on G) Loans On Manufactured Number Average Value Number Average Value Number Average Value Number Average Value Number Average Value Number Average Value Number Average Value
LOANS ORIGINATED 6 $129,702 398 $162,335 474 $137,408 192 $41,445 3 $769,063 78 $132,084 12 $31,358 APPLICATIONS APPROVED, NOT ACCEPTED 0 $0 38 $222,934 76 $150,250 14 $37,502 0 $0 6 $248,757 7 $32,963 APPLICATIONS DENIED 2 $133,585 49 $112,674 197 $144,265 50 $21,902 0 $0 12 $102,851 18 $35,024 APPLICATIONS WITHDRAWN 0 $0 13 $146,911 111 $128,006 20 $32,373 0 $0 7 $169,656 0 $0 FILES CLOSED FOR INCOMPLETENESS 2 $128,640 5 $167,632 27 $133,882 0 $0 0 $0 0 $0 0 $0
Aggregated Statistics For Year 2003(Based on 8 partial tracts) A) FHA, FSA/RHS & VA B) Conventional C) Refinancings D) Home Improvement Loans F) Non-occupant Loans on Number Average Value Number Average Value Number Average Value Number Average Value Number Average Value
LOANS ORIGINATED 10 $140,644 324 $168,129 1,320 $142,417 145 $39,828 91 $203,631 APPLICATIONS APPROVED, NOT ACCEPTED 1 $168,720 27 $150,422 114 $154,976 9 $27,948 12 $142,059 APPLICATIONS DENIED 3 $83,403 41 $80,797 190 $123,149 30 $24,807 11 $90,416 APPLICATIONS WITHDRAWN 1 $126,540 23 $168,017 141 $149,457 12 $30,797 16 $122,613 FILES CLOSED FOR INCOMPLETENESS 0 $0 5 $160,878 31 $118,251 0 $0 3 $70,437
Aggregated Statistics For Year 2002(Based on 8 partial tracts) A) FHA, FSA/RHS & VA B) Conventional C) Refinancings D) Home Improvement Loans E) Loans on Dwellings For 5+ Families F) Non-occupant Loans on Number Average Value Number Average Value Number Average Value Number Average Value Number Average Value Number Average Value
LOANS ORIGINATED 21 $113,899 310 $157,226 1,017 $143,303 206 $42,107 3 $520,377 62 $143,269 APPLICATIONS APPROVED, NOT ACCEPTED 0 $0 10 $101,906 96 $125,271 13 $23,919 0 $0 5 $93,020 APPLICATIONS DENIED 4 $119,965 38 $75,293 148 $121,557 39 $14,423 0 $0 10 $211,348 APPLICATIONS WITHDRAWN 1 $186,360 10 $126,026 112 $132,840 15 $25,039 0 $0 5 $153,782 FILES CLOSED FOR INCOMPLETENESS 0 $0 8 $122,434 25 $133,222 0 $0 0 $0 1 $162,610
Aggregated Statistics For Year 2001(Based on 8 partial tracts) A) FHA, FSA/RHS & VA B) Conventional C) Refinancings D) Home Improvement Loans E) Loans on Dwellings For 5+ Families F) Non-occupant Loans on Number Average Value Number Average Value Number Average Value Number Average Value Number Average Value Number Average Value
LOANS ORIGINATED 19 $105,669 314 $148,812 727 $125,226 202 $31,888 0 $0 65 $140,079 APPLICATIONS APPROVED, NOT ACCEPTED 1 $207,070 27 $95,754 73 $97,903 10 $16,755 2 $107,200 5 $101,146 APPLICATIONS DENIED 2 $45,355 39 $37,524 134 $98,891 39 $18,781 0 $0 9 $116,701 APPLICATIONS WITHDRAWN 2 $41,230 12 $127,167 77 $98,429 8 $52,884 0 $0 6 $76,078 FILES CLOSED FOR INCOMPLETENESS 0 $0 2 $34,635 27 $89,838 2 $145,130 0 $0 1 $94,330
Aggregated Statistics For Year 2000(Based on 8 partial tracts) A) FHA, FSA/RHS & VA B) Conventional C) Refinancings D) Home Improvement Loans E) Loans on Dwellings For 5+ Families F) Non-occupant Loans on Number Average Value Number Average Value Number Average Value Number Average Value Number Average Value Number Average Value
LOANS ORIGINATED 26 $114,154 275 $148,363 234 $112,756 158 $27,984 2 $93,660 45 $128,429 APPLICATIONS APPROVED, NOT ACCEPTED 1 $127,150 32 $120,727 41 $75,096 19 $19,662 0 $0 7 $99,213 APPLICATIONS DENIED 1 $140,600 74 $54,013 126 $104,176 30 $24,330 0 $0 3 $57,150 APPLICATIONS WITHDRAWN 1 $78,230 13 $155,834 69 $87,206 13 $50,088 0 $0 6 $106,687 FILES CLOSED FOR INCOMPLETENESS 0 $0 4 $120,090 12 $114,644 2 $69,095 0 $0 1 $99,030
Aggregated Statistics For Year 1999(Based on 4 partial tracts) A) FHA, FSA/RHS & VA B) Conventional C) Refinancings D) Home Improvement Loans F) Non-occupant Loans on Number Average Value Number Average Value Number Average Value Number Average Value Number Average Value
LOANS ORIGINATED 9 $112,686 196 $123,473 198 $121,962 69 $20,489 19 $181,567 APPLICATIONS APPROVED, NOT ACCEPTED 1 $59,730 19 $77,312 30 $93,834 9 $13,407 4 $110,238 APPLICATIONS DENIED 1 $92,030 32 $43,079 61 $101,720 25 $10,311 2 $156,860 APPLICATIONS WITHDRAWN 0 $0 18 $139,827 45 $98,889 7 $22,144 3 $358,750 FILES CLOSED FOR INCOMPLETENESS 0 $0 4 $90,105 10 $200,826 0 $0 1 $87,430
Detailed HMDA statistics for the following Tracts:
0014.00
,
0015.00 ,
0016.00 ,
0017.00
Private Mortgage Insurance Companies Aggregated Statistics For Year 2009(Based on 8 partial tracts) A) Conventional B) Refinancings C) Non-occupant Loans on Number Average Value Number Average Value Number Average Value
LOANS ORIGINATED 23 $219,356 14 $215,527 2 $266,345 APPLICATIONS APPROVED, NOT ACCEPTED 6 $228,038 1 $255,390 0 $0 APPLICATIONS DENIED 5 $218,858 6 $214,850 0 $0 APPLICATIONS WITHDRAWN 2 $165,825 1 $195,620 0 $0 FILES CLOSED FOR INCOMPLETENESS 2 $181,555 0 $0 1 $160,160
Aggregated Statistics For Year 2008(Based on 8 partial tracts) A) Conventional B) Refinancings C) Non-occupant Loans on Number Average Value Number Average Value Number Average Value
LOANS ORIGINATED 67 $191,981 20 $222,454 6 $188,603 APPLICATIONS APPROVED, NOT ACCEPTED 7 $215,323 4 $179,002 0 $0 APPLICATIONS DENIED 3 $74,763 3 $901,563 0 $0 APPLICATIONS WITHDRAWN 2 $659,680 2 $217,515 0 $0 FILES CLOSED FOR INCOMPLETENESS 3 $184,010 0 $0 0 $0
Aggregated Statistics For Year 2007(Based on 8 partial tracts) A) Conventional B) Refinancings C) Non-occupant Loans on Number Average Value Number Average Value Number Average Value
LOANS ORIGINATED 71 $186,161 26 $159,169 6 $162,167 APPLICATIONS APPROVED, NOT ACCEPTED 13 $188,333 10 $148,101 2 $168,110 APPLICATIONS DENIED 0 $0 0 $0 0 $0 APPLICATIONS WITHDRAWN 0 $0 2 $107,480 0 $0 FILES CLOSED FOR INCOMPLETENESS 0 $0 0 $0 0 $0
Aggregated Statistics For Year 2006(Based on 8 partial tracts) A) Conventional B) Refinancings C) Non-occupant Loans on Number Average Value Number Average Value Number Average Value
LOANS ORIGINATED 52 $169,025 20 $173,225 5 $87,426 APPLICATIONS APPROVED, NOT ACCEPTED 9 $190,982 0 $0 2 $109,015 APPLICATIONS DENIED 1 $113,890 0 $0 0 $0 APPLICATIONS WITHDRAWN 2 $237,220 0 $0 0 $0 FILES CLOSED FOR INCOMPLETENESS 3 $411,487 0 $0 0 $0
Aggregated Statistics For Year 2005(Based on 8 partial tracts) A) Conventional B) Refinancings C) Non-occupant Loans on Number Average Value Number Average Value Number Average Value
LOANS ORIGINATED 50 $177,804 13 $145,816 5 $196,118 APPLICATIONS APPROVED, NOT ACCEPTED 12 $248,837 2 $110,550 2 $110,550 APPLICATIONS DENIED 0 $0 0 $0 0 $0 APPLICATIONS WITHDRAWN 3 $279,130 0 $0 0 $0 FILES CLOSED FOR INCOMPLETENESS 0 $0 0 $0 0 $0
Aggregated Statistics For Year 2004(Based on 8 partial tracts) A) Conventional B) Refinancings C) Non-occupant Loans on Number Average Value Number Average Value Number Average Value
LOANS ORIGINATED 49 $170,760 19 $174,486 4 $162,890 APPLICATIONS APPROVED, NOT ACCEPTED 7 $216,150 3 $164,277 0 $0 APPLICATIONS DENIED 0 $0 0 $0 0 $0 APPLICATIONS WITHDRAWN 7 $232,929 2 $97,305 0 $0 FILES CLOSED FOR INCOMPLETENESS 0 $0 0 $0 0 $0
Aggregated Statistics For Year 2003(Based on 8 partial tracts) A) Conventional B) Refinancings C) Non-occupant Loans on Number Average Value Number Average Value Number Average Value
LOANS ORIGINATED 89 $141,686 92 $150,456 16 $106,646 APPLICATIONS APPROVED, NOT ACCEPTED 11 $167,338 20 $133,238 1 $98,930 APPLICATIONS DENIED 1 $171,160 0 $0 1 $171,160 APPLICATIONS WITHDRAWN 3 $143,303 4 $166,345 0 $0 FILES CLOSED FOR INCOMPLETENESS 0 $0 1 $229,850 0 $0
Aggregated Statistics For Year 2002(Based on 8 partial tracts) A) Conventional B) Refinancings C) Non-occupant Loans on Number Average Value Number Average Value Number Average Value
LOANS ORIGINATED 93 $139,374 70 $137,155 5 $130,566 APPLICATIONS APPROVED, NOT ACCEPTED 5 $127,312 10 $143,981 1 $140,350 APPLICATIONS DENIED 1 $128,370 1 $265,740 0 $0 APPLICATIONS WITHDRAWN 3 $111,807 1 $113,890 0 $0 FILES CLOSED FOR INCOMPLETENESS 0 $0 0 $0 0 $0
Aggregated Statistics For Year 2001(Based on 8 partial tracts) A) Conventional B) Refinancings C) Non-occupant Loans on Number Average Value Number Average Value Number Average Value
LOANS ORIGINATED 99 $137,230 49 $136,151 6 $122,798 APPLICATIONS APPROVED, NOT ACCEPTED 11 $156,958 8 $203,930 0 $0 APPLICATIONS DENIED 1 $212,730 5 $85,562 0 $0 APPLICATIONS WITHDRAWN 2 $182,255 0 $0 0 $0 FILES CLOSED FOR INCOMPLETENESS 0 $0 0 $0 0 $0
Aggregated Statistics For Year 2000(Based on 8 partial tracts) A) Conventional B) Refinancings C) Non-occupant Loans on Number Average Value Number Average Value Number Average Value
LOANS ORIGINATED 72 $129,558 13 $101,283 2 $76,690 APPLICATIONS APPROVED, NOT ACCEPTED 15 $111,068 3 $96,710 2 $103,075 APPLICATIONS DENIED 3 $139,213 0 $0 0 $0 APPLICATIONS WITHDRAWN 2 $83,680 1 $222,030 0 $0 FILES CLOSED FOR INCOMPLETENESS 0 $0 0 $0 0 $0
Aggregated Statistics For Year 1999(Based on 4 partial tracts) A) Conventional B) Refinancings C) Non-occupant Loans on Number Average Value Number Average Value Number Average Value
LOANS ORIGINATED 46 $129,796 10 $119,499 1 $85,840 APPLICATIONS APPROVED, NOT ACCEPTED 5 $130,206 3 $79,377 0 $0 APPLICATIONS DENIED 1 $86,920 0 $0 0 $0 APPLICATIONS WITHDRAWN 0 $0 0 $0 0 $0 FILES CLOSED FOR INCOMPLETENESS 0 $0 1 $103,440 0 $0
Detailed PMIC statistics for the following Tracts:
0014.00
,
0015.00 ,
0016.00 ,
0017.00
2002 - 2018 National Fire Incident Reporting System (NFIRS) incidents See full 2006 National Fire Incident Reporting System statistics for zip code 49127, Michigan
Most common first names in zip code 49127 among deceased individuals Name Count Lived (average)
John 53 74.7 years William 49 74.4 years Mary 49 81.4 years Robert 48 71.5 years Anna 32 82.8 years Richard 31 71.3 years Charles 30 75.7 years Edward 28 76.4 years James 28 71.9 years Joseph 24 70.2 years
Most common last names in zip code 49127 among deceased individuals Last name Count Lived (average)
Brown 14 79.2 years Johnson 13 80.5 years Davis 12 73.5 years Schultz 12 75.5 years Smith 10 67.9 years Miller 10 68.4 years Hill 9 80.1 years Ott 9 73.0 years Geisler 8 80.7 years Ball 8 69.7 years
Businesses in zip code 49127
Name Count Name Count
Ace Hardware 1 Honda 1 Baymont Inn 1 Long John Silver's 1 Burger King 1 MasterBrand Cabinets 4 Comfort Suites 1 McDonald's 1 Cracker Barrel 1 Pizza Hut 1 DHL 1 Popeyes 1 Dairy Queen 1 Quiznos 1 Decora Cabinetry 2 Starbucks 1 Domino's Pizza 1 Super 8 1 FedEx 2 UPS 2 Hilton 1 Walgreens 2 Holiday Inn 1
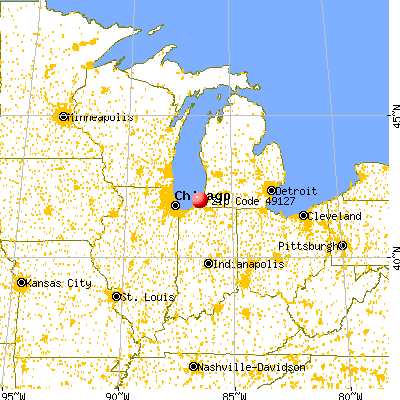


 Nearest zip codes: 49085, 49101, 49106, 49125, 49119, 49126.
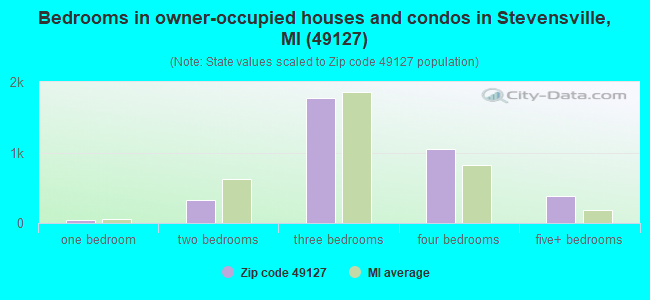
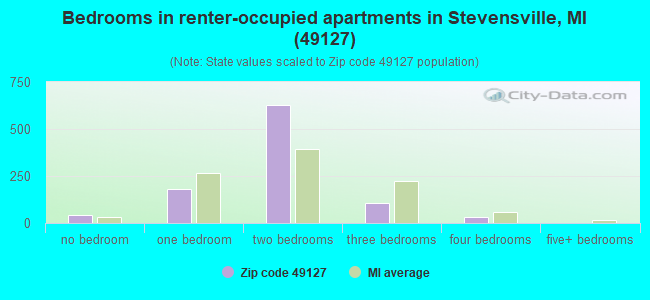
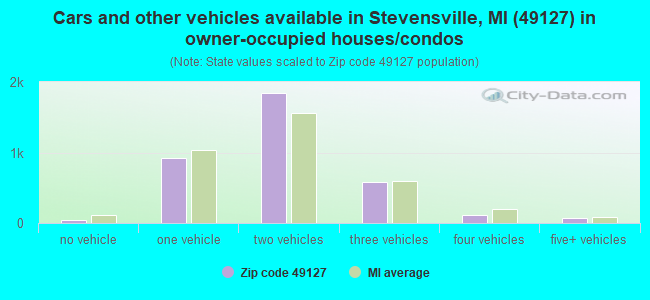
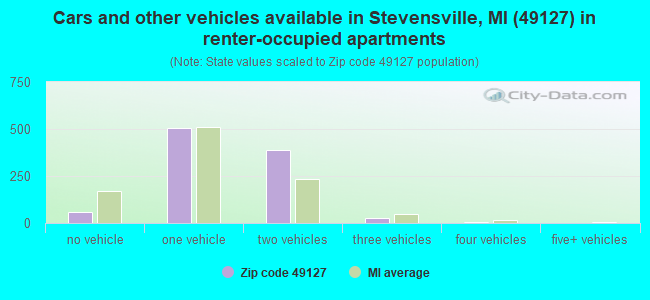


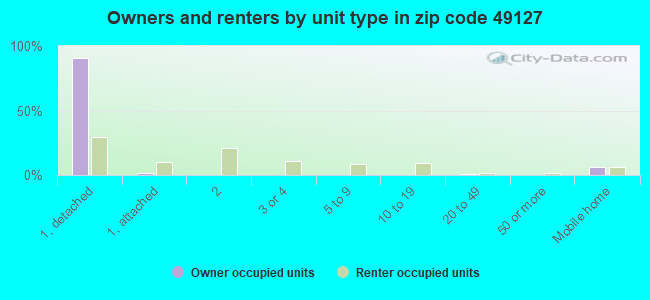


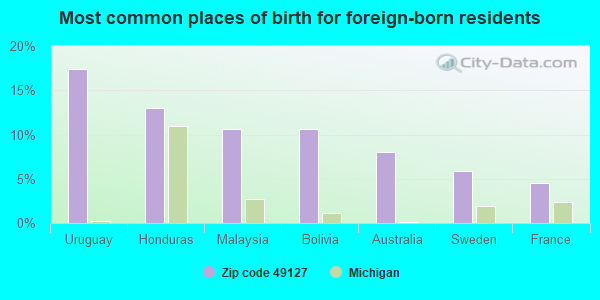
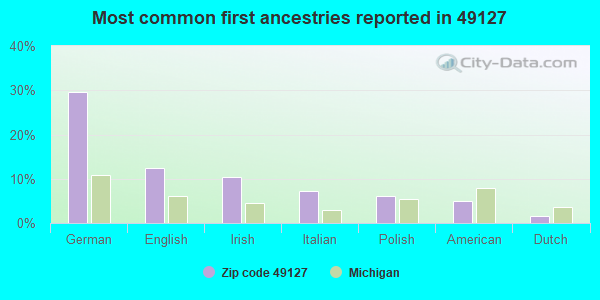

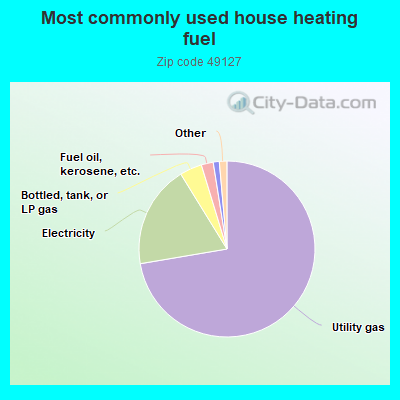
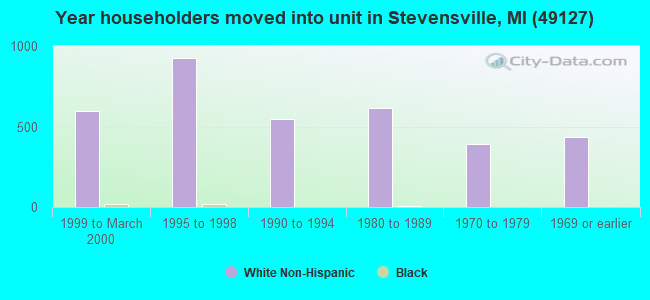
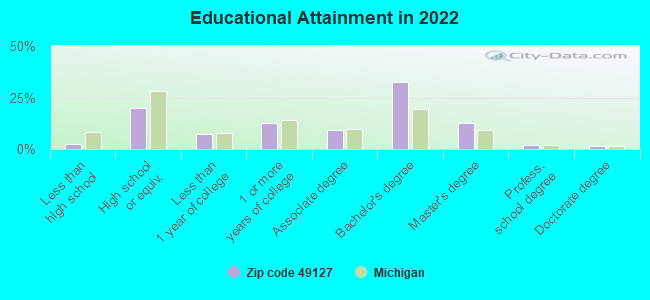
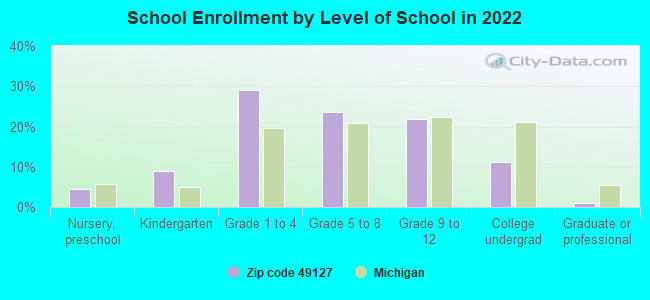
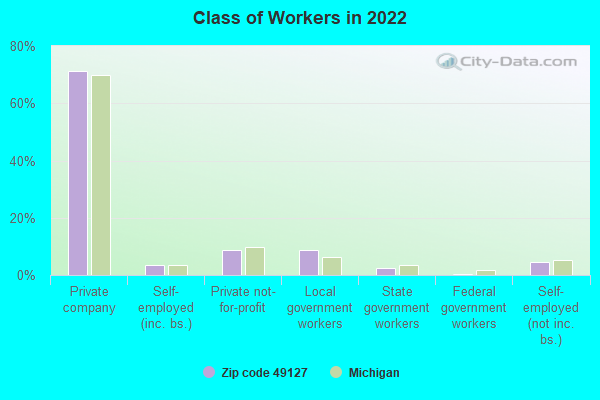
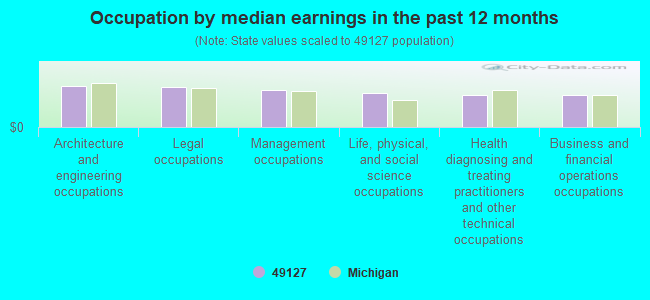
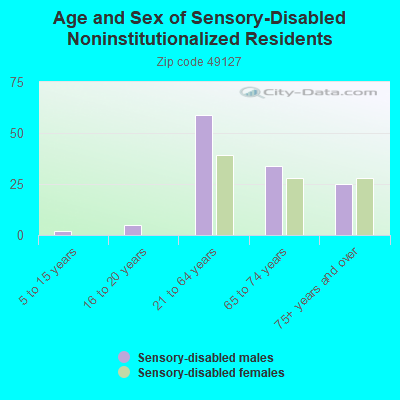
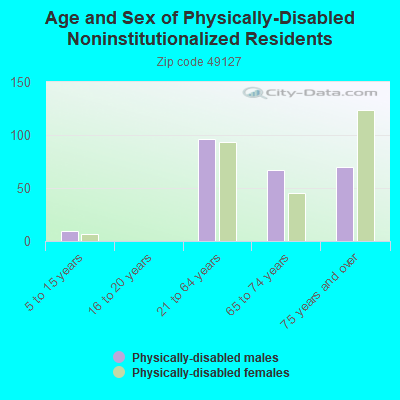
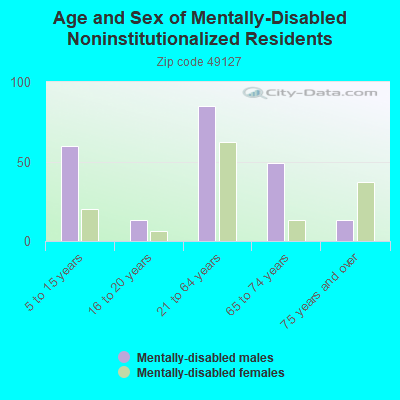
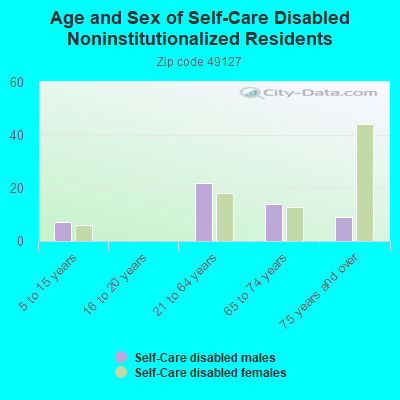
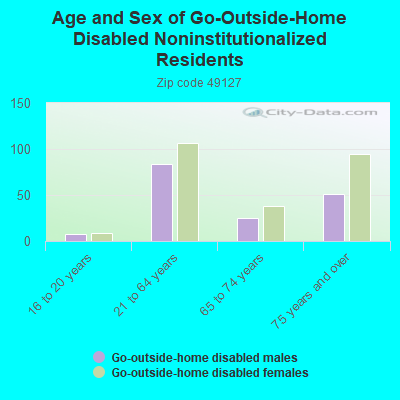
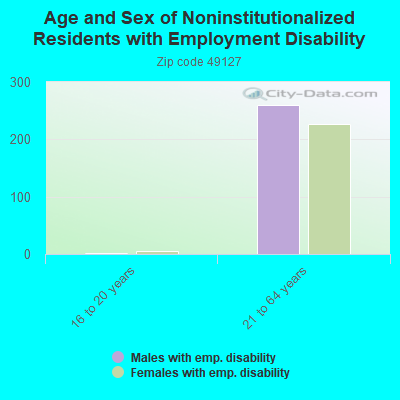
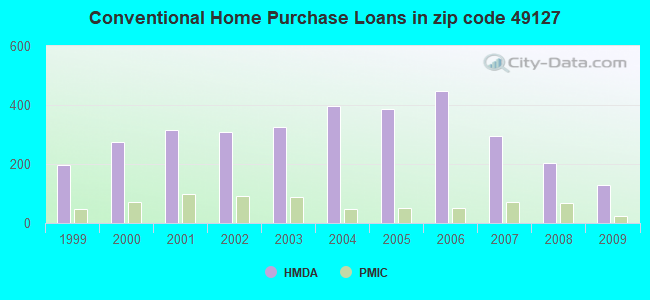
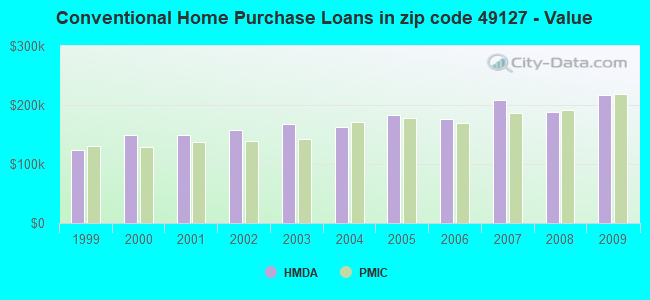
 According to the data from the years 2002 - 2018 the average number of fire incidents per year is 27. The highest number of reported fire incidents - 49 took place in 2015, and the least - 2 in 2014. The data has a decreasing trend.
 When looking into fire subcategories, the most reports belonged to: Structure Fires (45.5%), and Outside Fires (31.0%).