Estimated zip code population in 2022: 1,940 Zip code population in 2010: 1,735 Zip code population in 2000: 1,810
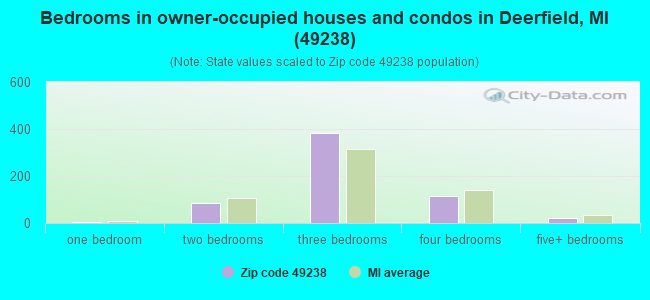
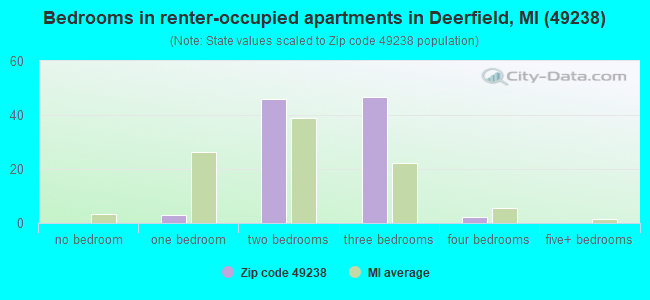
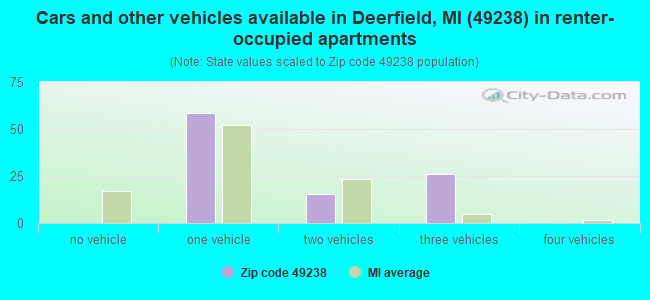
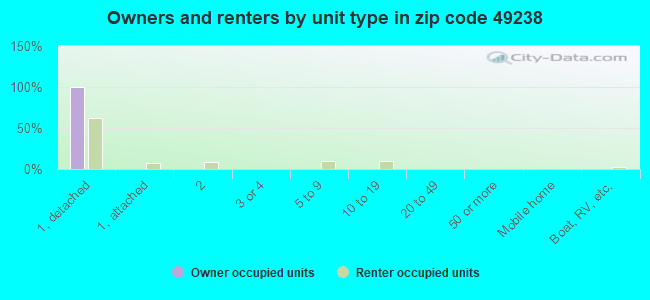
Houses and condos: 836 Renter-occupied apartments: 99
% of renters here:
14%
State:
27%
March 2022 cost of living index in zip code 49238: 90.4 (less than average, U.S. average is 100)
Land area: 28.3 sq. mi. Water area: 0.2 sq. mi.
Population density: 69 people per square mile
(very low).
OSM Map
General Map
Google Map
MSN Map
OSM Map
General Map
Google Map
MSN Map
OSM Map
General Map
Google Map
MSN Map
OSM Map
General Map
Google Map
MSN Map
Please wait while loading the map...
Real estate property taxes paid for housing units in 2022:
This zip code:
1.2% ($2,494)
Michigan:
1.2% ($2,746)
Median real estate property taxes paid for housing units with mortgages in 2022: $2,538 (1.2%) Median real estate property taxes paid for housing units with no mortgage in 2022: $2,442 (1.2%)
Business Search- 14 Million verified businesses
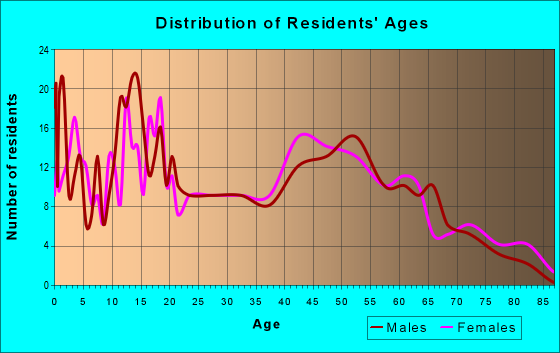
Males: 912
(47.0%)
Females: 1,028
(53.0%)
For population 25 years and over in 49238:
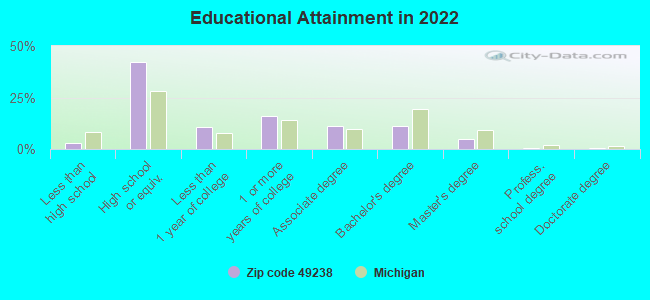
High school or higher: 96.0%
Bachelor's degree or higher: 16.8%
Graduate or professional degree: 5.6%
Unemployed: 2.9%
Mean travel time to work (commute): 33.1 minutes
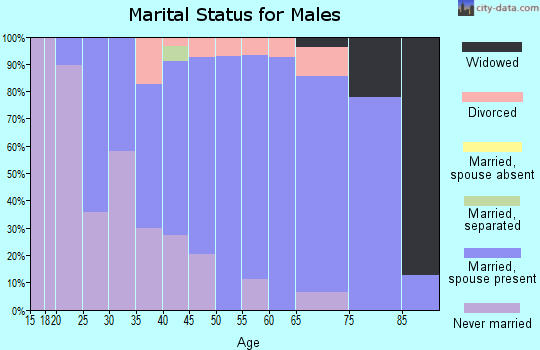
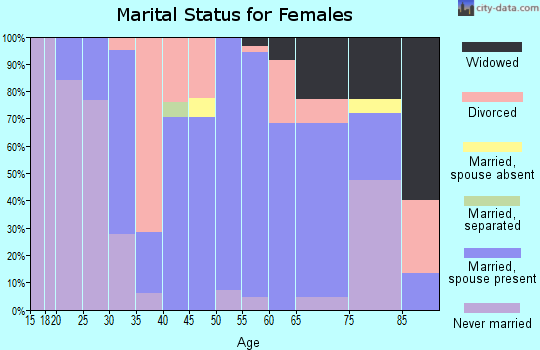
For population 15 years and over in 49238:
Never married: 31.9%
Now married: 51.5%
Separated: 0.5%
Widowed: 4.4%
Divorced: 11.7%
Zip code 49238 compared to state average:
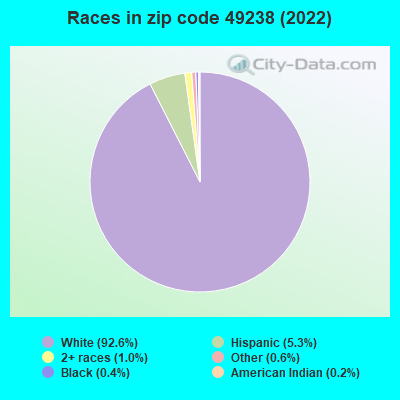
Black race population percentage significantly below state average.
Median age below state average.
Foreign-born population percentage significantly below state average.
Renting percentage below state average.
Length of stay since moving in significantly above state average.
House age above state average.
Percentage of population with a bachelor's degree or higher below state average.
Estimated median house/condo value in 2022: $204,314
49238:
$204,314
Michigan:
$224,400
According to our research of Michigan and other state lists, there were 4 registered sex offenders living in 49238 zip code as of April 24, 2024. The ratio of all residents to sex offenders in zip code 49238 is 458 to 1. The ratio of registered sex offenders to all residents in this zip code is lower than the state average.
Median resident age:
This zip code:
34.0 years
Michigan median age:
40.3 years
Average household size:
This zip code:
2.7 people
Michigan:
2.4 people
Averages for the 2020 tax year for zip code 49238, filed in 2021:
Average Adjusted Gross Income (AGI) in 2020: $60,545 (Individual Income Tax Returns)
Here:
$60,545
State:
$68,945
Salary/wage: $53,645 (reported on 81.2% of returns)
Here:
$53,645
State:
$57,142
(% of AGI for various income ranges: 1201.3% for AGIs below $25k, 3470.7% for AGIs $25k-50k, 6270.9% for AGIs $50k-75k, 8597.1% for AGIs $75k-100k, 21350.0% for AGIs $100k-200k)
Taxable interest for individuals: $510 (reported on 26.2% of returns)
This zip code:
$510
Michigan:
$1,630
(% of AGI for various income ranges: 15.3% for AGIs below $25k, 20.0% for AGIs $25k-50k, 9.1% for AGIs $50k-75k, 1.4% for AGIs $75k-100k, 61.4% for AGIs $100k-200k)
Ordinary dividends: $1,507 (reported on 17.5% of returns)
Here:
$1,507
State:
$6,972
(% of AGI for various income ranges: 11.3% for AGIs below $25k, 11.3% for AGIs $25k-50k, 24.5% for AGIs $50k-75k, 22.9% for AGIs $75k-100k, 191.4% for AGIs $100k-200k)
Net capital gain/loss in AGI: +$5,010 (reported on 12.5% of returns)
Here:
+$5,010
State:
+$20,064
(% of AGI for various income ranges: 2.7% for AGIs $25k-50k, 57.3% for AGIs $50k-75k, 620.0% for AGIs $100k-200k)
Profit/loss from business: +$5,770 (reported on 12.5% of returns)
Here:
+$5,770
State:
+$11,172
(% of AGI for various income ranges: 78.7% for AGIs below $25k, 118.0% for AGIs $25k-50k, 74.5% for AGIs $50k-75k, 285.7% for AGIs $75k-100k)
Taxable individual retirement arrangement distribution: $9,838 (reported on 10.0% of returns)
49238:
$9,838
Michigan:
$19,803
(% of AGI for various income ranges: 66.7% for AGIs below $25k, 252.0% for AGIs $25k-50k, 441.4% for AGIs $75k-100k)
Total itemized deductions: $19,867 (reported on 3.8% of returns)
Here:
$19,867
State:
$34,117
(% of AGI for various income ranges: 541.8% for AGIs $50k-75k)
Taxes paid: $7,267 (reported on 3.8% of returns)
49238:
$7,267
State:
$7,972
(% of AGI for various income ranges: 198.2% for AGIs $50k-75k)
Earned income credit: $1,922 (reported on 11.2% of returns)
Here:
$1,922
State:
$2,251
(% of AGI for various income ranges: 51.3% for AGIs below $25k, 64.0% for AGIs $25k-50k)
Percentage of individuals using paid preparers for their 2020 taxes: 96.2%
Here:
96%
State:
93%
(% for various income ranges: 95.8% for AGIs below $25k, 95.0% for AGIs $25k-50k, 100.0% for AGIs $50k-75k, 100.0% for AGIs $75k-100k, 92.3% for AGIs $100k-200k)
Averages for the 2012 tax year for zip code 49238, filed in 2013:
Average Adjusted Gross Income (AGI) in 2012: $48,732 (Individual Income Tax Returns)
Here:
$48,732
State:
$55,609
Salary/wage: $44,104 (reported on 82.9% of returns)
Here:
$44,104
State:
$46,782
(% of AGI for various income ranges: 69.7% for AGIs below $25k, 71.5% for AGIs $25k-50k, 77.6% for AGIs $50k-75k, 78.8% for AGIs $75k-100k, 74.2% for AGIs $100k-200k)
Taxable interest for individuals: $712 (reported on 31.7% of returns)
This zip code:
$712
Michigan:
$1,491
(% of AGI for various income ranges: 0.8% for AGIs below $25k, 0.5% for AGIs $25k-50k, 0.6% for AGIs $50k-75k, 0.5% for AGIs $100k-200k)
Ordinary dividends: $1,006 (reported on 20.7% of returns)
Here:
$1,006
State:
$6,225
(% of AGI for various income ranges: 0.7% for AGIs below $25k, 0.9% for AGIs $25k-50k, 0.5% for AGIs $50k-75k, 0.2% for AGIs $75k-100k, 0.3% for AGIs $100k-200k)
Net capital gain/loss in AGI: +$533 (reported on 11.0% of returns)
Here:
+$533
State:
+$9,326
(% of AGI for various income ranges: 0.5% for AGIs $100k-200k)
Profit/loss from business: +$4,210 (reported on 12.2% of returns)
Here:
+$4,210
State:
+$11,523
(% of AGI for various income ranges: 7.0% for AGIs below $25k, 0.4% for AGIs $25k-50k, 0.6% for AGIs $50k-75k, 1.0% for AGIs $75k-100k)
Taxable individual retirement arrangement distribution: $10,170 (reported on 12.2% of returns)
49238:
$10,170
Michigan:
$15,298
(% of AGI for various income ranges: 2.6% for AGIs below $25k, 2.8% for AGIs $25k-50k, 3.5% for AGIs $50k-75k, 5.2% for AGIs $75k-100k)
Total itemized deductions: $16,639 (19% of AGI, reported on 28.0% of returns)
Here:
$16,639
State:
$21,628
Here:
19.4% of AGI
State:
18.4% of AGI
(% of AGI for various income ranges: 6.7% for AGIs below $25k, 7.5% for AGIs $25k-50k, 9.8% for AGIs $50k-75k, 11.9% for AGIs $75k-100k, 9.8% for AGIs $100k-200k)
Charity contributions: $2,345 (reported on 24.4% of returns)
Here:
$2,345
State:
$4,225
(% of AGI for various income ranges: 0.7% for AGIs below $25k, 0.7% for AGIs $25k-50k, 1.3% for AGIs $50k-75k, 1.4% for AGIs $75k-100k, 1.3% for AGIs $100k-200k)
Taxes paid: $6,274 (reported on 28.0% of returns)
49238:
$6,274
State:
$8,327
(% of AGI for various income ranges: 1.7% for AGIs below $25k, 2.5% for AGIs $25k-50k, 2.8% for AGIs $50k-75k, 4.5% for AGIs $75k-100k, 4.7% for AGIs $100k-200k)
Earned income credit: $2,491 (reported on 13.4% of returns)
Here:
$2,491
State:
$2,306
(% of AGI for various income ranges: 5.7% for AGIs below $25k, 1.0% for AGIs $25k-50k)
Percentage of individuals using paid preparers for their 2012 taxes: 64.6%
Here:
65%
State:
57%
(% for various income ranges: 58.1% for AGIs below $25k, 66.7% for AGIs $25k-50k, 64.3% for AGIs $50k-75k, 70.0% for AGIs $75k-100k, 77.8% for AGIs $100k-200k)
Averages for the 2004 tax year for zip code 49238, filed in 2005:
Average Adjusted Gross Income (AGI) in 2004: $46,903 (Individual Income Tax Returns)
Here:
$46,903
State:
$48,204
Salary/wage: $44,999 (reported on 85.4% of returns)
Here:
$44,999
State:
$42,791
(% of AGI for various income ranges: 85.9% for AGIs below $10k, 68.2% for AGIs $10k-25k, 78.4% for AGIs $25k-50k, 84.0% for AGIs $50k-75k, 85.9% for AGIs $75k-100k, 83.0% for AGIs over 100k)
Taxable interest for individuals: $796 (reported on 45.7% of returns)
This zip code:
$796
Michigan:
$1,725
(% of AGI for various income ranges: 4.9% for AGIs below $10k, 3.5% for AGIs $10k-25k, 0.6% for AGIs $25k-50k, 0.6% for AGIs $50k-75k, 0.6% for AGIs $75k-100k, 0.2% for AGIs over 100k)
Taxable dividends: $785 (reported on 24.4% of returns)
Here:
$785
State:
$3,420
(% of AGI for various income ranges: 4.2% for AGIs below $10k, 0.6% for AGIs $10k-25k, 0.5% for AGIs $25k-50k, 0.4% for AGIs $50k-75k, 0.1% for AGIs $75k-100k, 0.3% for AGIs over 100k)
Net capital gain/loss: +$2,244 (reported on 15.2% of returns)
Here:
+$2,244
State:
+$8,532
(% of AGI for various income ranges: -2.7% for AGIs below $10k, 0.2% for AGIs $10k-25k, 0.9% for AGIs $25k-50k, 1.0% for AGIs $50k-75k, 0.0% for AGIs $75k-100k, 1.1% for AGIs over 100k)
Profit/loss from business: +$3,250 (reported on 13.8% of returns)
Here:
+$3,250
State:
+$9,547
(% of AGI for various income ranges: 2.0% for AGIs below $10k, 3.5% for AGIs $10k-25k, 2.1% for AGIs $25k-50k, 0.3% for AGIs $50k-75k, 1.0% for AGIs $75k-100k)
Profit/loss from farming: +$8,000 (reported on 4.1% of returns)
Here:
+$8,000
State:
-$4,492
Total itemized deductions: $14,647 (19% of AGI, reported on 36.6% of returns)
Here:
$14,647
State:
$18,509
Here:
18.5% of AGI
State:
20.7% of AGI
(% of AGI for various income ranges: 13.9% for AGIs $10k-25k, 9.8% for AGIs $25k-50k, 14.5% for AGIs $50k-75k, 13.2% for AGIs $75k-100k, 8.8% for AGIs over 100k)
Charity contributions deductions: $1,967 (2% of AGI, reported on 30.9% of returns)
Here:
$1,967
State:
$3,365
Here:
2.4% of AGI
State:
3.6% of AGI
(% of AGI for various income ranges: 1.3% for AGIs $10k-25k, 1.1% for AGIs $25k-50k, 1.6% for AGIs $50k-75k, 1.5% for AGIs $75k-100k, 1.1% for AGIs over 100k)
Total tax: $5,268 (reported on 78.1% of returns)
49238:
$5,268
State:
$7,691
(% of AGI for various income ranges: 4.2% for AGIs below $10k, 3.7% for AGIs $10k-25k, 6.8% for AGIs $25k-50k, 7.9% for AGIs $50k-75k, 9.9% for AGIs $75k-100k, 11.5% for AGIs over 100k)
Earned income credit: $1,592 (reported on 9.1% of returns)
Here:
$1,592
State:
$1,737
Percentage of individuals using paid preparers for their 2004 taxes: 68.5%
Here:
69%
State:
60%
(% for various income ranges: 56.8% for AGIs below $10k, 66.2% for AGIs $10k-25k, 71.7% for AGIs $25k-50k, 73.2% for AGIs $50k-75k, 67.9% for AGIs $75k-100k, 83.9% for AGIs over 100k)
Household received Food Stamps/SNAP in the past 12 months: 37 Household did not receive Food Stamps/SNAP in the past 12 months: 663
Women who had a birth in the past 12 months: 15 (12 now married, 2 unmarried) Women who did not have a birth in the past 12 months: 393 (166 now married, 227 unmarried)
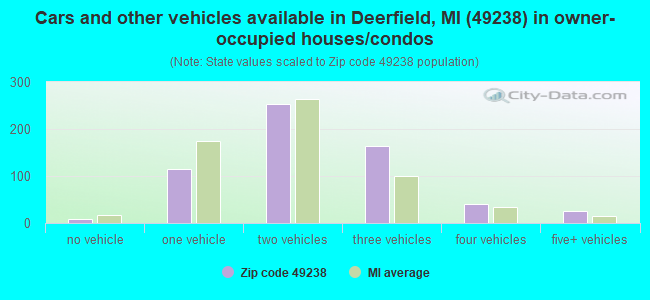
Housing units in zip code 49238 with a mortgage: 397 (20 second mortgage, 18 both second mortgage and home equity loan) Houses without a mortgage: 16
Median monthly owner costs for units with a mortgage: $1,338 Median monthly owner costs for units without a mortgage: $638
Residents with income below the poverty level in 2022:
This zip code:
25.2%
Whole state:
13.4%
Residents with income below 50% of the poverty level in 2022:
This zip code:
7.2%
Whole state:
6.9%
Median number of rooms in houses and condos:
Here:
6.4
State:
6.5
Median number of rooms in apartments:
Here:
5.8
State:
4.3
Notable locations in this zip code not listed on our city pages
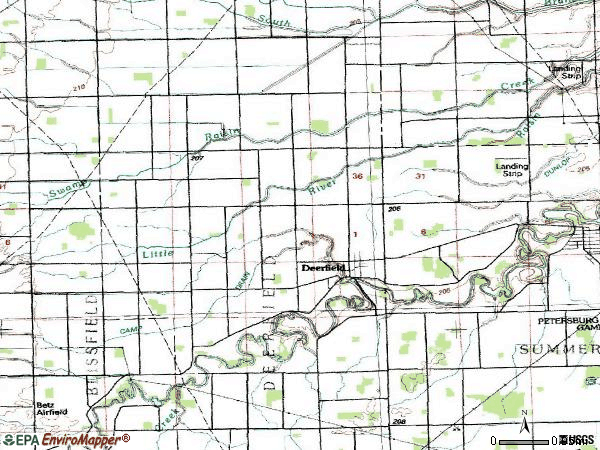
Churches in zip code 49238 include: Deerfield United Methodist Church (A), Saint Alphonsus Church (B), Pentecostal Church of God (C), Free Methodist Church (D), Christian Union Church (E). Display/hide their locations on the map
Cemeteries: Saint Alphonse Cemetery (1), Bragg Cemetery (2), Burnham Cemetery (3), Harvey Cemetery (4), Speigel Cemetery (5), Deerfield Village Cemetery (6). Display/hide their locations on the map
Streams, rivers, and creeks: Fry Drain (A), Woodruff Brook (B), Kelly Drain (C), Spring Brook (D), Brenott Drain (E), Camp Drain (F), Schwab Drain (G), Miller Drain (H). Display/hide their locations on the map
In group quarters: 23 (-1 institutionalized population)
Size of family households: 266 2-persons, 89 3-persons, 47 4-persons, 27 5-persons, 14 6-persons, 61 7-or-more-persons
Size of nonfamily households: 175 1-person, 24 2-persons
240 married couples with children.
252 single-parent households (230 men, 22 women).
98.6% of residents of 49238 zip code speak English at home.
0.4% of residents speak Spanish at home (100% not well).
0.3% of residents speak other Indo-European language at home (83% very well, 17% not well).
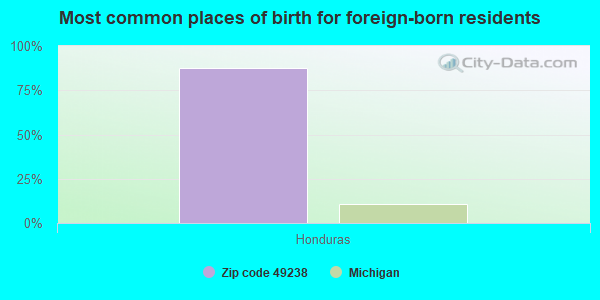
Foreign born population: 7 (0.4%) (0.0% of them are naturalized citizens)
:
0.4%
Whole state:
6.9%
88%Honduras
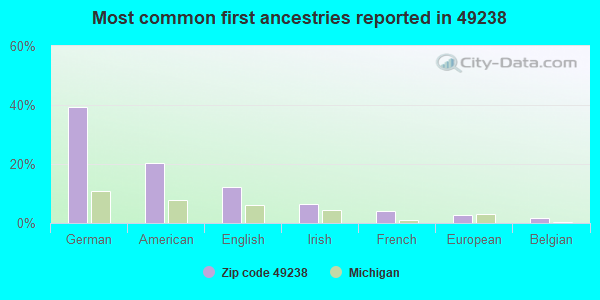
39%German
20%American
12%English
6%Irish
4%French
3%European
2%Belgian
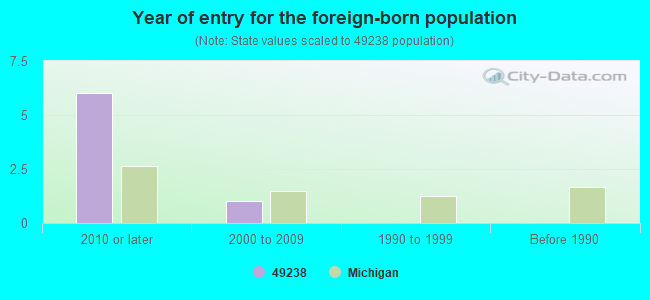
Year of entry for the foreign-born population
62010 or later
12000 to 2009
01990 to 1999
0Before 1990
Facilities with environmental interests located in this zip code:
MI DEPT/ENVIRONMENTAL QUALITY (06S-06E-SEC 30 SE SW ME in DEERFIELD, MI)
Conditionally Exempt Small Quantity Generators, less than 100 kg/month of hazardous waste (Resource Conservation and Recovery Act (tracking hazardous waste)) Business NAICS classification: SUPPORT ACTIVITIES FOR OIL AND GAS OPERATIONS. Organizations: MI DEPT ENVIRONMENTAL QUALITY/GLMD (CONTACT/OPERATOR)
Alternative names: MI DEPT/ENVIRONMENTAL QUALITY/GLMD
Housing units lacking complete plumbing facilities: 1.3% Housing units lacking complete kitchen facilities: 6.2%
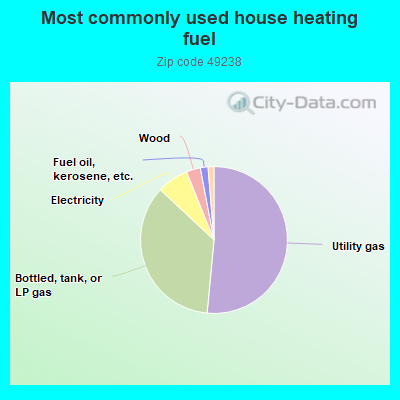
51.7%Utility gas
35.6%Bottled, tank, or LP gas
7.0%Electricity
3.1%Wood
1.7%Fuel oil, kerosene, etc.
Population in 1990: 1,427. Population change in the 1990s: +383 (+26.8%).
Place of birth for U.S.-born residents:
This state: 1,428
Northeast: 13
Midwest: 344
South: 73
West: 77
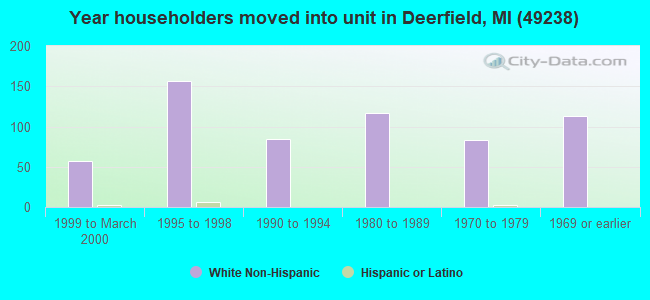
68% of the 49238 zip code residents lived in the same house 5 years ago. Out of people who lived in different houses, 52% lived in this county. Out of people who lived in different counties, 50% lived in Michigan.
96% of the 49238 zip code residents lived in the same house 1 year ago. Out of people who lived in different houses, 51% moved from this county. Out of people who lived in different houses, 2% moved from different county within same state. Out of people who lived in different houses, 47% moved from different state. Out of people who lived in different houses, 11% moved from abroad.
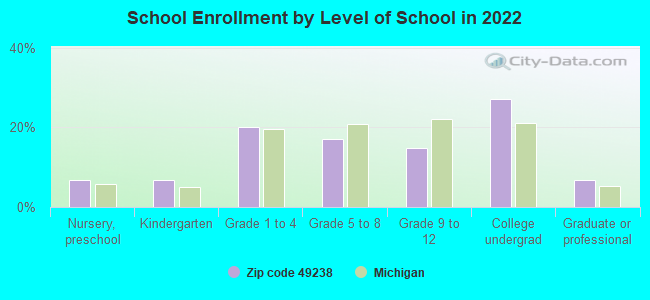
Private vs. public school enrollment:
Students in private schools in grades 1 to 8 (elementary and middle school): 22
Here:
17.4%
Michigan:
12.4%
Students in private schools in grades 9 to 12 (high school): 2
Here:
3.9%
Michigan:
9.8%
Students in private undergraduate colleges: 19
Here:
20.8%
Michigan:
14.9%
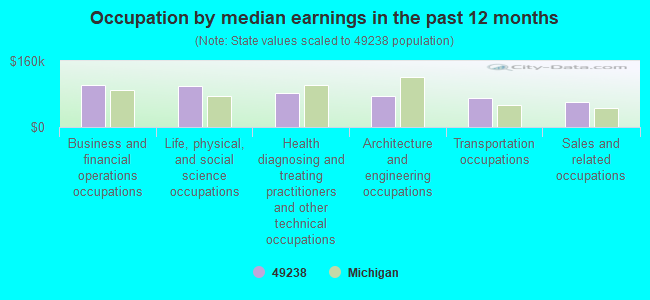
Occupation by median earnings in the past 12 months ($)
102,093Business and financial operations occupations
98,895Life, physical, and social science occupations
83,219Health diagnosing and treating practitioners and other technical occupations
74,421Architecture and engineering occupations
70,145Transportation occupations
61,332Sales and related occupations
Top industries in this zip code by the number of employees in 2005:
Accommodation and Food Services: Full-Service Restaurants (10-19 employees: 1 establishment)
Other Services (except Public Administration): Religious Organizations (5-9: 2)
Other Services (except Public Administration): Automotive Body, Paint, and Interior Repair and Maintenance (5-9: 1)
Professional, Scientific, and Technical Services: Engineering Services (5-9: 1)
Construction: Electrical Contractors (5-9: 1)
Construction: Oil and Gas Pipeline and Related Structures Construction (5-9: 1)
Health Care and Social Assistance: Offices of Dentists (5-9: 1)
People in group quarters in 2010:
15 people in workers' group living quarters and job corps centers
People in group quarters in 2000:
40 people in agriculture workers' dormitories on farms
Fatal accident statistics in 2012:
Fatal accident count: 1
Vehicles involved in fatal accidents: 1
Fatal accidents caused by drunken drivers: 1
Fatalities: 1
Persons involved in fatal accidents: 1
Pedestrians involved in fatal accidents: 0
Fatal accident statistics in 2011:
Fatal accident count: 1
Vehicles involved in fatal accidents: 1
Fatal accidents caused by drunken drivers: 1
Fatalities: 1
Persons involved in fatal accidents: 2
Pedestrians involved in fatal accidents: 0
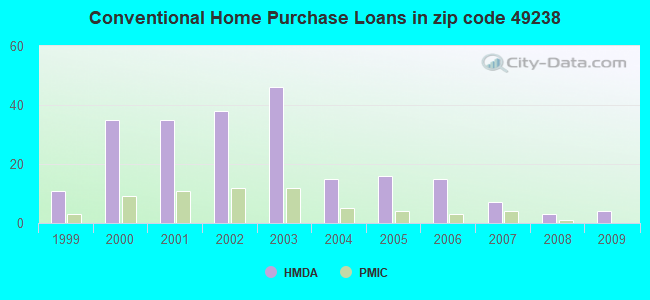
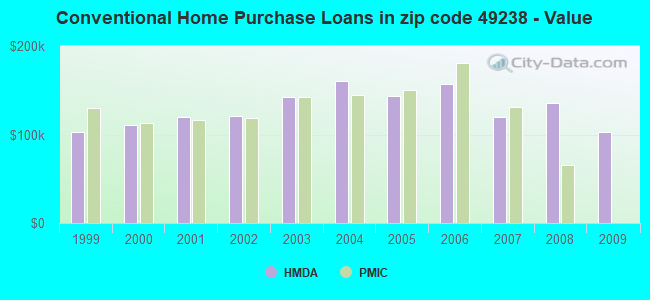
Home Mortgage Disclosure Act Aggregated Statistics For Year 2009 (Based on 2 partial tracts)
A) FHA, FSA/RHS & VA Home Purchase Loans
B) Conventional Home Purchase Loans
C) Refinancings
D) Home Improvement Loans
F) Non-occupant Loans on < 5 Family Dwellings (A B C & D)
Number
Average Value
Number
Average Value
Number
Average Value
Number
Average Value
Number
Average Value
LOANS ORIGINATED
4
$91,145
4
$102,440
24
$150,703
0
$0
0
$0
APPLICATIONS APPROVED, NOT ACCEPTED
1
$59,130
0
$0
4
$191,712
0
$0
0
$0
APPLICATIONS DENIED
2
$80,300
2
$109,220
15
$143,697
1
$57,060
1
$23,500
APPLICATIONS WITHDRAWN
1
$46,480
0
$0
4
$193,392
1
$23,750
0
$0
FILES CLOSED FOR INCOMPLETENESS
0
$0
0
$0
2
$181,900
0
$0
0
$0
Aggregated Statistics For Year 2008 (Based on 2 partial tracts)
A) FHA, FSA/RHS & VA Home Purchase Loans
B) Conventional Home Purchase Loans
C) Refinancings
D) Home Improvement Loans
F) Non-occupant Loans on < 5 Family Dwellings (A B C & D)
G) Loans On Manufactured Home Dwelling (A B C & D)
Number
Average Value
Number
Average Value
Number
Average Value
Number
Average Value
Number
Average Value
Number
Average Value
LOANS ORIGINATED
2
$142,655
3
$135,470
10
$149,937
0
$0
1
$67,390
0
$0
APPLICATIONS APPROVED, NOT ACCEPTED
0
$0
1
$257,940
3
$182,977
0
$0
0
$0
1
$25,560
APPLICATIONS DENIED
1
$103,540
3
$88,563
11
$190,153
2
$55,900
1
$58,090
1
$67,130
APPLICATIONS WITHDRAWN
1
$116,190
1
$46,480
3
$154,403
0
$0
0
$0
0
$0
FILES CLOSED FOR INCOMPLETENESS
0
$0
0
$0
1
$203,200
0
$0
0
$0
0
$0
Aggregated Statistics For Year 2007 (Based on 2 partial tracts)
A) FHA, FSA/RHS & VA Home Purchase Loans
B) Conventional Home Purchase Loans
C) Refinancings
D) Home Improvement Loans
F) Non-occupant Loans on < 5 Family Dwellings (A B C & D)
G) Loans On Manufactured Home Dwelling (A B C & D)
Number
Average Value
Number
Average Value
Number
Average Value
Number
Average Value
Number
Average Value
Number
Average Value
LOANS ORIGINATED
2
$144,720
7
$119,214
22
$132,985
5
$33,050
1
$49,570
0
$0
APPLICATIONS APPROVED, NOT ACCEPTED
0
$0
1
$161,630
5
$142,682
1
$99,150
0
$0
0
$0
APPLICATIONS DENIED
0
$0
4
$117,998
22
$165,753
3
$43,463
0
$0
2
$66,230
APPLICATIONS WITHDRAWN
0
$0
3
$121,267
5
$143,508
0
$0
0
$0
0
$0
FILES CLOSED FOR INCOMPLETENESS
0
$0
0
$0
3
$153,200
0
$0
0
$0
0
$0
Aggregated Statistics For Year 2006 (Based on 2 partial tracts)
B) Conventional Home Purchase Loans
C) Refinancings
D) Home Improvement Loans
F) Non-occupant Loans on < 5 Family Dwellings (A B C & D)
Number
Average Value
Number
Average Value
Number
Average Value
Number
Average Value
LOANS ORIGINATED
15
$157,485
26
$130,600
6
$40,925
1
$208,370
APPLICATIONS APPROVED, NOT ACCEPTED
2
$96,180
9
$179,764
0
$0
1
$85,210
APPLICATIONS DENIED
3
$131,253
22
$159,931
4
$64,615
1
$195,720
APPLICATIONS WITHDRAWN
3
$155,350
12
$166,690
1
$9,550
1
$63,000
FILES CLOSED FOR INCOMPLETENESS
0
$0
5
$153,164
0
$0
0
$0
Aggregated Statistics For Year 2005 (Based on 2 partial tracts)
B) Conventional Home Purchase Loans
C) Refinancings
D) Home Improvement Loans
F) Non-occupant Loans on < 5 Family Dwellings (A B C & D)
G) Loans On Manufactured Home Dwelling (A B C & D)
Number
Average Value
Number
Average Value
Number
Average Value
Number
Average Value
Number
Average Value
LOANS ORIGINATED
16
$143,204
34
$134,014
4
$80,495
2
$84,950
1
$108,700
APPLICATIONS APPROVED, NOT ACCEPTED
3
$130,820
5
$135,142
1
$22,210
0
$0
0
$0
APPLICATIONS DENIED
4
$113,092
21
$158,215
3
$59,473
0
$0
1
$52,160
APPLICATIONS WITHDRAWN
4
$424,740
11
$141,071
1
$92,690
1
$72,810
0
$0
FILES CLOSED FOR INCOMPLETENESS
1
$92,690
6
$147,647
1
$18,070
0
$0
0
$0
Aggregated Statistics For Year 2004 (Based on 2 partial tracts)
A) FHA, FSA/RHS & VA Home Purchase Loans
B) Conventional Home Purchase Loans
C) Refinancings
D) Home Improvement Loans
F) Non-occupant Loans on < 5 Family Dwellings (A B C & D)
G) Loans On Manufactured Home Dwelling (A B C & D)
Number
Average Value
Number
Average Value
Number
Average Value
Number
Average Value
Number
Average Value
Number
Average Value
LOANS ORIGINATED
1
$50,610
15
$160,738
38
$139,251
3
$64,550
1
$74,620
0
$0
APPLICATIONS APPROVED, NOT ACCEPTED
0
$0
1
$19,360
6
$166,195
1
$20,660
0
$0
1
$26,080
APPLICATIONS DENIED
0
$0
3
$183,667
18
$136,100
3
$23,153
1
$65,840
0
$0
APPLICATIONS WITHDRAWN
0
$0
1
$216,370
8
$137,944
1
$44,150
0
$0
0
$0
FILES CLOSED FOR INCOMPLETENESS
0
$0
0
$0
6
$142,053
1
$55,510
0
$0
0
$0
Aggregated Statistics For Year 2003 (Based on 4 partial tracts)
A) FHA, FSA/RHS & VA Home Purchase Loans
B) Conventional Home Purchase Loans
C) Refinancings
D) Home Improvement Loans
F) Non-occupant Loans on < 5 Family Dwellings (A B C & D)
Number
Average Value
Number
Average Value
Number
Average Value
Number
Average Value
Number
Average Value
LOANS ORIGINATED
4
$118,058
46
$141,851
178
$121,472
8
$16,686
7
$71,424
APPLICATIONS APPROVED, NOT ACCEPTED
0
$0
6
$149,150
22
$132,818
2
$6,740
0
$0
APPLICATIONS DENIED
2
$77,770
7
$112,471
66
$128,463
8
$34,842
1
$97,810
APPLICATIONS WITHDRAWN
1
$168,760
3
$112,520
31
$131,453
1
$19,360
1
$67,030
FILES CLOSED FOR INCOMPLETENESS
0
$0
1
$98,080
10
$130,399
0
$0
0
$0
Aggregated Statistics For Year 2002 (Based on 4 partial tracts)
A) FHA, FSA/RHS & VA Home Purchase Loans
B) Conventional Home Purchase Loans
C) Refinancings
D) Home Improvement Loans
F) Non-occupant Loans on < 5 Family Dwellings (A B C & D)
Number
Average Value
Number
Average Value
Number
Average Value
Number
Average Value
Number
Average Value
LOANS ORIGINATED
4
$106,398
38
$121,003
153
$115,744
10
$20,539
3
$89,833
APPLICATIONS APPROVED, NOT ACCEPTED
0
$0
6
$102,347
17
$104,609
3
$32,157
1
$93,600
APPLICATIONS DENIED
0
$0
9
$81,678
34
$98,115
8
$19,428
1
$75,880
APPLICATIONS WITHDRAWN
1
$59,340
2
$128,635
24
$106,058
1
$21,130
1
$90,420
FILES CLOSED FOR INCOMPLETENESS
0
$0
1
$147,690
17
$115,041
0
$0
0
$0
Aggregated Statistics For Year 2001 (Based on 4 partial tracts)
A) FHA, FSA/RHS & VA Home Purchase Loans
B) Conventional Home Purchase Loans
C) Refinancings
D) Home Improvement Loans
F) Non-occupant Loans on < 5 Family Dwellings (A B C & D)
Number
Average Value
Number
Average Value
Number
Average Value
Number
Average Value
Number
Average Value
LOANS ORIGINATED
5
$115,726
35
$119,675
134
$103,615
19
$22,596
6
$79,297
APPLICATIONS APPROVED, NOT ACCEPTED
0
$0
4
$59,070
16
$101,410
2
$18,875
0
$0
APPLICATIONS DENIED
0
$0
5
$93,358
32
$103,985
8
$15,019
1
$82,890
APPLICATIONS WITHDRAWN
0
$0
2
$133,175
22
$104,776
1
$43,800
0
$0
FILES CLOSED FOR INCOMPLETENESS
0
$0
1
$148,580
5
$122,926
0
$0
0
$0
Aggregated Statistics For Year 2000 (Based on 4 partial tracts)
A) FHA, FSA/RHS & VA Home Purchase Loans
B) Conventional Home Purchase Loans
C) Refinancings
D) Home Improvement Loans
F) Non-occupant Loans on < 5 Family Dwellings (A B C & D)
Number
Average Value
Number
Average Value
Number
Average Value
Number
Average Value
Number
Average Value
LOANS ORIGINATED
5
$95,920
35
$110,608
36
$86,456
24
$18,580
3
$69,627
APPLICATIONS APPROVED, NOT ACCEPTED
0
$0
3
$71,070
10
$80,253
9
$24,653
0
$0
APPLICATIONS DENIED
1
$85,580
13
$58,729
16
$89,626
12
$21,131
1
$15,490
APPLICATIONS WITHDRAWN
0
$0
4
$81,225
18
$84,459
1
$22,060
0
$0
FILES CLOSED FOR INCOMPLETENESS
0
$0
0
$0
6
$93,012
0
$0
0
$0
Aggregated Statistics For Year 1999 (Based on 2 partial tracts)
A) FHA, FSA/RHS & VA Home Purchase Loans
B) Conventional Home Purchase Loans
C) Refinancings
D) Home Improvement Loans
F) Non-occupant Loans on < 5 Family Dwellings (A B C & D)
Detailed PMIC statistics for the following Tracts:0610.00
, 8329.00
2002 - 2018 National Fire Incident Reporting System (NFIRS) incidents
According to the data from the years 2002 - 2018 the average number of fires per year is 8. The highest number of fire incidents - 18 took place in 2003, and the least - 2 in 2009. The data has a dropping trend.
When looking into fire subcategories, the most incidents belonged to: Structure Fires (44.2%), and Outside Fires (37.7%).
Fire incident types reported to NFIRS in Zip Code 49238


+$8,000
-$4,492
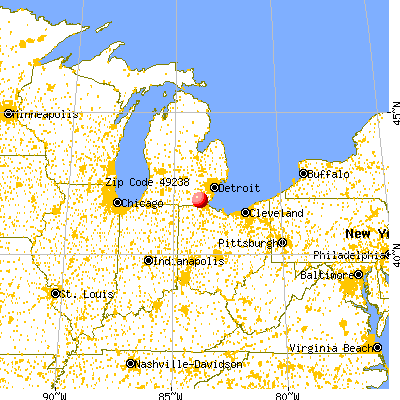
 Nearest zip codes: 49229, 49276, 49270, 49228, 48131, 49268.
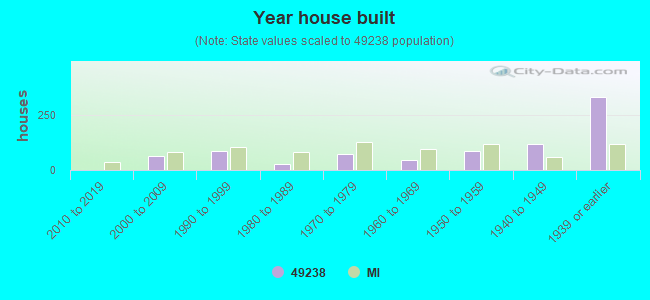


 According to the data from the years 2002 - 2018 the average number of fires per year is 8. The highest number of fire incidents - 18 took place in 2003, and the least - 2 in 2009. The data has a dropping trend.
 When looking into fire subcategories, the most incidents belonged to: Structure Fires (44.2%), and Outside Fires (37.7%).