Estimated zip code population in 2022: 5,116 Zip code population in 2010: 4,958 Zip code population in 2000: 4,828
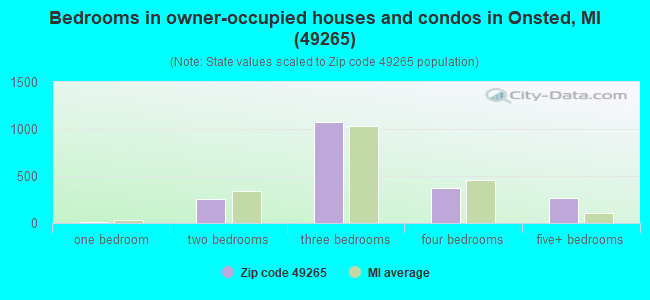
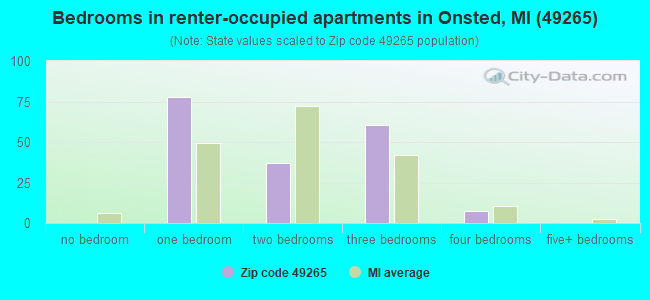
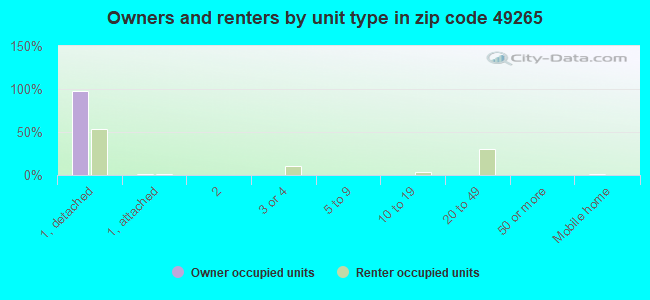
Houses and condos: 2,393 Renter-occupied apartments: 182
% of renters here:
8%
State:
27%
March 2022 cost of living index in zip code 49265: 91.0 (less than average, U.S. average is 100)
Land area: 30.1 sq. mi. Water area: 2.2 sq. mi.
Population density: 170 people per square mile
(very low).
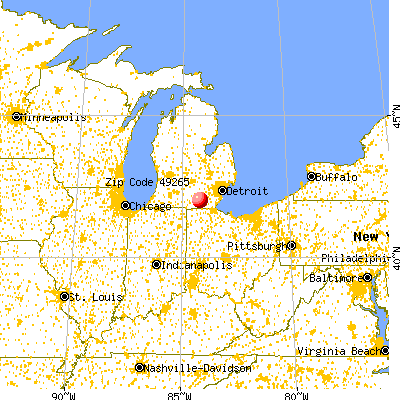
OSM Map
General Map
Google Map
MSN Map
OSM Map
General Map
Google Map
MSN Map
OSM Map
General Map
Google Map
MSN Map
OSM Map
General Map
Google Map
MSN Map
Please wait while loading the map...
Real estate property taxes paid for housing units in 2022:
This zip code:
0.9% ($2,693)
Michigan:
1.2% ($2,746)
Median real estate property taxes paid for housing units with mortgages in 2022: $2,717 (0.9%) Median real estate property taxes paid for housing units with no mortgage in 2022: $2,685 (1.1%)
Business Search- 14 Million verified businesses
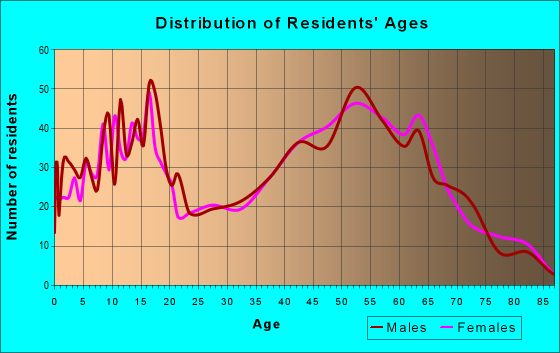
Males: 2,510
(49.1%)
Females: 2,606
(50.9%)
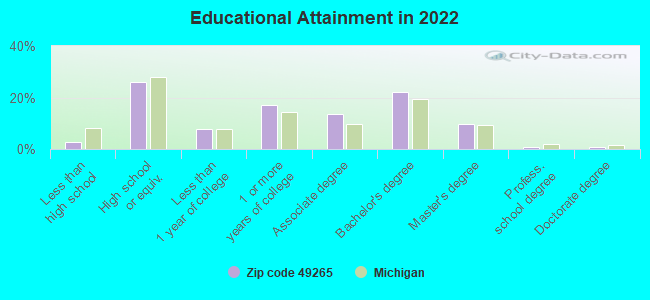
For population 25 years and over in 49265:
High school or higher: 97.1%
Bachelor's degree or higher: 33.0%
Graduate or professional degree: 10.9%
Unemployed: 3.6%
Mean travel time to work (commute): 29.0 minutes
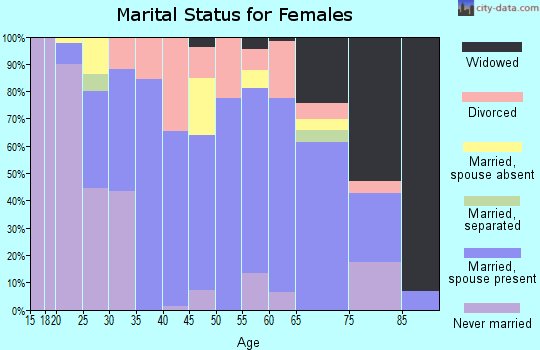
For population 15 years and over in 49265:
Never married: 20.6%
Now married: 65.4%
Separated: 0.5%
Widowed: 3.7%
Divorced: 9.7%
Zip code 49265 compared to state average:
Black race population percentage significantly below state average.
Hispanic race population percentage below state average.
Median age significantly above state average.
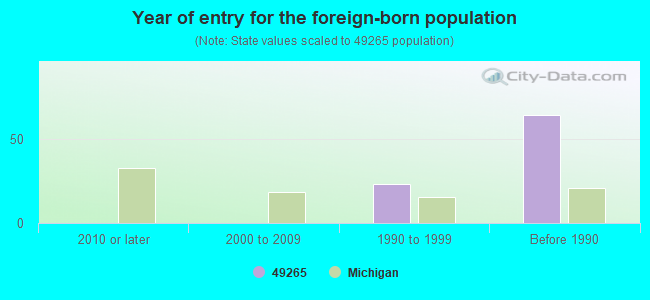
Foreign-born population percentage significantly below state average.
Renting percentage significantly below state average.
Length of stay since moving in significantly above state average.
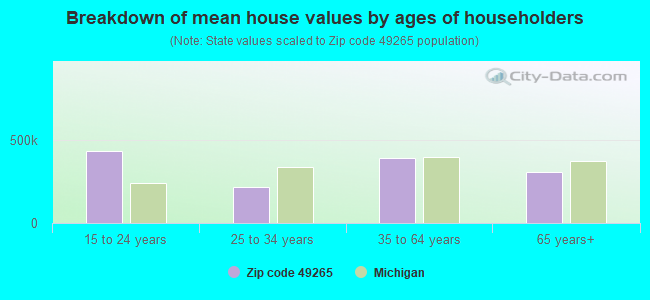
Estimated median house/condo value in 2022: $286,442
49265:
$286,442
Michigan:
$224,400
According to our research of Michigan and other state lists, there were 9 registered sex offenders living in 49265 zip code as of April 25, 2024. The ratio of all residents to sex offenders in zip code 49265 is 579 to 1. The ratio of registered sex offenders to all residents in this zip code is lower than the state average.
Median resident age:
This zip code:
51.2 years
Michigan median age:
40.3 years
Average household size:
This zip code:
2.4 people
Michigan:
2.4 people
Averages for the 2020 tax year for zip code 49265, filed in 2021:
Average Adjusted Gross Income (AGI) in 2020: $70,936 (Individual Income Tax Returns)
Here:
$70,936
State:
$68,945
Salary/wage: $62,582 (reported on 73.2% of returns)
Here:
$62,582
State:
$57,142
(% of AGI for various income ranges: 803.1% for AGIs below $25k, 3000.8% for AGIs $25k-50k, 5735.8% for AGIs $50k-75k, 9079.0% for AGIs $75k-100k, 15041.4% for AGIs $100k-200k, 86310.0% for AGIs over 200k)
Taxable interest for individuals: $1,213 (reported on 35.2% of returns)
This zip code:
$1,213
Michigan:
$1,630
(% of AGI for various income ranges: 26.1% for AGIs below $25k, 25.9% for AGIs $25k-50k, 44.6% for AGIs $50k-75k, 44.8% for AGIs $75k-100k, 89.3% for AGIs $100k-200k, 1350.0% for AGIs over 200k)
Ordinary dividends: $5,236 (reported on 21.5% of returns)
Here:
$5,236
State:
$6,972
(% of AGI for various income ranges: 23.1% for AGIs below $25k, 34.4% for AGIs $25k-50k, 115.0% for AGIs $50k-75k, 215.7% for AGIs $75k-100k, 315.9% for AGIs $100k-200k, 3350.0% for AGIs over 200k)
Net capital gain/loss in AGI: +$6,926 (reported on 20.3% of returns)
Here:
+$6,926
State:
+$20,064
(% of AGI for various income ranges: 3.5% for AGIs below $25k, 22.6% for AGIs $25k-50k, 75.8% for AGIs $50k-75k, 172.9% for AGIs $75k-100k, 519.3% for AGIs $100k-200k, 4993.3% for AGIs over 200k)
Profit/loss from business: +$10,545 (reported on 14.6% of returns)
Here:
+$10,545
State:
+$11,172
(% of AGI for various income ranges: 104.1% for AGIs below $25k, 107.9% for AGIs $25k-50k, 273.1% for AGIs $50k-75k, 141.4% for AGIs $75k-100k, 437.2% for AGIs $100k-200k, 2496.7% for AGIs over 200k)
Taxable individual retirement arrangement distribution: $18,853 (reported on 14.6% of returns)
49265:
$18,853
Michigan:
$19,803
(% of AGI for various income ranges: 90.0% for AGIs below $25k, 145.1% for AGIs $25k-50k, 400.0% for AGIs $50k-75k, 540.0% for AGIs $75k-100k, 911.4% for AGIs $100k-200k, 4316.7% for AGIs over 200k)
Total itemized deductions: $28,406 (reported on 6.1% of returns)
Here:
$28,406
State:
$34,117
(% of AGI for various income ranges: 123.5% for AGIs below $25k, 185.0% for AGIs $50k-75k, 307.1% for AGIs $75k-100k, 508.6% for AGIs $100k-200k, 4256.7% for AGIs over 200k)
Charity contributions: $6,675 (reported on 4.6% of returns)
Here:
$6,675
State:
$13,548
(% of AGI for various income ranges: 36.9% for AGIs $25k-50k, 67.1% for AGIs $75k-100k, 78.3% for AGIs $100k-200k, 963.3% for AGIs over 200k)
Taxes paid: $7,619 (reported on 6.1% of returns)
49265:
$7,619
State:
$7,972
(% of AGI for various income ranges: 58.7% for AGIs $25k-50k, 109.0% for AGIs $75k-100k, 152.1% for AGIs $100k-200k, 1066.7% for AGIs over 200k)
Earned income credit: $1,896 (reported on 8.8% of returns)
Here:
$1,896
State:
$2,251
(% of AGI for various income ranges: 43.9% for AGIs below $25k, 51.0% for AGIs $25k-50k)
Percentage of individuals using paid preparers for their 2020 taxes: 95.0%
Here:
95%
State:
93%
(% for various income ranges: 93.8% for AGIs below $25k, 98.0% for AGIs $25k-50k, 94.7% for AGIs $50k-75k, 93.8% for AGIs $75k-100k, 95.8% for AGIs $100k-200k, 91.7% for AGIs over 200k)
Averages for the 2012 tax year for zip code 49265, filed in 2013:
Average Adjusted Gross Income (AGI) in 2012: $58,643 (Individual Income Tax Returns)
Here:
$58,643
State:
$55,609
Salary/wage: $50,102 (reported on 81.4% of returns)
Here:
$50,102
State:
$46,782
(% of AGI for various income ranges: 61.0% for AGIs below $25k, 62.4% for AGIs $25k-50k, 69.2% for AGIs $50k-75k, 71.1% for AGIs $75k-100k, 76.8% for AGIs $100k-200k, 63.6% for AGIs over 200k)
Taxable interest for individuals: $1,067 (reported on 38.4% of returns)
This zip code:
$1,067
Michigan:
$1,491
(% of AGI for various income ranges: 2.1% for AGIs below $25k, 1.1% for AGIs $25k-50k, 0.5% for AGIs $50k-75k, 0.5% for AGIs $75k-100k, 0.5% for AGIs $100k-200k, 0.5% for AGIs over 200k)
Ordinary dividends: $3,223 (reported on 22.4% of returns)
Here:
$3,223
State:
$6,225
(% of AGI for various income ranges: 2.0% for AGIs below $25k, 0.9% for AGIs $25k-50k, 0.7% for AGIs $50k-75k, 0.9% for AGIs $75k-100k, 1.1% for AGIs $100k-200k, 2.3% for AGIs over 200k)
Net capital gain/loss in AGI: +$2,302 (reported on 17.3% of returns)
Here:
+$2,302
State:
+$9,326
(% of AGI for various income ranges: 0.4% for AGIs below $25k, 0.3% for AGIs $25k-50k, 0.4% for AGIs $75k-100k, 1.0% for AGIs $100k-200k, 1.8% for AGIs over 200k)
Profit/loss from business: +$7,836 (reported on 15.2% of returns)
Here:
+$7,836
State:
+$11,523
(% of AGI for various income ranges: 5.7% for AGIs below $25k, 1.6% for AGIs $25k-50k, 1.7% for AGIs $50k-75k, 1.3% for AGIs $75k-100k, 3.0% for AGIs $100k-200k)
Taxable individual retirement arrangement distribution: $13,591 (reported on 14.3% of returns)
49265:
$13,591
Michigan:
$15,298
(% of AGI for various income ranges: 3.7% for AGIs below $25k, 4.5% for AGIs $25k-50k, 4.0% for AGIs $50k-75k, 3.0% for AGIs $75k-100k, 4.2% for AGIs $100k-200k)
Total itemized deductions: $21,506 (21% of AGI, reported on 36.7% of returns)
Here:
$21,506
State:
$21,628
Here:
21.3% of AGI
State:
18.4% of AGI
(% of AGI for various income ranges: 10.9% for AGIs below $25k, 11.4% for AGIs $25k-50k, 11.9% for AGIs $50k-75k, 12.5% for AGIs $75k-100k, 13.9% for AGIs $100k-200k, 18.3% for AGIs over 200k)
Charity contributions: $3,238 (reported on 30.4% of returns)
Here:
$3,238
State:
$4,225
(% of AGI for various income ranges: 0.8% for AGIs below $25k, 1.3% for AGIs $25k-50k, 1.3% for AGIs $50k-75k, 1.7% for AGIs $75k-100k, 1.5% for AGIs $100k-200k, 3.1% for AGIs over 200k)
Taxes paid: $7,509 (reported on 36.7% of returns)
49265:
$7,509
State:
$8,327
(% of AGI for various income ranges: 2.4% for AGIs below $25k, 3.1% for AGIs $25k-50k, 3.8% for AGIs $50k-75k, 4.5% for AGIs $75k-100k, 5.9% for AGIs $100k-200k, 6.0% for AGIs over 200k)
Earned income credit: $2,066 (reported on 12.2% of returns)
Here:
$2,066
State:
$2,306
(% of AGI for various income ranges: 4.5% for AGIs below $25k, 1.0% for AGIs $25k-50k)
Percentage of individuals using paid preparers for their 2012 taxes: 65.4%
Here:
65%
State:
57%
(% for various income ranges: 57.6% for AGIs below $25k, 70.2% for AGIs $25k-50k, 66.7% for AGIs $50k-75k, 71.4% for AGIs $75k-100k, 68.8% for AGIs $100k-200k, 83.3% for AGIs over 200k)
Averages for the 2004 tax year for zip code 49265, filed in 2005:
Average Adjusted Gross Income (AGI) in 2004: $52,978 (Individual Income Tax Returns)
Here:
$52,978
State:
$48,204
Salary/wage: $48,116 (reported on 86.2% of returns)
Here:
$48,116
State:
$42,791
(% of AGI for various income ranges: 114.2% for AGIs below $10k, 63.6% for AGIs $10k-25k, 72.0% for AGIs $25k-50k, 79.4% for AGIs $50k-75k, 84.5% for AGIs $75k-100k, 77.2% for AGIs over 100k)
Taxable interest for individuals: $1,286 (reported on 55.2% of returns)
This zip code:
$1,286
Michigan:
$1,725
(% of AGI for various income ranges: 7.0% for AGIs below $10k, 3.4% for AGIs $10k-25k, 1.7% for AGIs $25k-50k, 1.2% for AGIs $50k-75k, 0.8% for AGIs $75k-100k, 1.1% for AGIs over 100k)
Taxable dividends: $1,986 (reported on 28.6% of returns)
Here:
$1,986
State:
$3,420
(% of AGI for various income ranges: 1.7% for AGIs below $10k, 2.1% for AGIs $10k-25k, 1.2% for AGIs $25k-50k, 1.1% for AGIs $50k-75k, 0.7% for AGIs $75k-100k, 1.0% for AGIs over 100k)
Net capital gain/loss: +$8,345 (reported on 20.6% of returns)
Here:
+$8,345
State:
+$8,532
(% of AGI for various income ranges: -0.7% for AGIs below $10k, -0.2% for AGIs $10k-25k, 0.9% for AGIs $25k-50k, 0.6% for AGIs $50k-75k, 1.1% for AGIs $75k-100k, 7.4% for AGIs over 100k)
Profit/loss from business: +$9,057 (reported on 15.9% of returns)
Here:
+$9,057
State:
+$9,547
(% of AGI for various income ranges: 4.2% for AGIs below $10k, 3.2% for AGIs $10k-25k, 4.5% for AGIs $25k-50k, 2.2% for AGIs $50k-75k, 1.6% for AGIs $75k-100k, 2.9% for AGIs over 100k)
IRA payment deduction: $3,952 (reported on 1.8% of returns)
49265:
$3,952
Michigan:
$2,875
Total itemized deductions: $17,569 (21% of AGI, reported on 45.5% of returns)
Here:
$17,569
State:
$18,509
Here:
20.9% of AGI
State:
20.7% of AGI
(% of AGI for various income ranges: 15.8% for AGIs below $10k, 12.1% for AGIs $10k-25k, 13.9% for AGIs $25k-50k, 16.3% for AGIs $50k-75k, 16.4% for AGIs $75k-100k, 14.5% for AGIs over 100k)
Charity contributions deductions: $2,242 (3% of AGI, reported on 41.6% of returns)
Here:
$2,242
State:
$3,365
Here:
2.6% of AGI
State:
3.6% of AGI
(% of AGI for various income ranges: 0.7% for AGIs below $10k, 1.5% for AGIs $10k-25k, 1.4% for AGIs $25k-50k, 1.5% for AGIs $50k-75k, 1.9% for AGIs $75k-100k, 2.0% for AGIs over 100k)
Total tax: $7,303 (reported on 79.1% of returns)
49265:
$7,303
State:
$7,691
(% of AGI for various income ranges: 2.8% for AGIs below $10k, 4.0% for AGIs $10k-25k, 6.6% for AGIs $25k-50k, 8.0% for AGIs $50k-75k, 9.7% for AGIs $75k-100k, 16.0% for AGIs over 100k)
Earned income credit: $1,521 (reported on 8.1% of returns)
Here:
$1,521
State:
$1,737
Percentage of individuals using paid preparers for their 2004 taxes: 64.8%
Here:
65%
State:
60%
(% for various income ranges: 53.3% for AGIs below $10k, 65.6% for AGIs $10k-25k, 66.7% for AGIs $25k-50k, 67.8% for AGIs $50k-75k, 67.7% for AGIs $75k-100k, 71.5% for AGIs over 100k)
Likely homosexual households (counted as self-reported same-sex unmarried-partner households)
Lesbian couples: 0.1% of all households
Gay men: 0.0% of all households
Household received Food Stamps/SNAP in the past 12 months: 119 Household did not receive Food Stamps/SNAP in the past 12 months: 2,006
Women who had a birth in the past 12 months: 67 (60 now married, 8 unmarried) Women who did not have a birth in the past 12 months: 812 (387 now married, 423 unmarried)
Housing units in zip code 49265 with a mortgage: 1,293 (108 second mortgage, 85 both second mortgage and home equity loan) Houses without a mortgage: 53
Median monthly owner costs for units with a mortgage: $1,415 Median monthly owner costs for units without a mortgage: $543
Residents with income below the poverty level in 2022:
This zip code:
2.9%
Whole state:
13.4%
Residents with income below 50% of the poverty level in 2022:
This zip code:
1.3%
Whole state:
6.9%
Median number of rooms in houses and condos:
Here:
6.5
State:
6.5
Median number of rooms in apartments:
Here:
4.4
State:
4.3
Notable locations in this zip code not listed on our city pages
Notable locations in zip code 49265: Irish Hills Golf Club (A), Cambridge Township Hall (B), Onsted Branch Library (C), Cambridge Township Fire Department (D). Display/hide their locations on the map
Churches in zip code 49265 include: Gateway Community Church (A), Irish Hills Community Church (B), Springville United Methodist Church (C). Display/hide their locations on the map
Parks in zip code 49265 include: Hidden Lake Gardens (1), Onsted Park (2), Wooden Stone School Historical Marker (3), Hidden Lake Park (4). Display/hide their locations on the map
Size of family households: 908 2-persons, 274 3-persons, 233 4-persons, 131 5-persons, 18 6-persons, 29 7-or-more-persons
Size of nonfamily households: 478 1-person, 61 2-persons
628 married couples with children.
202 single-parent households (66 men, 136 women).
98.4% of residents of 49265 zip code speak English at home.
0.5% of residents speak Spanish at home (80% very well, 20% not well).
0.8% of residents speak other Indo-European language at home (100% very well).
0.1% of residents speak Asian or Pacific Island language at home (100% very well).
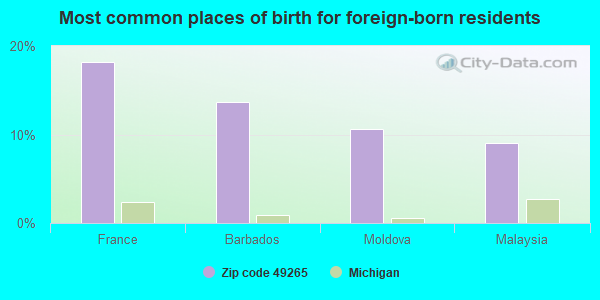
Foreign born population: 66 (1.3%) (81.1% of them are naturalized citizens)
This zip code:
1.3%
Whole state:
6.9%
18%France
14%Barbados
11%Moldova
9%Malaysia
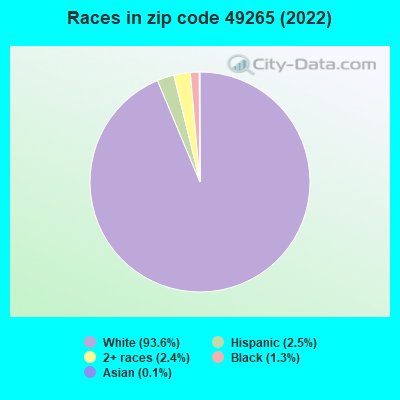
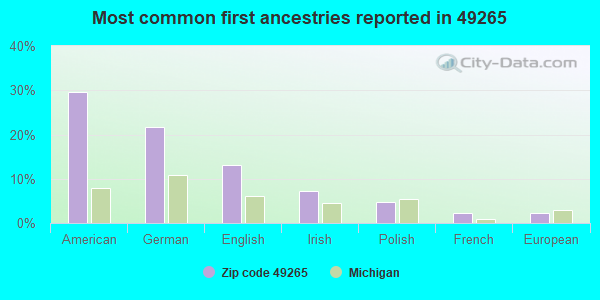
30%American
22%German
13%English
7%Irish
5%Polish
2%French
2%European
Year of entry for the foreign-born population
02010 or later
02000 to 2009
231990 to 1999
64Before 1990
Facilities with environmental interests located in this zip code:
FABCO FABRICATING COMPANY (11695 PENTECOST HIGHWAY in ONSTED, MI)
CRITERIA AND HAZARDOUS AIR POLLUTANT INVENTORY (Inventory of air pollution sources) (Resource Conservation and Recovery Act (tracking hazardous waste)) Business SIC classification: REFUSE SYSTEMS Business NAICS classification: SOLID WASTE LANDFILL.
Housing units lacking complete plumbing facilities: 1.5%
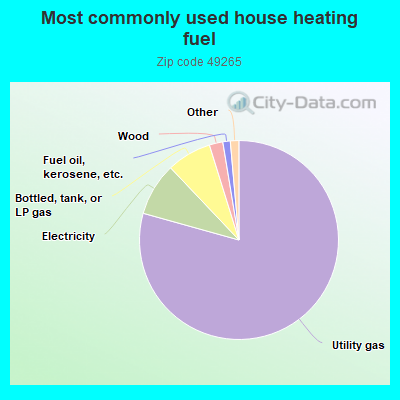
79.5%Utility gas
8.6%Electricity
7.3%Bottled, tank, or LP gas
2.2%Wood
1.2%Fuel oil, kerosene, etc.
0.8%Other fuel
0.6%No fuel used
Population in 1990: 4,601. Population change in the 1990s: +227 (+4.9%).
Place of birth for U.S.-born residents:
This state: 3,704
Northeast: 156
Midwest: 750
South: 266
West: 156
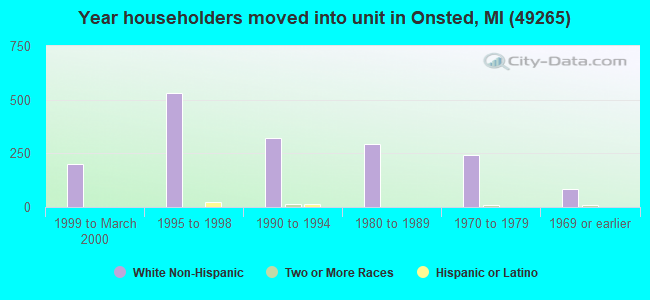
58% of the 49265 zip code residents lived in the same house 5 years ago. Out of people who lived in different houses, 44% lived in this county. Out of people who lived in different counties, 50% lived in Michigan.
93% of the 49265 zip code residents lived in the same house 1 year ago. Out of people who lived in different houses, 47% moved from this county. Out of people who lived in different houses, 19% moved from different county within same state. Out of people who lived in different houses, 38% moved from different state.
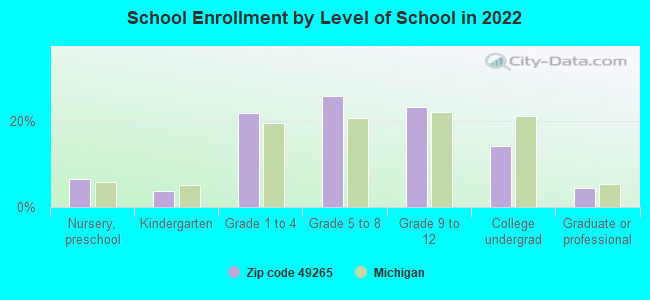
Private vs. public school enrollment:
Students in private schools in grades 1 to 8 (elementary and middle school): 55
Here:
11.1%
Michigan:
12.4%
Students in private schools in grades 9 to 12 (high school): 10
Here:
4.2%
Michigan:
9.8%
Students in private undergraduate colleges:
Here:
0.0%
Michigan:
14.9%
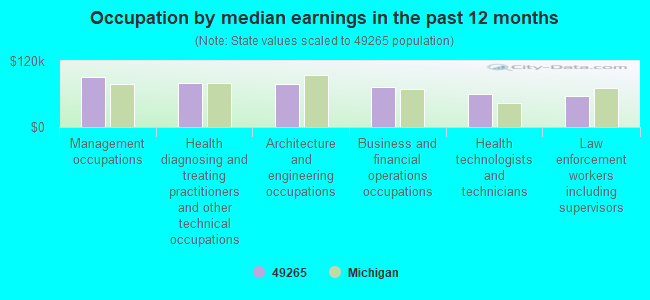
Occupation by median earnings in the past 12 months ($)
90,168Management occupations
79,345Health diagnosing and treating practitioners and other technical occupations
78,991Architecture and engineering occupations
73,455Business and financial operations occupations
60,762Health technologists and technicians
55,770Law enforcement workers including supervisors
Top industries in this zip code by the number of employees in 2005:
Construction: New Single-Family Housing Construction (except Operative Builders) (5-9 employees: 5 establishments, 1-4 employees: 4 establishments)
Accommodation and Food Services: Full-Service Restaurants (20-49: 1, 1-4: 1)
Health Care and Social Assistance: Services for the Elderly and Persons with Disabilities (20-49: 1)
Accommodation and Food Services: Snack and Nonalcoholic Beverage Bars (10-19: 1, 1-4: 2)
Accommodation and Food Services: Limited-Service Restaurants (10-19: 1, 1-4: 1)
Fatal accident statistics in 2014:
Fatal accident count: 2
Vehicles involved in fatal accidents: 3
Fatal accidents caused by drunken drivers: 0
Fatalities: 2
Persons involved in fatal accidents: 4
Pedestrians involved in fatal accidents: 0
Fatal accident statistics in 2013:
Fatal accident count: 1
Vehicles involved in fatal accidents: 1
Fatal accidents caused by drunken drivers: 0
Fatalities: 1
Persons involved in fatal accidents: 1
Pedestrians involved in fatal accidents: 1
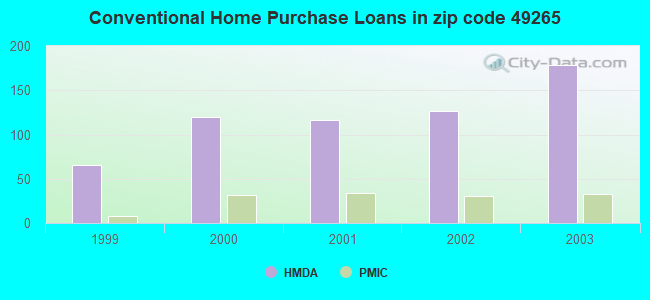
Home Mortgage Disclosure Act Aggregated Statistics For Year 2003 (Based on 4 partial tracts)
A) FHA, FSA/RHS & VA Home Purchase Loans
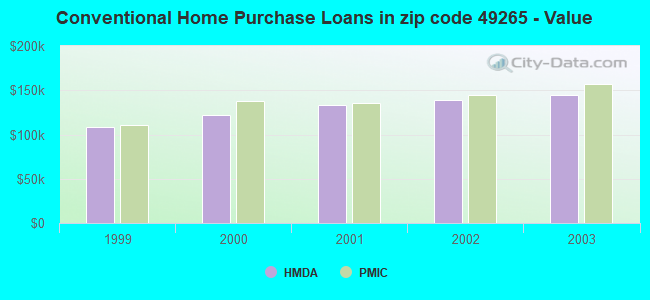
B) Conventional Home Purchase Loans
C) Refinancings
D) Home Improvement Loans
F) Non-occupant Loans on < 5 Family Dwellings (A B C & D)
Number
Average Value
Number
Average Value
Number
Average Value
Number
Average Value
Number
Average Value
LOANS ORIGINATED
11
$135,325
178
$145,002
738
$139,486
24
$38,535
99
$150,254
APPLICATIONS APPROVED, NOT ACCEPTED
0
$0
18
$129,183
66
$147,638
8
$36,144
4
$150,185
APPLICATIONS DENIED
1
$153,960
24
$92,589
220
$136,691
25
$45,071
10
$94,326
APPLICATIONS WITHDRAWN
1
$90,550
13
$169,188
78
$134,809
2
$122,885
6
$109,920
FILES CLOSED FOR INCOMPLETENESS
5
$131,462
2
$174,570
21
$151,940
1
$62,580
1
$132,520
Aggregated Statistics For Year 2002 (Based on 4 partial tracts)
A) FHA, FSA/RHS & VA Home Purchase Loans
B) Conventional Home Purchase Loans
C) Refinancings
D) Home Improvement Loans
F) Non-occupant Loans on < 5 Family Dwellings (A B C & D)
Number
Average Value
Number
Average Value
Number
Average Value
Number
Average Value
Number
Average Value
LOANS ORIGINATED
14
$135,568
127
$139,204
642
$129,925
25
$40,626
63
$130,469
APPLICATIONS APPROVED, NOT ACCEPTED
2
$119,635
12
$126,277
54
$120,522
12
$31,627
8
$85,969
APPLICATIONS DENIED
2
$150,785
20
$75,530
132
$142,779
16
$30,730
7
$120,137
APPLICATIONS WITHDRAWN
1
$160,340
16
$132,415
50
$120,605
2
$32,705
2
$235,585
FILES CLOSED FOR INCOMPLETENESS
1
$125,330
3
$162,993
55
$149,545
0
$0
1
$200,980
Aggregated Statistics For Year 2001 (Based on 4 partial tracts)
A) FHA, FSA/RHS & VA Home Purchase Loans
B) Conventional Home Purchase Loans
C) Refinancings
D) Home Improvement Loans
F) Non-occupant Loans on < 5 Family Dwellings (A B C & D)
Number
Average Value
Number
Average Value
Number
Average Value
Number
Average Value
Number
Average Value
LOANS ORIGINATED
13
$137,516
116
$133,705
478
$128,996
49
$34,594
43
$143,524
APPLICATIONS APPROVED, NOT ACCEPTED
0
$0
21
$90,323
40
$127,347
9
$20,368
3
$69,397
APPLICATIONS DENIED
4
$119,950
42
$66,356
129
$120,832
16
$20,254
7
$142,191
APPLICATIONS WITHDRAWN
0
$0
10
$208,706
66
$122,523
6
$35,920
3
$165,153
FILES CLOSED FOR INCOMPLETENESS
0
$0
2
$109,485
20
$135,742
1
$7,360
1
$108,960
Aggregated Statistics For Year 2000 (Based on 4 partial tracts)
A) FHA, FSA/RHS & VA Home Purchase Loans
B) Conventional Home Purchase Loans
C) Refinancings
D) Home Improvement Loans
F) Non-occupant Loans on < 5 Family Dwellings (A B C & D)
Number
Average Value
Number
Average Value
Number
Average Value
Number
Average Value
Number
Average Value
LOANS ORIGINATED
16
$113,766
120
$122,561
130
$109,193
36
$31,294
21
$130,943
APPLICATIONS APPROVED, NOT ACCEPTED
1
$105,770
17
$108,079
27
$113,113
15
$18,027
1
$175,950
APPLICATIONS DENIED
1
$159,020
42
$81,105
73
$107,359
17
$20,619
3
$51,687
APPLICATIONS WITHDRAWN
2
$92,395
9
$88,923
43
$100,215
7
$47,306
1
$55,400
FILES CLOSED FOR INCOMPLETENESS
0
$0
5
$149,154
12
$139,075
0
$0
1
$353,380
Aggregated Statistics For Year 1999 (Based on 2 partial tracts)
A) FHA, FSA/RHS & VA Home Purchase Loans
B) Conventional Home Purchase Loans
C) Refinancings
D) Home Improvement Loans
F) Non-occupant Loans on < 5 Family Dwellings (A B C & D)
Detailed PMIC statistics for the following Tracts:0603.00
, 0605.00
2002 - 2018 National Fire Incident Reporting System (NFIRS) incidents
According to the data from the years 2002 - 2018 the average number of fires per year is 47. The highest number of fire incidents - 73 took place in 2010, and the least - 11 in 2018. The data has a dropping trend.
When looking into fire subcategories, the most incidents belonged to: Outside Fires (47.7%), and Structure Fires (37.9%).
Fire incident types reported to NFIRS in Zip Code 49265


 Nearest zip codes: 49230, 49287, 49253, 49235, 49221, 49263.


 According to the data from the years 2002 - 2018 the average number of fires per year is 47. The highest number of fire incidents - 73 took place in 2010, and the least - 11 in 2018. The data has a dropping trend.
 When looking into fire subcategories, the most incidents belonged to: Outside Fires (47.7%), and Structure Fires (37.9%).