Estimated zip code population in 2022: 1,176 Zip code population in 2010: 1,059 Zip code population in 2000: 1,200
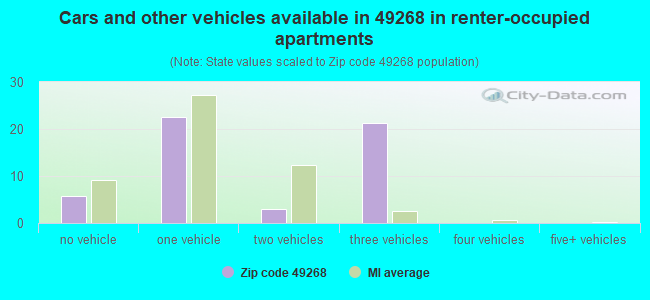
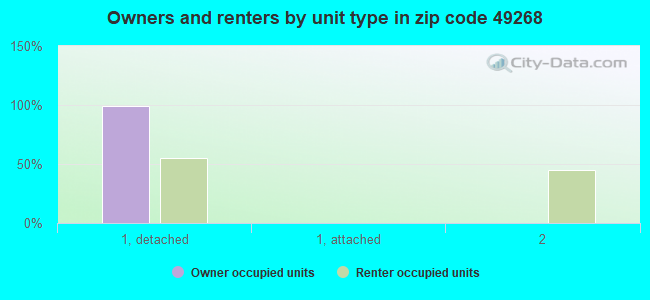
Houses and condos: 518 Renter-occupied apartments: 52
% of renters here:
11%
State:
27%
March 2022 cost of living index in zip code 49268: 86.8 (less than average, U.S. average is 100)
Land area: 21.6 sq. mi. Water area: 0.1 sq. mi.
Population density: 54 people per square mile
(very low).
OSM Map
General Map
Google Map
MSN Map
OSM Map
General Map
Google Map
MSN Map
OSM Map
General Map
Google Map
MSN Map
OSM Map
General Map
Google Map
MSN Map
Please wait while loading the map...
Real estate property taxes paid for housing units in 2022:
This zip code:
1.4% ($2,129)
Michigan:
1.2% ($2,746)
Median real estate property taxes paid for housing units with mortgages in 2022: $2,291 (1.4%) Median real estate property taxes paid for housing units with no mortgage in 2022: $1,824 (1.3%)
Business Search- 14 Million verified businesses
Males: 591
(50.3%)
Females: 584
(49.7%)
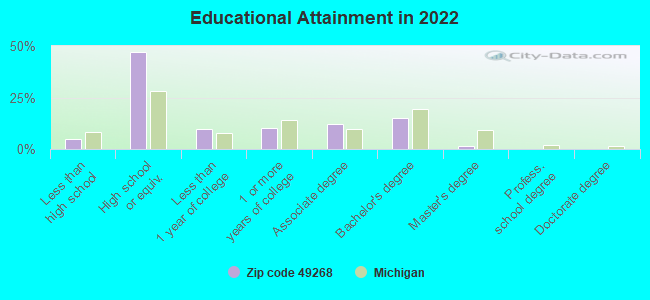
For population 25 years and over in 49268:
High school or higher: 94.4%
Bachelor's degree or higher: 16.2%
Graduate or professional degree: 1.4%
Unemployed: 3.6%
Mean travel time to work (commute): 22.7 minutes
For population 15 years and over in 49268:
Never married: 20.5%
Now married: 63.2%
Separated: 0.0%
Widowed: 5.2%
Divorced: 11.2%
Zip code 49268 compared to state average:
Black race population percentage significantly below state average.
Hispanic race population percentage below state average.
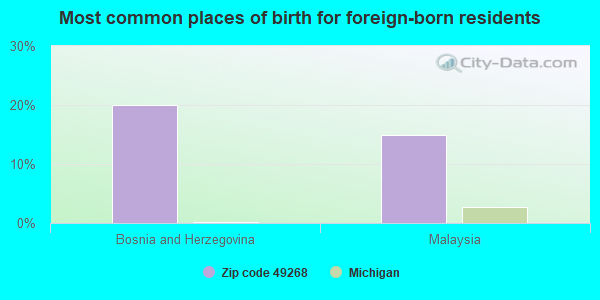
Foreign-born population percentage significantly below state average.
Renting percentage significantly below state average.
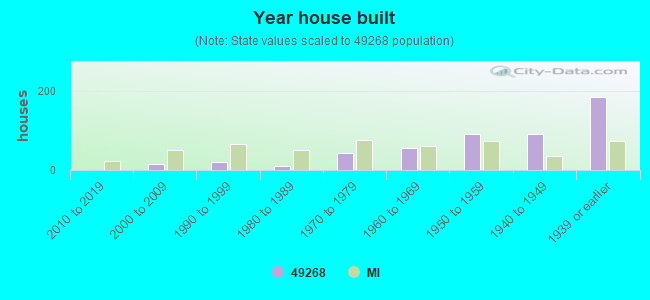
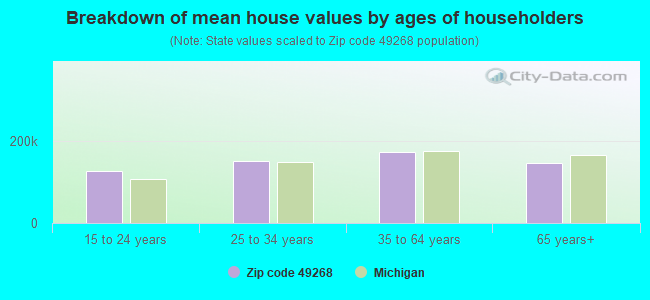
House age above state average.
Number of college students below state average.
Percentage of population with a bachelor's degree or higher below state average.
Averages for the 2020 tax year for zip code 49268, filed in 2021:
Average Adjusted Gross Income (AGI) in 2020: $56,794 (Individual Income Tax Returns)
Here:
$56,794
State:
$68,945
Salary/wage: $47,157 (reported on 82.4% of returns)
Here:
$47,157
State:
$57,142
(% of AGI for various income ranges: 989.1% for AGIs below $25k, 3408.2% for AGIs $25k-50k, 6810.0% for AGIs $50k-75k, 8757.5% for AGIs $75k-100k, 18450.0% for AGIs $100k-200k)
Taxable interest for individuals: $473 (reported on 21.6% of returns)
This zip code:
$473
Michigan:
$1,630
(% of AGI for various income ranges: 9.1% for AGIs below $25k, 1.8% for AGIs $25k-50k, 30.0% for AGIs $50k-75k, 55.0% for AGIs $100k-200k)
Ordinary dividends: $1,350 (reported on 11.8% of returns)
Here:
$1,350
State:
$6,972
(% of AGI for various income ranges: 17.3% for AGIs $25k-50k, 155.0% for AGIs $100k-200k)
Net capital gain/loss in AGI: +$6,300 (reported on 9.8% of returns)
Here:
+$6,300
State:
+$20,064
(% of AGI for various income ranges: 42.7% for AGIs $25k-50k, 670.0% for AGIs $100k-200k)
Profit/loss from business: +$4,443 (reported on 13.7% of returns)
Here:
+$4,443
State:
+$11,172
(% of AGI for various income ranges: 263.6% for AGIs below $25k, 35.0% for AGIs $50k-75k)
Taxable individual retirement arrangement distribution: $9,475 (reported on 7.8% of returns)
49268:
$9,475
Michigan:
$19,803
(% of AGI for various income ranges: 344.5% for AGIs $25k-50k)
Earned income credit: $2,200 (reported on 13.7% of returns)
Here:
$2,200
State:
$2,251
(% of AGI for various income ranges: 76.4% for AGIs below $25k, 63.6% for AGIs $25k-50k)
Percentage of individuals using paid preparers for their 2020 taxes: 96.1%
Here:
96%
State:
93%
(% for various income ranges: 100.0% for AGIs below $25k, 92.9% for AGIs $25k-50k, 88.9% for AGIs $50k-75k, 100.0% for AGIs $75k-100k, 100.0% for AGIs $100k-200k)
Averages for the 2012 tax year for zip code 49268, filed in 2013:
Average Adjusted Gross Income (AGI) in 2012: $42,860 (Individual Income Tax Returns)
Here:
$42,860
State:
$55,609
Salary/wage: $39,964 (reported on 84.6% of returns)
Here:
$39,964
State:
$46,782
(% of AGI for various income ranges: 64.7% for AGIs below $25k, 76.2% for AGIs $25k-50k, 80.1% for AGIs $50k-75k, 80.4% for AGIs $75k-100k, 85.5% for AGIs $100k-200k)
Taxable interest for individuals: $869 (reported on 25.0% of returns)
This zip code:
$869
Michigan:
$1,491
(% of AGI for various income ranges: 1.2% for AGIs below $25k, 0.3% for AGIs $25k-50k, 0.3% for AGIs $50k-75k, 1.0% for AGIs $75k-100k)
Ordinary dividends: $1,400 (reported on 15.4% of returns)
Here:
$1,400
State:
$6,225
(% of AGI for various income ranges: 1.3% for AGIs below $25k, 0.2% for AGIs $25k-50k, 1.5% for AGIs $75k-100k)
Profit/loss from business: +$5,550 (reported on 15.4% of returns)
Here:
+$5,550
State:
+$11,523
(% of AGI for various income ranges: 6.9% for AGIs below $25k, 5.1% for AGIs $25k-50k, 0.8% for AGIs $75k-100k)
Taxable individual retirement arrangement distribution: $8,960 (reported on 9.6% of returns)
49268:
$8,960
Michigan:
$15,298
Total itemized deductions: $15,733 (21% of AGI, reported on 23.1% of returns)
Here:
$15,733
State:
$21,628
Here:
21.2% of AGI
State:
18.4% of AGI
(% of AGI for various income ranges: 15.9% for AGIs below $25k, 8.3% for AGIs $50k-75k, 10.4% for AGIs $75k-100k, 10.5% for AGIs $100k-200k)
Charity contributions: $2,600 (reported on 17.3% of returns)
Here:
$2,600
State:
$4,225
(% of AGI for various income ranges: 1.6% for AGIs $50k-75k, 1.7% for AGIs $75k-100k, 1.3% for AGIs $100k-200k)
Taxes paid: $5,858 (reported on 23.1% of returns)
49268:
$5,858
State:
$8,327
(% of AGI for various income ranges: 4.0% for AGIs below $25k, 2.7% for AGIs $50k-75k, 3.2% for AGIs $75k-100k, 5.8% for AGIs $100k-200k)
Earned income credit: $2,089 (reported on 17.3% of returns)
Here:
$2,089
State:
$2,306
(% of AGI for various income ranges: 5.0% for AGIs below $25k, 1.4% for AGIs $25k-50k)
Percentage of individuals using paid preparers for their 2012 taxes: 67.3%
Here:
67%
State:
57%
(% for various income ranges: 66.7% for AGIs below $25k, 61.5% for AGIs $25k-50k, 75.0% for AGIs $50k-75k, 66.7% for AGIs $75k-100k, 75.0% for AGIs $100k-200k)
Averages for the 2004 tax year for zip code 49268, filed in 2005:
Average Adjusted Gross Income (AGI) in 2004: $37,996 (Individual Income Tax Returns)
Here:
$37,996
State:
$48,204
Salary/wage: $36,601 (reported on 84.9% of returns)
Here:
$36,601
State:
$42,791
(% of AGI for various income ranges: 131.5% for AGIs below $10k, 67.8% for AGIs $10k-25k, 83.0% for AGIs $25k-50k, 85.4% for AGIs $50k-75k, 86.0% for AGIs $75k-100k, 68.8% for AGIs over 100k)
Taxable interest for individuals: $924 (reported on 41.7% of returns)
This zip code:
$924
Michigan:
$1,725
(% of AGI for various income ranges: 9.6% for AGIs below $10k, 3.2% for AGIs $10k-25k, 0.6% for AGIs $25k-50k, 1.1% for AGIs $50k-75k, 0.2% for AGIs $75k-100k, 0.3% for AGIs over 100k)
Taxable dividends: $639 (reported on 20.2% of returns)
Here:
$639
State:
$3,420
(% of AGI for various income ranges: 3.8% for AGIs below $10k, 0.7% for AGIs $10k-25k, 0.4% for AGIs $25k-50k, 0.1% for AGIs $50k-75k, 0.1% for AGIs $75k-100k, 0.3% for AGIs over 100k)
Net capital gain/loss: +$681 (reported on 12.9% of returns)
Here:
+$681
State:
+$8,532
(% of AGI for various income ranges: 1.8% for AGIs below $10k, 0.2% for AGIs $25k-50k, 0.6% for AGIs $50k-75k, 0.0% for AGIs $75k-100k)
Profit/loss from business: +$5,719 (reported on 12.0% of returns)
Here:
+$5,719
State:
+$9,547
(% of AGI for various income ranges: -0.5% for AGIs below $10k, 8.0% for AGIs $10k-25k, 0.6% for AGIs $25k-50k, 1.0% for AGIs $50k-75k, 3.0% for AGIs $75k-100k)
Total itemized deductions: $13,296 (22% of AGI, reported on 29.7% of returns)
Here:
$13,296
State:
$18,509
Here:
21.9% of AGI
State:
20.7% of AGI
(% of AGI for various income ranges: 16.2% for AGIs $10k-25k, 9.4% for AGIs $25k-50k, 10.7% for AGIs $50k-75k, 10.5% for AGIs $75k-100k, 9.2% for AGIs over 100k)
Charity contributions deductions: $2,240 (4% of AGI, reported on 24.1% of returns)
Here:
$2,240
State:
$3,365
Here:
3.5% of AGI
State:
3.6% of AGI
(% of AGI for various income ranges: 2.1% for AGIs $10k-25k, 1.2% for AGIs $25k-50k, 1.4% for AGIs $50k-75k, 1.0% for AGIs $75k-100k, 2.3% for AGIs over 100k)
Total tax: $4,898 (reported on 71.6% of returns)
49268:
$4,898
State:
$7,691
(% of AGI for various income ranges: 2.3% for AGIs below $10k, 4.6% for AGIs $10k-25k, 6.7% for AGIs $25k-50k, 7.5% for AGIs $50k-75k, 11.1% for AGIs $75k-100k, 17.6% for AGIs over 100k)
Earned income credit: $1,421 (reported on 14.2% of returns)
Here:
$1,421
State:
$1,737
Percentage of individuals using paid preparers for their 2004 taxes: 72.1%
Here:
72%
State:
60%
(% for various income ranges: 68.6% for AGIs below $10k, 70.9% for AGIs $10k-25k, 72.9% for AGIs $25k-50k, 72.9% for AGIs $50k-75k, 75.5% for AGIs $75k-100k, 81.8% for AGIs over 100k)
Household received Food Stamps/SNAP in the past 12 months: 49 Household did not receive Food Stamps/SNAP in the past 12 months: 433
Women who had a birth in the past 12 months: 16 (16 now married, 0 unmarried) Women who did not have a birth in the past 12 months: 175 (75 now married, 100 unmarried)
Housing units in zip code 49268 with a mortgage: 254 (18 second mortgage, 14 both second mortgage and home equity loan) Median monthly owner costs for units with a mortgage: $1,176 Median monthly owner costs for units without a mortgage: $527
Residents with income below the poverty level in 2022:
This zip code:
16.0%
Whole state:
13.4%
Residents with income below 50% of the poverty level in 2022:
This zip code:
7.3%
Whole state:
6.9%
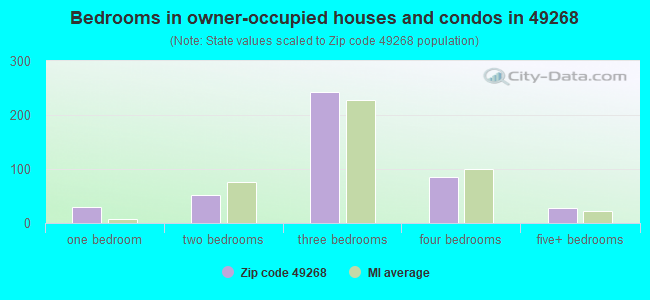
Median number of rooms in houses and condos:
Here:
6.0
State:
6.5
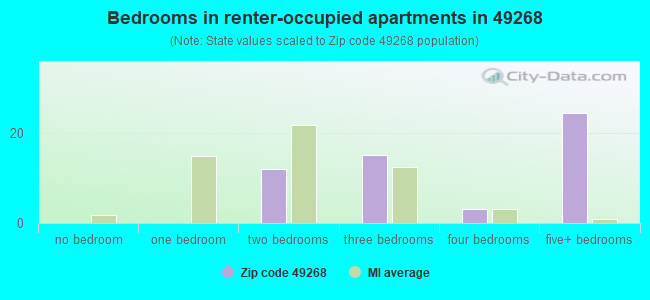
Median number of rooms in apartments:
Here:
7.2
State:
4.3
Notable locations in this zip code not listed on our city pages
Notable locations in zip code 49268: Lenawee Junction Station (A), Palmyra Station (B), Palmyra Township Fire Department (C). Display/hide their locations on the map
Size of family households: 160 2-persons, 90 3-persons, 43 4-persons, 29 5-persons, 10 6-persons, 8 7-or-more-persons
Size of nonfamily households: 130 1-person, 9 2-persons
186 married couples with children.
58 single-parent households (40 men, 18 women).
95.0% of residents of 49268 zip code speak English at home.
1.9% of residents speak Spanish at home (90% very well, 10% well).
0.9% of residents speak other Indo-European language at home (50% very well, 50% not well).
1.6% of residents speak Asian or Pacific Island language at home (100% very well).
0.2% of residents speak other language at home (100% very well).
Foreign born population: 20 (1.7%) (100.0% of them are naturalized citizens)
This zip code:
1.7%
Whole state:
6.9%
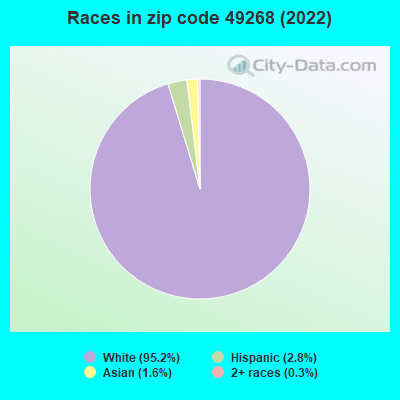
20%Bosnia and Herzegovina
15%Malaysia
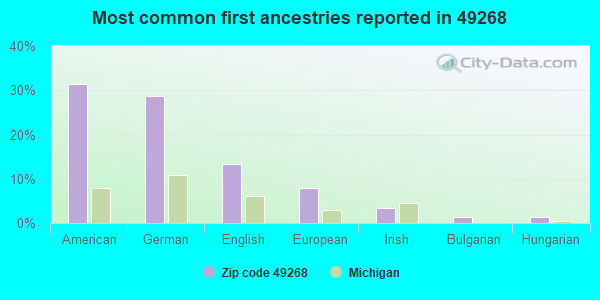
31%American
29%German
13%English
8%European
3%Irish
1%Bulgarian
1%Hungarian
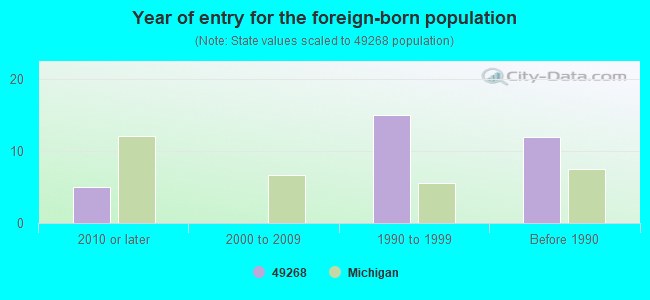
Year of entry for the foreign-born population
52010 or later
02000 to 2009
151990 to 1999
12Before 1990
Facilities with environmental interests located in this zip code:
MI DEPT/TRANSPORTATION BRIDGE B02-46062 (US-223 OVER RAISIN RIVER in PALMYRA, MI)
(Resource Conservation and Recovery Act (tracking hazardous waste)) Organizations: MICH DEPT OF TRANSPORTATION (CONTACT/OWNER)
Alternative names: MIDOT BRIDGE US-223 OVER RAISIN RIVER
Housing units lacking complete plumbing facilities: 2.8% Housing units lacking complete kitchen facilities: 2.8%
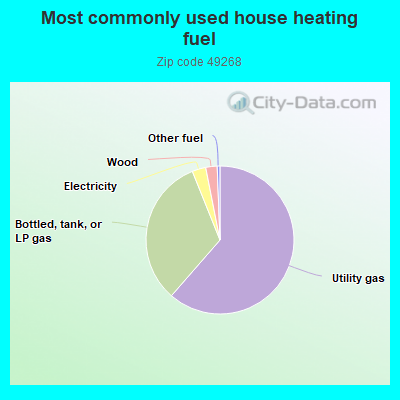
61.6%Utility gas
32.6%Bottled, tank, or LP gas
3.0%Electricity
2.5%Wood
0.6%Other fuel
Population in 1990: 2,289.
Place of birth for U.S.-born residents:
This state: 836
Northeast: 14
Midwest: 185
South: 46
West: 61
72% of the 49268 zip code residents lived in the same house 5 years ago. Out of people who lived in different houses, 74% lived in this county. Out of people who lived in different counties, 50% lived in Michigan.
95% of the 49268 zip code residents lived in the same house 1 year ago. Out of people who lived in different houses, 44% moved from this county. Out of people who lived in different houses, 10% moved from different county within same state. Out of people who lived in different houses, 54% moved from different state.
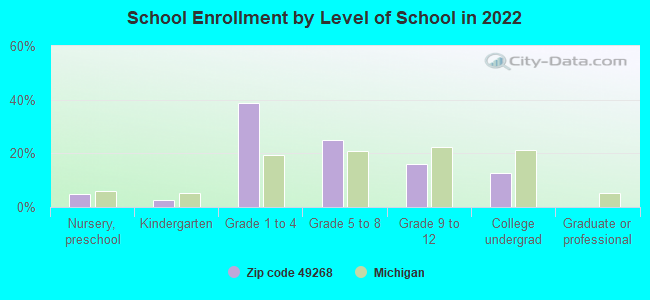
Private vs. public school enrollment:
Students in private schools in grades 1 to 8 (elementary and middle school): 3
Here:
2.5%
Michigan:
12.4%
Students in private schools in grades 9 to 12 (high school): 2
Here:
6.2%
Michigan:
9.8%
Students in private undergraduate colleges: 2
Here:
10.2%
Michigan:
14.9%
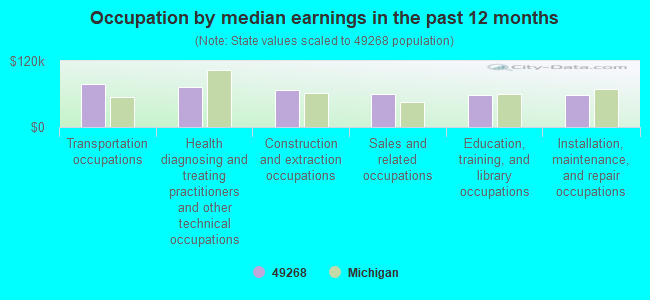
Occupation by median earnings in the past 12 months ($)
78,449Transportation occupations
72,436Health diagnosing and treating practitioners and other technical occupations
68,097Construction and extraction occupations
59,580Sales and related occupations
58,677Education, training, and library occupations
57,318Installation, maintenance, and repair occupations
Top industries in this zip code by the number of employees in 2005:
Construction: Commercial and Institutional Building Construction (10-19 employees: 1 establishment)
Administrative and Support and Waste Management and Remediation Services: Landscaping Services (5-9: 1)
Construction: Plumbing, Heating, and Air-Conditioning Contractors (1-4: 2)
Construction: Roofing Contractors (1-4: 2)
Professional, Scientific, and Technical Services: Tax Preparation Services (1-4: 1)
Finance and Insurance: Insurance Agencies and Brokerages (1-4: 1)
Professional, Scientific, and Technical Services: Administrative Management and General Management Consulting Services (1-4: 1)
Other Services (except Public Administration): Religious Organizations (1-4: 1)
People in group quarters in 2000:
166 people in agriculture workers' dormitories on farms
Fatal accident statistics in 2014:
Fatal accident count: 1
Vehicles involved in fatal accidents: 1
Fatal accidents caused by drunken drivers: 1
Fatalities: 1
Persons involved in fatal accidents: 1
Pedestrians involved in fatal accidents: 0
Fatal accident statistics in 2013:
Fatal accident count: 1
Vehicles involved in fatal accidents: 2
Fatal accidents caused by drunken drivers: 0
Fatalities: 1
Persons involved in fatal accidents: 2
Pedestrians involved in fatal accidents: 0
Home Mortgage Disclosure Act Aggregated Statistics For Year 2003 (Based on 2 partial tracts)
A) FHA, FSA/RHS & VA Home Purchase Loans
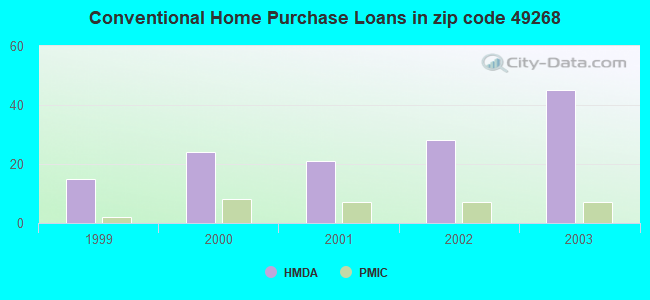
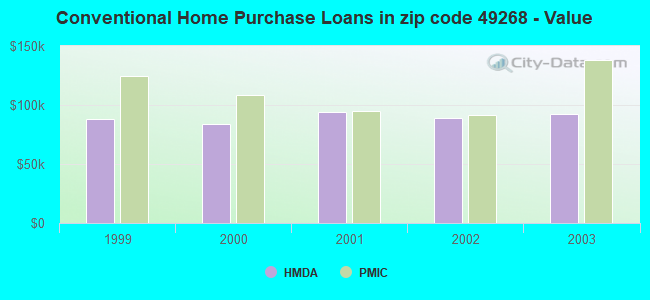
B) Conventional Home Purchase Loans
C) Refinancings
D) Home Improvement Loans
F) Non-occupant Loans on < 5 Family Dwellings (A B C & D)
Number
Average Value
Number
Average Value
Number
Average Value
Number
Average Value
Number
Average Value
LOANS ORIGINATED
5
$99,524
45
$92,170
121
$101,984
12
$25,314
4
$63,238
APPLICATIONS APPROVED, NOT ACCEPTED
1
$134,750
2
$86,285
20
$125,942
0
$0
0
$0
APPLICATIONS DENIED
2
$115,835
4
$80,080
54
$95,392
7
$22,120
1
$70,920
APPLICATIONS WITHDRAWN
1
$159,570
2
$130,610
17
$107,979
1
$30,730
1
$216,310
FILES CLOSED FOR INCOMPLETENESS
0
$0
0
$0
6
$118,003
0
$0
0
$0
Aggregated Statistics For Year 2002 (Based on 2 partial tracts)
A) FHA, FSA/RHS & VA Home Purchase Loans
B) Conventional Home Purchase Loans
C) Refinancings
D) Home Improvement Loans
F) Non-occupant Loans on < 5 Family Dwellings (A B C & D)
Number
Average Value
Number
Average Value
Number
Average Value
Number
Average Value
Number
Average Value
LOANS ORIGINATED
1
$124,110
28
$89,283
111
$101,727
7
$19,587
5
$106,852
APPLICATIONS APPROVED, NOT ACCEPTED
1
$67,370
0
$0
11
$100,255
2
$11,230
1
$85,100
APPLICATIONS DENIED
2
$96,335
1
$74,470
30
$99,721
7
$10,131
0
$0
APPLICATIONS WITHDRAWN
0
$0
1
$85,100
11
$102,726
1
$11,820
1
$56,740
FILES CLOSED FOR INCOMPLETENESS
0
$0
0
$0
13
$83,649
0
$0
0
$0
Aggregated Statistics For Year 2001 (Based on 2 partial tracts)
A) FHA, FSA/RHS & VA Home Purchase Loans
B) Conventional Home Purchase Loans
C) Refinancings
D) Home Improvement Loans
F) Non-occupant Loans on < 5 Family Dwellings (A B C & D)
Number
Average Value
Number
Average Value
Number
Average Value
Number
Average Value
Number
Average Value
LOANS ORIGINATED
7
$96,249
21
$94,053
102
$97,793
21
$34,334
4
$86,285
APPLICATIONS APPROVED, NOT ACCEPTED
0
$0
1
$36,640
6
$63,237
1
$126,470
0
$0
APPLICATIONS DENIED
4
$89,832
11
$92,734
41
$71,497
12
$8,963
1
$67,370
APPLICATIONS WITHDRAWN
1
$79,190
0
$0
15
$99,839
6
$28,565
1
$17,730
FILES CLOSED FOR INCOMPLETENESS
1
$105,200
0
$0
5
$87,704
1
$29,550
0
$0
Aggregated Statistics For Year 2000 (Based on 2 partial tracts)
A) FHA, FSA/RHS & VA Home Purchase Loans
B) Conventional Home Purchase Loans
C) Refinancings
D) Home Improvement Loans
F) Non-occupant Loans on < 5 Family Dwellings (A B C & D)
Number
Average Value
Number
Average Value
Number
Average Value
Number
Average Value
Number
Average Value
LOANS ORIGINATED
2
$13,000
24
$83,479
32
$102,095
18
$15,169
4
$114,358
APPLICATIONS APPROVED, NOT ACCEPTED
1
$102,830
5
$101,416
6
$72,497
1
$17,730
1
$54,370
APPLICATIONS DENIED
2
$89,240
24
$49,841
22
$59,369
9
$15,760
6
$41,173
APPLICATIONS WITHDRAWN
0
$0
6
$74,467
12
$61,366
7
$62,309
0
$0
FILES CLOSED FOR INCOMPLETENESS
0
$0
0
$0
6
$81,755
0
$0
0
$0
Aggregated Statistics For Year 1999 (Based on 1 partial tract)
A) FHA, FSA/RHS & VA Home Purchase Loans
B) Conventional Home Purchase Loans
C) Refinancings
D) Home Improvement Loans
E) Loans on Dwellings For 5+ Families
F) Non-occupant Loans on < 5 Family Dwellings (A B C & D)

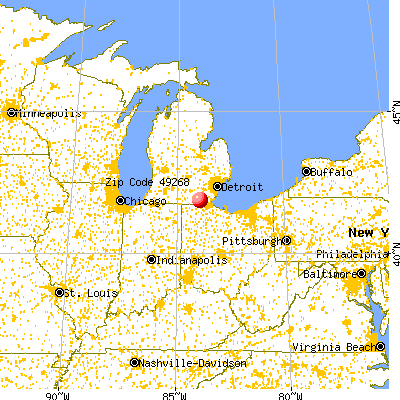


 Nearest zip codes: 49228, 49248, 49221, 49286, 49238, 49229.