Estimated zip code population in 2022: 13,123 Zip code population in 2010: 12,088 Zip code population in 2000: 12,118
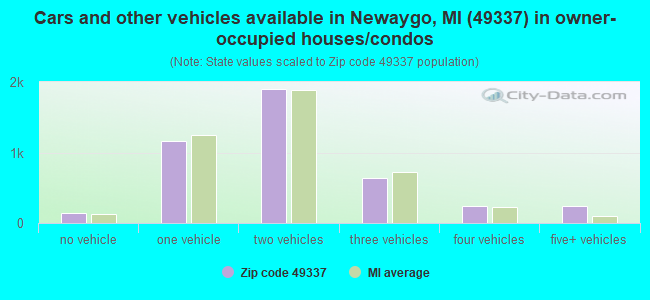
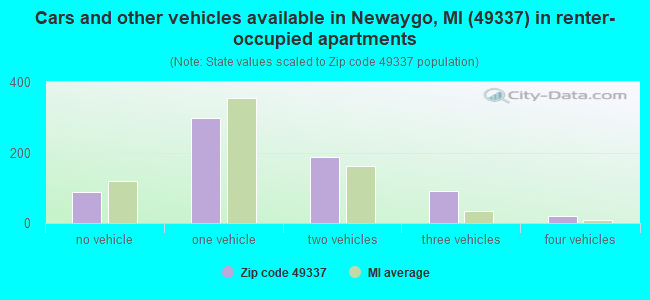
Houses and condos: 6,565 Renter-occupied apartments: 688
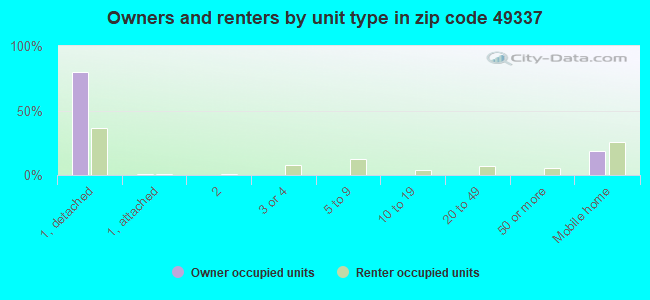
% of renters here:
14%
State:
27%
March 2022 cost of living index in zip code 49337: 81.9 (low, U.S. average is 100)
Land area: 112.2 sq. mi. Water area: 8.5 sq. mi.
Population density: 117 people per square mile
(very low).
OSM Map
General Map
Google Map
MSN Map
OSM Map
General Map
Google Map
MSN Map
OSM Map
General Map
Google Map
MSN Map
OSM Map
General Map
Google Map
MSN Map
Please wait while loading the map...
Real estate property taxes paid for housing units in 2022:
This zip code:
1.0% ($1,913)
Michigan:
1.2% ($2,746)
Median real estate property taxes paid for housing units with mortgages in 2022: $2,007 (1.0%) Median real estate property taxes paid for housing units with no mortgage in 2022: $1,750 (0.9%)
Averages for the 2020 tax year for zip code 49337, filed in 2021:
Average Adjusted Gross Income (AGI) in 2020: $54,517 (Individual Income Tax Returns)
Here:
$54,517
State:
$68,945
Salary/wage: $46,506 (reported on 77.0% of returns)
Here:
$46,506
State:
$57,142
(% of AGI for various income ranges: 1001.7% for AGIs below $25k, 3179.9% for AGIs $25k-50k, 6039.0% for AGIs $50k-75k, 8792.6% for AGIs $75k-100k, 15312.2% for AGIs $100k-200k, 57876.0% for AGIs over 200k)
Taxable interest for individuals: $1,135 (reported on 28.6% of returns)
This zip code:
$1,135
Michigan:
$1,630
(% of AGI for various income ranges: 18.8% for AGIs below $25k, 17.4% for AGIs $25k-50k, 39.3% for AGIs $50k-75k, 56.9% for AGIs $75k-100k, 165.8% for AGIs $100k-200k, 716.0% for AGIs over 200k)
Ordinary dividends: $4,814 (reported on 14.6% of returns)
Here:
$4,814
State:
$6,972
(% of AGI for various income ranges: 21.6% for AGIs below $25k, 26.4% for AGIs $25k-50k, 59.1% for AGIs $50k-75k, 95.9% for AGIs $75k-100k, 278.0% for AGIs $100k-200k, 3642.0% for AGIs over 200k)
Net capital gain/loss in AGI: +$12,436 (reported on 14.0% of returns)
Here:
+$12,436
State:
+$20,064
(% of AGI for various income ranges: 11.8% for AGIs below $25k, 28.6% for AGIs $25k-50k, 90.4% for AGIs $50k-75k, 141.3% for AGIs $75k-100k, 755.2% for AGIs $100k-200k, 12150.0% for AGIs over 200k)
Profit/loss from business: +$13,184 (reported on 12.4% of returns)
Here:
+$13,184
State:
+$11,172
(% of AGI for various income ranges: 109.3% for AGIs below $25k, 154.3% for AGIs $25k-50k, 230.6% for AGIs $50k-75k, 227.7% for AGIs $75k-100k, 730.5% for AGIs $100k-200k, 2154.0% for AGIs over 200k)
Taxable individual retirement arrangement distribution: $20,914 (reported on 11.1% of returns)
49337:
$20,914
Michigan:
$19,803
(% of AGI for various income ranges: 80.2% for AGIs below $25k, 132.8% for AGIs $25k-50k, 278.7% for AGIs $50k-75k, 583.6% for AGIs $75k-100k, 1264.5% for AGIs $100k-200k, 4462.0% for AGIs over 200k)
Total itemized deductions: $34,514 (reported on 3.4% of returns)
Here:
$34,514
State:
$34,117
(% of AGI for various income ranges: 78.8% for AGIs $25k-50k, 88.1% for AGIs $50k-75k, 171.8% for AGIs $75k-100k, 616.8% for AGIs $100k-200k, 4882.0% for AGIs over 200k)
Charity contributions: $14,265 (reported on 2.7% of returns)
Here:
$14,265
State:
$13,548
(% of AGI for various income ranges: 9.3% for AGIs $25k-50k, 26.2% for AGIs $75k-100k, 193.8% for AGIs $100k-200k, 2840.0% for AGIs over 200k)
Taxes paid: $7,895 (reported on 3.4% of returns)
49337:
$7,895
State:
$7,972
(% of AGI for various income ranges: 12.2% for AGIs $25k-50k, 17.8% for AGIs $50k-75k, 43.6% for AGIs $75k-100k, 183.0% for AGIs $100k-200k, 940.0% for AGIs over 200k)
Earned income credit: $2,200 (reported on 15.9% of returns)
Here:
$2,200
State:
$2,251
(% of AGI for various income ranges: 81.4% for AGIs below $25k, 70.2% for AGIs $25k-50k, 3.0% for AGIs $50k-75k)
Percentage of individuals using paid preparers for their 2020 taxes: 94.4%
Here:
94%
State:
93%
(% for various income ranges: 94.0% for AGIs below $25k, 94.1% for AGIs $25k-50k, 94.5% for AGIs $50k-75k, 94.9% for AGIs $75k-100k, 94.3% for AGIs $100k-200k, 100.0% for AGIs over 200k)
Averages for the 2012 tax year for zip code 49337, filed in 2013:
Average Adjusted Gross Income (AGI) in 2012: $41,925 (Individual Income Tax Returns)
Here:
$41,925
State:
$55,609
Salary/wage: $36,560 (reported on 78.6% of returns)
Here:
$36,560
State:
$46,782
(% of AGI for various income ranges: 64.4% for AGIs below $25k, 72.8% for AGIs $25k-50k, 75.5% for AGIs $50k-75k, 72.3% for AGIs $75k-100k, 70.2% for AGIs $100k-200k, 41.5% for AGIs over 200k)
Taxable interest for individuals: $1,114 (reported on 30.6% of returns)
This zip code:
$1,114
Michigan:
$1,491
(% of AGI for various income ranges: 1.7% for AGIs below $25k, 0.7% for AGIs $25k-50k, 0.7% for AGIs $50k-75k, 0.6% for AGIs $75k-100k, 0.8% for AGIs $100k-200k, 0.6% for AGIs over 200k)
Ordinary dividends: $3,325 (reported on 14.6% of returns)
Here:
$3,325
State:
$6,225
(% of AGI for various income ranges: 1.5% for AGIs below $25k, 0.6% for AGIs $25k-50k, 0.7% for AGIs $50k-75k, 0.7% for AGIs $75k-100k, 1.2% for AGIs $100k-200k, 3.1% for AGIs over 200k)
Net capital gain/loss in AGI: +$5,805 (reported on 11.8% of returns)
Here:
+$5,805
State:
+$9,326
(% of AGI for various income ranges: 0.4% for AGIs $25k-50k, 0.2% for AGIs $50k-75k, 0.8% for AGIs $75k-100k, 1.3% for AGIs $100k-200k, 10.9% for AGIs over 200k)
Profit/loss from business: +$7,723 (reported on 14.0% of returns)
Here:
+$7,723
State:
+$11,523
(% of AGI for various income ranges: 6.6% for AGIs below $25k, 3.4% for AGIs $25k-50k, 1.1% for AGIs $50k-75k, 0.9% for AGIs $75k-100k, 3.5% for AGIs $100k-200k)
Taxable individual retirement arrangement distribution: $15,411 (reported on 12.1% of returns)
49337:
$15,411
Michigan:
$15,298
(% of AGI for various income ranges: 5.5% for AGIs below $25k, 3.7% for AGIs $25k-50k, 3.9% for AGIs $50k-75k, 4.6% for AGIs $75k-100k, 7.7% for AGIs $100k-200k)
Total itemized deductions: $18,587 (22% of AGI, reported on 22.8% of returns)
Here:
$18,587
State:
$21,628
Here:
21.9% of AGI
State:
18.4% of AGI
(% of AGI for various income ranges: 8.2% for AGIs below $25k, 7.8% for AGIs $25k-50k, 9.7% for AGIs $50k-75k, 11.3% for AGIs $75k-100k, 13.2% for AGIs $100k-200k, 10.3% for AGIs over 200k)
Charity contributions: $3,836 (reported on 17.3% of returns)
Here:
$3,836
State:
$4,225
(% of AGI for various income ranges: 0.8% for AGIs below $25k, 0.8% for AGIs $25k-50k, 1.3% for AGIs $50k-75k, 1.6% for AGIs $75k-100k, 2.3% for AGIs $100k-200k, 3.3% for AGIs over 200k)
Taxes paid: $6,158 (reported on 22.8% of returns)
49337:
$6,158
State:
$8,327
(% of AGI for various income ranges: 1.7% for AGIs below $25k, 2.0% for AGIs $25k-50k, 2.9% for AGIs $50k-75k, 3.9% for AGIs $75k-100k, 5.2% for AGIs $100k-200k, 4.6% for AGIs over 200k)
Earned income credit: $2,192 (reported on 20.1% of returns)
Here:
$2,192
State:
$2,306
(% of AGI for various income ranges: 6.4% for AGIs below $25k, 1.3% for AGIs $25k-50k)
Percentage of individuals using paid preparers for their 2012 taxes: 58.8%
Here:
59%
State:
57%
(% for various income ranges: 54.9% for AGIs below $25k, 58.5% for AGIs $25k-50k, 63.2% for AGIs $50k-75k, 66.7% for AGIs $75k-100k, 64.7% for AGIs $100k-200k, 83.3% for AGIs over 200k)
Averages for the 2004 tax year for zip code 49337, filed in 2005:
Average Adjusted Gross Income (AGI) in 2004: $36,267 (Individual Income Tax Returns)
Here:
$36,267
State:
$48,204
Salary/wage: $33,584 (reported on 83.5% of returns)
Here:
$33,584
State:
$42,791
(% of AGI for various income ranges: 100.4% for AGIs below $10k, 66.6% for AGIs $10k-25k, 79.0% for AGIs $25k-50k, 81.9% for AGIs $50k-75k, 82.9% for AGIs $75k-100k, 67.5% for AGIs over 100k)
Taxable interest for individuals: $1,362 (reported on 41.9% of returns)
This zip code:
$1,362
Michigan:
$1,725
(% of AGI for various income ranges: 5.6% for AGIs below $10k, 2.5% for AGIs $10k-25k, 1.2% for AGIs $25k-50k, 1.2% for AGIs $50k-75k, 1.1% for AGIs $75k-100k, 2.1% for AGIs over 100k)
Taxable dividends: $2,143 (reported on 17.8% of returns)
Here:
$2,143
State:
$3,420
(% of AGI for various income ranges: 3.6% for AGIs below $10k, 1.4% for AGIs $10k-25k, 0.7% for AGIs $25k-50k, 0.7% for AGIs $50k-75k, 0.4% for AGIs $75k-100k, 2.2% for AGIs over 100k)
Net capital gain/loss: +$6,528 (reported on 13.1% of returns)
Here:
+$6,528
State:
+$8,532
(% of AGI for various income ranges: 3.4% for AGIs below $10k, 0.4% for AGIs $10k-25k, 0.4% for AGIs $25k-50k, 0.6% for AGIs $50k-75k, 1.9% for AGIs $75k-100k, 9.2% for AGIs over 100k)
Profit/loss from business: +$7,157 (reported on 14.0% of returns)
Here:
+$7,157
State:
+$9,547
(% of AGI for various income ranges: 8.7% for AGIs below $10k, 6.6% for AGIs $10k-25k, 2.1% for AGIs $25k-50k, 1.0% for AGIs $50k-75k, 1.2% for AGIs $75k-100k, 4.3% for AGIs over 100k)
IRA payment deduction: $2,844 (reported on 1.8% of returns)
49337:
$2,844
Michigan:
$2,875
(% of AGI for various income ranges: 0.2% for AGIs $10k-25k, 0.2% for AGIs $25k-50k, 0.1% for AGIs $50k-75k, 0.1% for AGIs $75k-100k, 0.1% for AGIs over 100k)
Self-employed pension: $9,059 (reported on 0.3% of returns)
Here:
$9,059
Michigan:
$13,826
Total itemized deductions: $15,351 (24% of AGI, reported on 30.2% of returns)
Here:
$15,351
State:
$18,509
Here:
24.0% of AGI
State:
20.7% of AGI
(% of AGI for various income ranges: 14.1% for AGIs below $10k, 9.0% for AGIs $10k-25k, 11.8% for AGIs $25k-50k, 13.3% for AGIs $50k-75k, 14.2% for AGIs $75k-100k, 14.5% for AGIs over 100k)
Charity contributions deductions: $2,835 (4% of AGI, reported on 23.9% of returns)
Here:
$2,835
State:
$3,365
Here:
4.1% of AGI
State:
3.6% of AGI
(% of AGI for various income ranges: 0.6% for AGIs below $10k, 1.0% for AGIs $10k-25k, 1.3% for AGIs $25k-50k, 1.6% for AGIs $50k-75k, 1.7% for AGIs $75k-100k, 3.9% for AGIs over 100k)
Total tax: $4,458 (reported on 70.1% of returns)
49337:
$4,458
State:
$7,691
(% of AGI for various income ranges: 2.4% for AGIs below $10k, 3.9% for AGIs $10k-25k, 6.0% for AGIs $25k-50k, 8.1% for AGIs $50k-75k, 10.0% for AGIs $75k-100k, 15.6% for AGIs over 100k)
Earned income credit: $1,683 (reported on 17.2% of returns)
Here:
$1,683
State:
$1,737
Percentage of individuals using paid preparers for their 2004 taxes: 60.6%
Here:
61%
State:
60%
(% for various income ranges: 53.6% for AGIs below $10k, 62.4% for AGIs $10k-25k, 61.8% for AGIs $25k-50k, 60.7% for AGIs $50k-75k, 67.3% for AGIs $75k-100k, 71.1% for AGIs over 100k)
Likely homosexual households (counted as self-reported same-sex unmarried-partner households)
Lesbian couples: 0.1% of all households
Gay men: 0.0% of all households
Household received Food Stamps/SNAP in the past 12 months: 881 Household did not receive Food Stamps/SNAP in the past 12 months: 4,124
Women who had a birth in the past 12 months: 85 (49 now married, 34 unmarried) Women who did not have a birth in the past 12 months: 2,295 (941 now married, 1,353 unmarried)
Housing units in zip code 49337 with a mortgage: 2,299 (135 second mortgage, 119 both second mortgage and home equity loan) Houses without a mortgage: 64
Median monthly owner costs for units with a mortgage: $1,206 Median monthly owner costs for units without a mortgage: $484
Residents with income below the poverty level in 2022:
This zip code:
14.7%
Whole state:
13.4%
Residents with income below 50% of the poverty level in 2022:
This zip code:
9.4%
Whole state:
6.9%
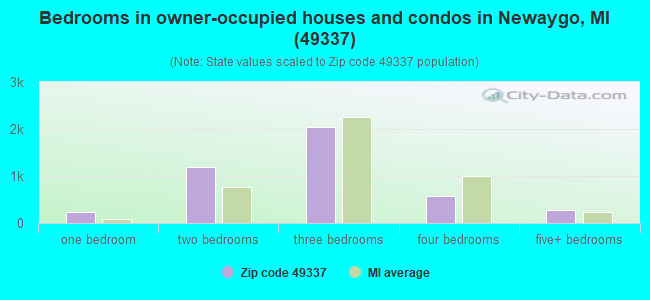
Median number of rooms in houses and condos:
Here:
6.2
State:
6.5
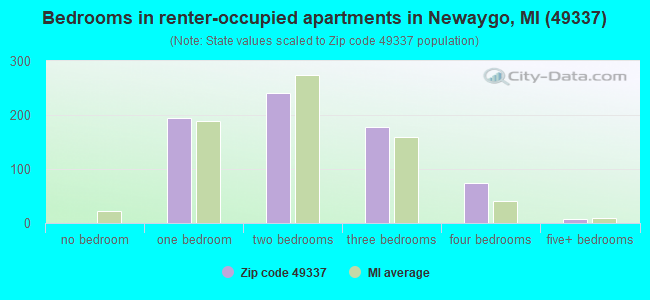
Median number of rooms in apartments:
Here:
4.6
State:
4.3
Notable locations in this zip code not listed on our city pages
Notable locations in zip code 49337: Drew Siding (A), Henry Camp (B), High Rollway Public Access (C), Village Green Golf Club (D), Mystery Creek Campground (E), Newaygo Station (F), Croton Township Campground (G), Newaygo State Park Rustic Campground (H), Ottawa Boy Scott Camp (I), Pine Avenue Public Access (J), Croton Township Fire Department (K), Newaygo Police Department (L), Newaygo Carnegie Library (M), Newaygo County Historical Museum (N), Life Emergency Medical Services Croton Station (O), Newaygo Fire District (P). Display/hide their locations on the map
Churches in zip code 49337 include: Bills Lake Baptist Church (A), River Valley Community Church (B), Saint Mark's Episcopal Church (C), Resurrection Life Church (D), New Community Church of Newaygo (E), Body of Christ Lutheran Church (F), Grace Bible Church (G), Newaygo United Methodist Church (H), First Baptist Church (I). Display/hide their locations on the map
Cemeteries: Croton Cemetery (1), Gulp Cemetery (2), Saint Marks Cemetery (3), Prairie Cemetery (4), Newaygo City Cemetery (5), Saint Mary's Catholic Cemetery (6), Oak Grove Cemetery (7). Display/hide their locations on the map
Lakes, reservoirs, and swamps: Abeys Lake (A), Ackland Lake (B), Bills Lake (C), Brooks Lake (D), Butterfield Lake (E), Cope Lake (F), Emerald Lake (G), John Ford Lake (H). Display/hide their locations on the map
Streams, rivers, and creeks: Brooks Creek (A), Bigelow Creek (B), Tamarack Creek (C), Penoyer Creek (D), Cold Creek (E), Rosy Run (F), Fourmile Creek (G), Little Muskegon River (H). Display/hide their locations on the map
Parks in zip code 49337 include: EH Henning County Park (1), Shaw Park (2), Newaygo County Sports Park (3), Newaygo Experimental Forest (4), Kimble County Park (5), MK Conklin Park (6), Newaygo State Park (7), High Rollway Park (8), Croton Township Park (9). Display/hide their locations on the map
1,322 married couples with children.
901 single-parent households (203 men, 698 women).
97.0% of residents of 49337 zip code speak English at home.
2.1% of residents speak Spanish at home (87% very well, 1% well, 12% not well).
0.6% of residents speak other Indo-European language at home (92% very well, 8% well).
0.1% of residents speak Asian or Pacific Island language at home (100% very well).
Foreign born population: 207 (1.6%) (51.8% of them are naturalized citizens)
This zip code:
1.6%
Whole state:
6.9%
39%El Salvador
21%Honduras
13%France
7%Bhutan
6%Germany
6%Japan
4%Malaysia
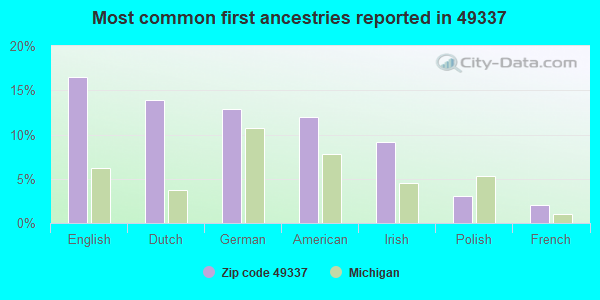
17%English
14%Dutch
13%German
12%American
9%Irish
3%Polish
2%French
Year of entry for the foreign-born population
892010 or later
02000 to 2009
451990 to 1999
148Before 1990
Facilities with environmental interests located in this zip code:
DRIFTWOOD BAR & GRILL (5970 CROTON HARDY DRIVE in NEWAYGO, MI)
(Integrated Compliance Information System) - ICIS-05-2006-4838, ENFORCEMENT/COMPLIANCE ACTIVITY FORMAL ENFORCEMENT ACTION (Integrated Compliance Information System) - ICIS-05-2006-4838, ENFORCEMENT/COMPLIANCE ACTIVITY
B & B ENVIRONMENTAL SERVICES (490 QUARTERLINE AVENUE in NEWAYGO, MI)
(Resource Conservation and Recovery Act (tracking hazardous waste)) Organizations: STEVE BICHLER (CONTACT/OPERATOR)
, BROOKS TOWNSHIP (CONTACT/OWNER)
MI DEPT/TRANSPORTATION BRIDGE B01-62-31 (M-37 OVER MUSKEGON RIVER in NEWAYGO, MI)
(Resource Conservation and Recovery Act (tracking hazardous waste)) Organizations: MICH DEPT OF TRANSPORTATION (CONTACT/OPERATOR)
Alternative names: MIDOT BRIDGE M-37 OVER MUSKEGON RIVER
CHAIN OF LAKES SA WWTP (SW1/4, SW 1/4, SECT. 5, T12N in NEWAYGO, MI)
National Pollutant Discharge Elimination System NON-MAJOR (Tracking pollutant discharge elimination systems) - permit Business SIC classification: SEWERAGE SYSTEMS Organizations: CHAIN OF LAKES SEWER AUTHORITY (CONTACT/OWNER)
ANR PIPELINE CO - CROTON (8415 S. ELM RD in NEWAYGO, MI)
AIR SYNTHETIC MINOR (AIRS/AFS) CRITERIA AND HAZARDOUS AIR POLLUTANT INVENTORY (Inventory of air pollution sources) Business SIC classification: NATURAL GAS TRANSMISSION; NONCLASSIFIABLE ESTABLISHMENTS
B & F PARTY STORE (8000 MASON DR in NEWAYGO, MI)
Conditionally Exempt Small Quantity Generators, less than 100 kg/month of hazardous waste (Resource Conservation and Recovery Act (tracking hazardous waste)) Organizations: KATHY BICE (CONTACT/OWNER)
BODY WORKS (8131 MASON DR in NEWAYGO, MI)
Conditionally Exempt Small Quantity Generators, less than 100 kg/month of hazardous waste (Resource Conservation and Recovery Act (tracking hazardous waste)) - notification Organizations: PIKAART RICK AND BRAAFHART MORRIS (CONTACT/OWNER)
MI DEPT/STATE POLICE (360 ADAMS ST in NEWAYGO, MI)
Conditionally Exempt Small Quantity Generators, less than 100 kg/month of hazardous waste (Resource Conservation and Recovery Act (tracking hazardous waste)) - notification Organizations: MI DEPT/MGMT AND BUDGET MOTOR TRANS DIV (CONTACT/OWNER)
Alternative names: NEWAYGO STATE POLICE POST
FERGUSON COUNTRY STORE (6353 88TH STREET in NEWAYGO, MI)
ENFORCEMENT/COMPLIANCE ACTIVITY (Integrated Compliance Information System)
Housing units lacking complete plumbing facilities: 1.2% Housing units lacking complete kitchen facilities: 1.4%
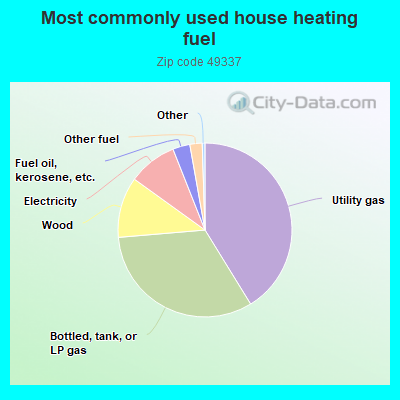
41.3%Utility gas
32.5%Bottled, tank, or LP gas
11.3%Wood
9.1%Electricity
3.2%Fuel oil, kerosene, etc.
2.3%Other fuel
Population in 1990: 8,091. Population change in the 1990s: +4,027 (+49.8%).
Place of birth for U.S.-born residents:
This state: 11,096
Northeast: 183
Midwest: 717
South: 307
West: 540
60% of the 49337 zip code residents lived in the same house 5 years ago. Out of people who lived in different houses, 44% lived in this county. Out of people who lived in different counties, 50% lived in Michigan.
91% of the 49337 zip code residents lived in the same house 1 year ago. Out of people who lived in different houses, 43% moved from this county. Out of people who lived in different houses, 44% moved from different county within same state. Out of people who lived in different houses, 12% moved from different state. Out of people who lived in different houses, 1% moved from abroad.
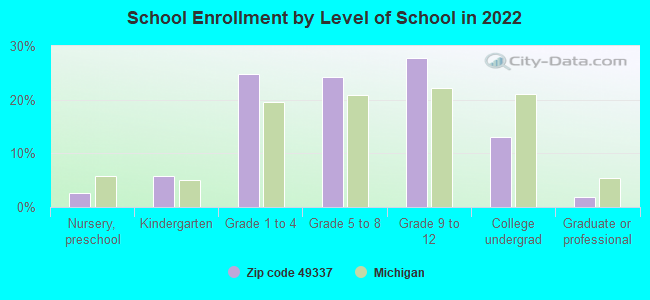
Private vs. public school enrollment:
Students in private schools in grades 1 to 8 (elementary and middle school): 219
Here:
16.3%
Michigan:
12.4%
Students in private schools in grades 9 to 12 (high school): 167
Here:
22.2%
Michigan:
9.8%
Students in private undergraduate colleges: 67
Here:
18.9%
Michigan:
14.9%
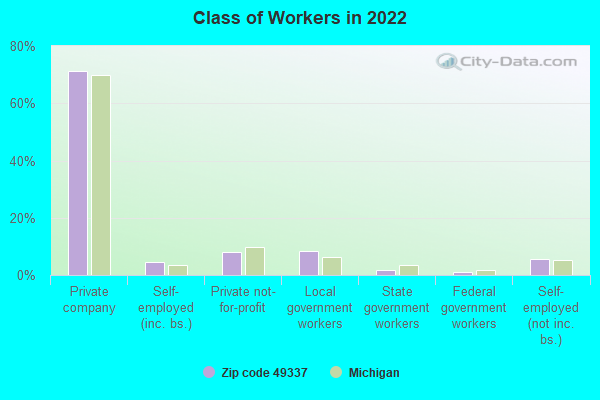
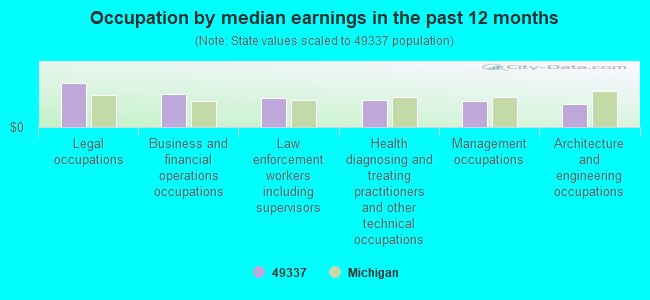
Occupation by median earnings in the past 12 months ($)
100,638Legal occupations
74,506Business and financial operations occupations
67,470Law enforcement workers including supervisors
62,248Health diagnosing and treating practitioners and other technical occupations
59,670Management occupations
53,191Architecture and engineering occupations
Top industries in this zip code by the number of employees in 2005:
2002 - 2018 National Fire Incident Reporting System (NFIRS) incidents
According to the data from the years 2002 - 2018 the average number of fires per year is 55. The highest number of fire incidents - 102 took place in 2003, and the least - 12 in 2016. The data has a rising trend.
When looking into fire subcategories, the most incidents belonged to: Structure Fires (47.8%), and Outside Fires (39.4%).
Fire incident types reported to NFIRS in Zip Code 49337


 Nearest zip codes: 49349, 49327, 49330, 49343, 49329, 49303.


 According to the data from the years 2002 - 2018 the average number of fires per year is 55. The highest number of fire incidents - 102 took place in 2003, and the least - 12 in 2016. The data has a rising trend.
 When looking into fire subcategories, the most incidents belonged to: Structure Fires (47.8%), and Outside Fires (39.4%).