Estimated zip code population in 2022: 3,501 Zip code population in 2010: 3,660 Zip code population in 2000: 3,705
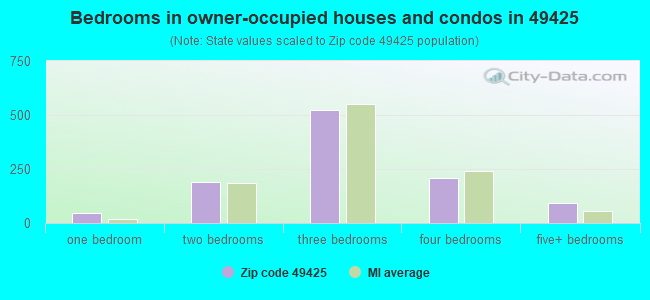
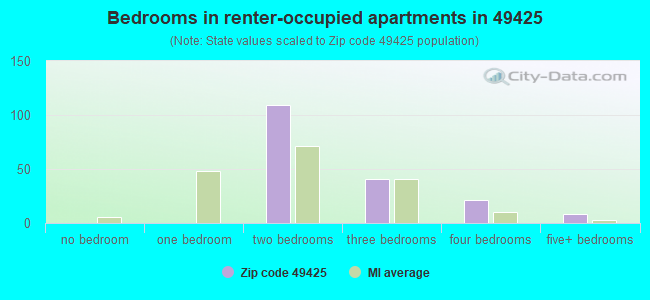
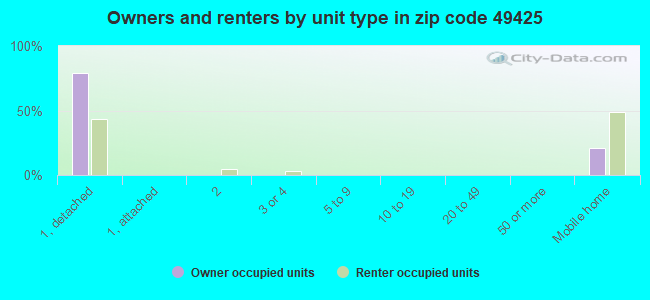
Houses and condos: 1,397 Renter-occupied apartments: 178
% of renters here:
14%
State:
27%
March 2022 cost of living index in zip code 49425: 80.5 (low, U.S. average is 100)
Land area: 62.1 sq. mi. Water area: 2.9 sq. mi.
Population density: 56 people per square mile
(very low).
OSM Map
General Map
Google Map
MSN Map
OSM Map
General Map
Google Map
MSN Map
OSM Map
General Map
Google Map
MSN Map
OSM Map
General Map
Google Map
MSN Map
Please wait while loading the map...
Real estate property taxes paid for housing units in 2022:
This zip code:
1.1% ($1,783)
Michigan:
1.2% ($2,746)
Median real estate property taxes paid for housing units with mortgages in 2022: $1,916 (1.0%) Median real estate property taxes paid for housing units with no mortgage in 2022: $1,483 (1.2%)
Averages for the 2020 tax year for zip code 49425, filed in 2021:
Average Adjusted Gross Income (AGI) in 2020: $49,524 (Individual Income Tax Returns)
Here:
$49,524
State:
$68,945
Salary/wage: $41,013 (reported on 75.8% of returns)
Here:
$41,013
State:
$57,142
(% of AGI for various income ranges: 952.3% for AGIs below $25k, 3301.6% for AGIs $25k-50k, 5742.8% for AGIs $50k-75k, 8403.0% for AGIs $75k-100k, 15692.0% for AGIs $100k-200k)
Taxable interest for individuals: $735 (reported on 23.6% of returns)
This zip code:
$735
Michigan:
$1,630
(% of AGI for various income ranges: 16.2% for AGIs below $25k, 17.5% for AGIs $25k-50k, 11.1% for AGIs $50k-75k, 24.0% for AGIs $75k-100k, 107.0% for AGIs $100k-200k)
Ordinary dividends: $2,057 (reported on 8.9% of returns)
Here:
$2,057
State:
$6,972
(% of AGI for various income ranges: 14.2% for AGIs below $25k, 13.1% for AGIs $25k-50k, 18.9% for AGIs $50k-75k, 32.0% for AGIs $75k-100k, 123.0% for AGIs $100k-200k)
Net capital gain/loss in AGI: +$8,918 (reported on 10.8% of returns)
Here:
+$8,918
State:
+$20,064
(% of AGI for various income ranges: 14.5% for AGIs below $25k, 23.8% for AGIs $25k-50k, 167.2% for AGIs $50k-75k, 179.0% for AGIs $75k-100k, 902.0% for AGIs $100k-200k)
Profit/loss from business: +$14,725 (reported on 12.7% of returns)
Here:
+$14,725
State:
+$11,172
(% of AGI for various income ranges: 81.8% for AGIs below $25k, 346.9% for AGIs $25k-50k, 211.1% for AGIs $50k-75k, 113.0% for AGIs $75k-100k, 1015.0% for AGIs $100k-200k)
Taxable individual retirement arrangement distribution: $13,493 (reported on 8.9% of returns)
49425:
$13,493
Michigan:
$19,803
(% of AGI for various income ranges: 68.8% for AGIs below $25k, 98.8% for AGIs $25k-50k, 223.9% for AGIs $50k-75k, 895.0% for AGIs $75k-100k)
Earned income credit: $2,328 (reported on 18.5% of returns)
Here:
$2,328
State:
$2,251
(% of AGI for various income ranges: 103.0% for AGIs below $25k, 82.2% for AGIs $25k-50k)
Percentage of individuals using paid preparers for their 2020 taxes: 93.6%
Here:
94%
State:
93%
(% for various income ranges: 93.1% for AGIs below $25k, 92.9% for AGIs $25k-50k, 96.0% for AGIs $50k-75k, 92.9% for AGIs $75k-100k, 93.8% for AGIs $100k-200k, 100.0% for AGIs over 200k)
Averages for the 2012 tax year for zip code 49425, filed in 2013:
Average Adjusted Gross Income (AGI) in 2012: $38,391 (Individual Income Tax Returns)
Here:
$38,391
State:
$55,609
Salary/wage: $35,243 (reported on 77.9% of returns)
Here:
$35,243
State:
$46,782
(% of AGI for various income ranges: 62.9% for AGIs below $25k, 75.1% for AGIs $25k-50k, 74.7% for AGIs $50k-75k, 78.7% for AGIs $75k-100k, 63.5% for AGIs $100k-200k)
Taxable interest for individuals: $951 (reported on 25.5% of returns)
This zip code:
$951
Michigan:
$1,491
(% of AGI for various income ranges: 1.3% for AGIs below $25k, 0.3% for AGIs $25k-50k, 0.4% for AGIs $50k-75k, 0.4% for AGIs $75k-100k, 1.1% for AGIs $100k-200k)
Ordinary dividends: $1,880 (reported on 10.3% of returns)
Here:
$1,880
State:
$6,225
(% of AGI for various income ranges: 0.7% for AGIs below $25k, 0.7% for AGIs $25k-50k, 0.4% for AGIs $50k-75k, 0.7% for AGIs $75k-100k)
Net capital gain/loss in AGI: +$3,164 (reported on 9.7% of returns)
Here:
+$3,164
State:
+$9,326
(% of AGI for various income ranges: 0.6% for AGIs below $25k, 1.0% for AGIs $25k-50k, 0.5% for AGIs $50k-75k, 2.0% for AGIs $75k-100k)
Profit/loss from business: +$10,242 (reported on 13.1% of returns)
Here:
+$10,242
State:
+$11,523
(% of AGI for various income ranges: 7.6% for AGIs below $25k, 6.9% for AGIs $25k-50k, 3.5% for AGIs $75k-100k)
Taxable individual retirement arrangement distribution: $12,075 (reported on 11.0% of returns)
49425:
$12,075
Michigan:
$15,298
(% of AGI for various income ranges: 5.0% for AGIs below $25k, 2.7% for AGIs $25k-50k, 3.4% for AGIs $50k-75k, 7.6% for AGIs $75k-100k)
Total itemized deductions: $15,711 (23% of AGI, reported on 19.3% of returns)
Here:
$15,711
State:
$21,628
Here:
22.8% of AGI
State:
18.4% of AGI
(% of AGI for various income ranges: 5.9% for AGIs below $25k, 6.4% for AGIs $25k-50k, 7.4% for AGIs $50k-75k, 9.2% for AGIs $75k-100k, 10.6% for AGIs $100k-200k)
Charity contributions: $3,161 (reported on 12.4% of returns)
Here:
$3,161
State:
$4,225
(% of AGI for various income ranges: 0.6% for AGIs below $25k, 0.8% for AGIs $25k-50k, 0.7% for AGIs $50k-75k, 1.4% for AGIs $75k-100k, 1.5% for AGIs $100k-200k)
Taxes paid: $5,068 (reported on 19.3% of returns)
49425:
$5,068
State:
$8,327
(% of AGI for various income ranges: 1.0% for AGIs below $25k, 1.6% for AGIs $25k-50k, 2.4% for AGIs $50k-75k, 2.9% for AGIs $75k-100k, 4.6% for AGIs $100k-200k)
Earned income credit: $2,289 (reported on 24.1% of returns)
Here:
$2,289
State:
$2,306
(% of AGI for various income ranges: 7.3% for AGIs below $25k, 1.6% for AGIs $25k-50k)
Percentage of individuals using paid preparers for their 2012 taxes: 56.6%
Here:
57%
State:
57%
(% for various income ranges: 53.0% for AGIs below $25k, 55.0% for AGIs $25k-50k, 63.2% for AGIs $50k-75k, 63.6% for AGIs $75k-100k, 66.7% for AGIs $100k-200k)
Averages for the 2004 tax year for zip code 49425, filed in 2005:
Average Adjusted Gross Income (AGI) in 2004: $34,857 (Individual Income Tax Returns)
Here:
$34,857
State:
$48,204
Salary/wage: $32,776 (reported on 84.5% of returns)
Here:
$32,776
State:
$42,791
(% of AGI for various income ranges: 91.6% for AGIs below $10k, 71.0% for AGIs $10k-25k, 85.4% for AGIs $25k-50k, 84.4% for AGIs $50k-75k, 82.0% for AGIs $75k-100k, 52.6% for AGIs over 100k)
Taxable interest for individuals: $677 (reported on 37.9% of returns)
This zip code:
$677
Michigan:
$1,725
(% of AGI for various income ranges: 4.5% for AGIs below $10k, 1.8% for AGIs $10k-25k, 0.4% for AGIs $25k-50k, 0.6% for AGIs $50k-75k, 0.4% for AGIs $75k-100k, 0.5% for AGIs over 100k)
Taxable dividends: $1,396 (reported on 12.2% of returns)
Here:
$1,396
State:
$3,420
(% of AGI for various income ranges: 2.0% for AGIs below $10k, 0.9% for AGIs $10k-25k, 0.3% for AGIs $25k-50k, 0.3% for AGIs $50k-75k, 0.1% for AGIs $75k-100k, 1.4% for AGIs over 100k)
Net capital gain/loss: +$3,490 (reported on 10.1% of returns)
Here:
+$3,490
State:
+$8,532
(% of AGI for various income ranges: -0.4% for AGIs below $10k, 0.7% for AGIs $10k-25k, 0.0% for AGIs $25k-50k, 1.4% for AGIs $50k-75k, 2.9% for AGIs $75k-100k)
Profit/loss from business: +$6,350 (reported on 16.1% of returns)
Here:
+$6,350
State:
+$9,547
(% of AGI for various income ranges: 6.0% for AGIs below $10k, 8.8% for AGIs $10k-25k, 4.7% for AGIs $25k-50k, 0.9% for AGIs $50k-75k, 0.4% for AGIs $75k-100k)
IRA payment deduction: $2,154 (reported on 1.7% of returns)
49425:
$2,154
Michigan:
$2,875
Total itemized deductions: $14,487 (23% of AGI, reported on 22.9% of returns)
Here:
$14,487
State:
$18,509
Here:
23.0% of AGI
State:
20.7% of AGI
(% of AGI for various income ranges: 6.4% for AGIs $10k-25k, 7.0% for AGIs $25k-50k, 11.0% for AGIs $50k-75k, 12.2% for AGIs $75k-100k, 13.5% for AGIs over 100k)
Charity contributions deductions: $2,575 (4% of AGI, reported on 17.5% of returns)
Here:
$2,575
State:
$3,365
Here:
3.8% of AGI
State:
3.6% of AGI
(% of AGI for various income ranges: 0.8% for AGIs $10k-25k, 0.8% for AGIs $25k-50k, 1.5% for AGIs $50k-75k, 1.6% for AGIs $75k-100k, 2.3% for AGIs over 100k)
Total tax: $3,862 (reported on 70.2% of returns)
49425:
$3,862
State:
$7,691
(% of AGI for various income ranges: 2.9% for AGIs below $10k, 3.6% for AGIs $10k-25k, 6.0% for AGIs $25k-50k, 7.6% for AGIs $50k-75k, 10.2% for AGIs $75k-100k, 15.6% for AGIs over 100k)
Earned income credit: $1,716 (reported on 19.6% of returns)
Here:
$1,716
State:
$1,737
Percentage of individuals using paid preparers for their 2004 taxes: 58.1%
Here:
58%
State:
60%
(% for various income ranges: 56.3% for AGIs below $10k, 54.3% for AGIs $10k-25k, 60.6% for AGIs $25k-50k, 57.6% for AGIs $50k-75k, 62.7% for AGIs $75k-100k, 78.4% for AGIs over 100k)
Likely homosexual households (counted as self-reported same-sex unmarried-partner households)
Lesbian couples: 0.0% of all households
Gay men: 0.4% of all households
Household received Food Stamps/SNAP in the past 12 months: 202 Household did not receive Food Stamps/SNAP in the past 12 months: 1,027
Women who had a birth in the past 12 months: 69 (60 now married, 10 unmarried) Women who did not have a birth in the past 12 months: 610 (274 now married, 335 unmarried)
Housing units in zip code 49425 with a mortgage: 572 (19 second mortgage, 13 home equity loan, 2 both second mortgage and home equity loan) Median monthly owner costs for units with a mortgage: $1,316 Median monthly owner costs for units without a mortgage: $437
Residents with income below the poverty level in 2022:
This zip code:
14.2%
Whole state:
13.4%
Residents with income below 50% of the poverty level in 2022:
This zip code:
5.1%
Whole state:
6.9%
Median number of rooms in houses and condos:
Here:
6.6
State:
6.5
Median number of rooms in apartments:
Here:
4.4
State:
4.3
Notable locations in this zip code not listed on our city pages
Notable locations in zip code 49425: Oak Knoll Campground (A), Holton Station (B), Diamond Access Canoe Landing (C), Sischo Canoe landing (D), Holton Township Fire Department (E). Display/hide their locations on the map
Churches in zip code 49425 include: Big Blue Lake Chapel (A), Cornerstone Free Methodist Church (B), Holton Family Life Worship Center (C), Holton Lutheran Church (D), Holton United Methodist Church (E). Display/hide their locations on the map
Lakes and swamps: Pine Island Lake (A), Acker Lake (B), Unger Lake (C), Lost Lake (D), Olson Lake (E), Round Lake (F), Galys Lake (G), Big Blue Lake (H). Display/hide their locations on the map
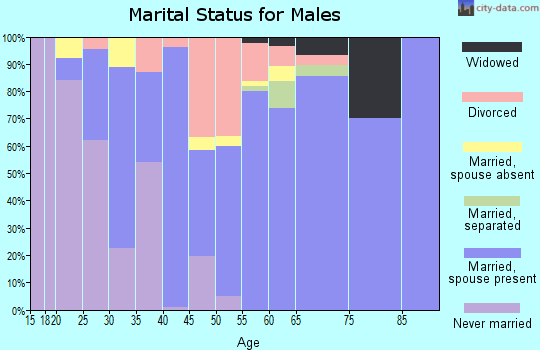
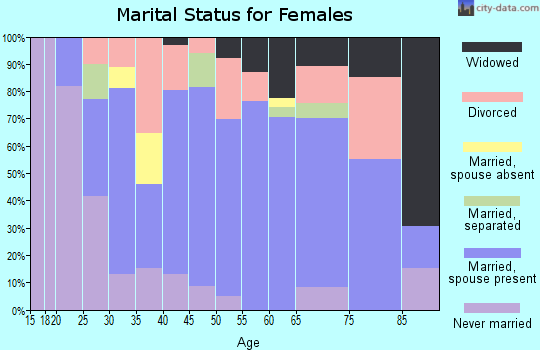
473 married couples with children.
210 single-parent households (86 men, 124 women).
92.6% of residents of 49425 zip code speak English at home.
0.5% of residents speak Spanish at home (100% very well).
6.3% of residents speak other Indo-European language at home (80% very well, 14% well, 2% not well, 3% not at all).
Foreign born population: 0 (0.0%)
:
0.0%
Whole state:
6.9%
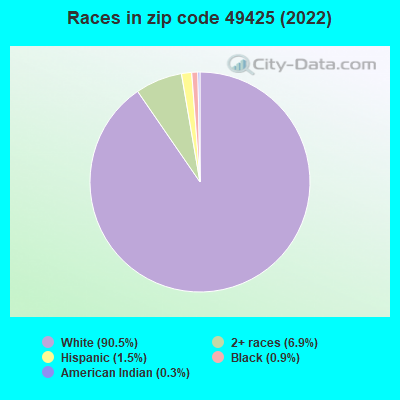
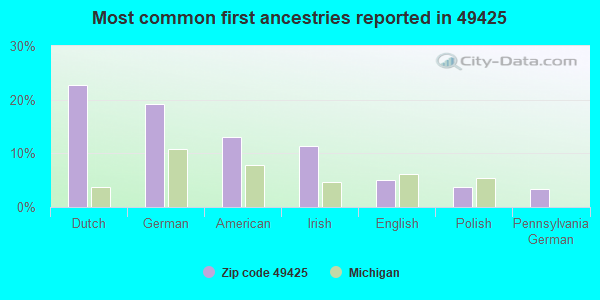
23%Dutch
19%German
13%American
11%Irish
5%English
4%Polish
3%Pennsylvania German
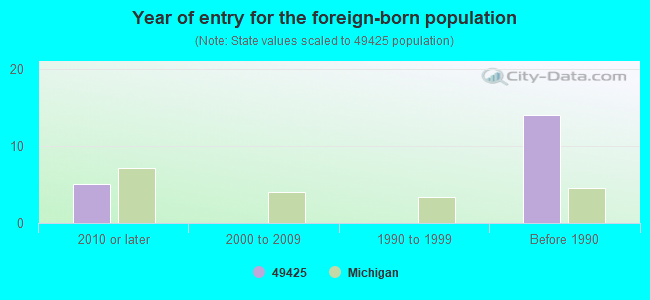
Year of entry for the foreign-born population
52010 or later
02000 to 2009
01990 to 1999
14Before 1990
Facilities with environmental interests located in this zip code:
MI DEPT/STATE POLICE (T 10N R 16W MUSKEGON TWP SEC 3 in HOLTON, MI)
(Resource Conservation and Recovery Act (tracking hazardous waste))
Housing units lacking complete plumbing facilities: 0.4% Housing units lacking complete kitchen facilities: 1.5%
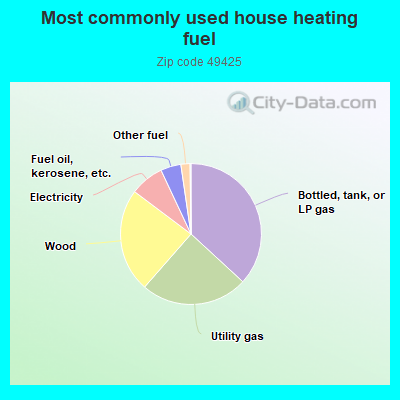
37.0%Bottled, tank, or LP gas
24.7%Utility gas
23.9%Wood
7.8%Electricity
4.7%Fuel oil, kerosene, etc.
2.1%Other fuel
Population in 1990: 4,251.
Place of birth for U.S.-born residents:
This state: 3,039
Northeast: 52
Midwest: 243
South: 91
West: 50
65% of the 49425 zip code residents lived in the same house 5 years ago. Out of people who lived in different houses, 49% lived in this county. Out of people who lived in different counties, 50% lived in Michigan.
97% of the 49425 zip code residents lived in the same house 1 year ago. Out of people who lived in different houses, 40% moved from this county. Out of people who lived in different houses, 66% moved from different county within same state.
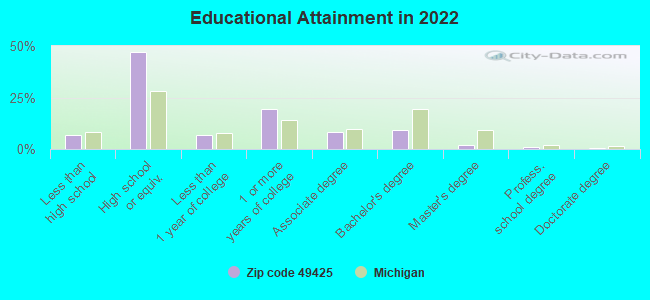
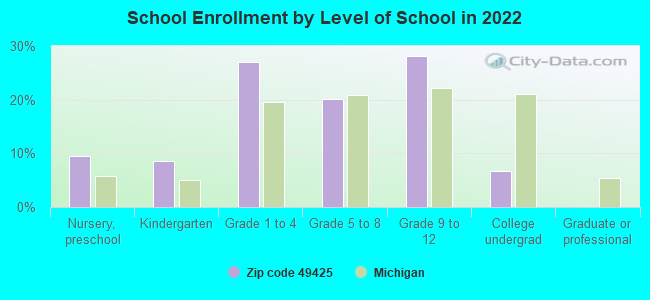
Private vs. public school enrollment:
Students in private schools in grades 1 to 8 (elementary and middle school): 77
Here:
26.9%
Michigan:
12.4%
Students in private schools in grades 9 to 12 (high school): 25
Here:
14.7%
Michigan:
9.8%
Students in private undergraduate colleges: 18
Here:
44.2%
Michigan:
14.9%
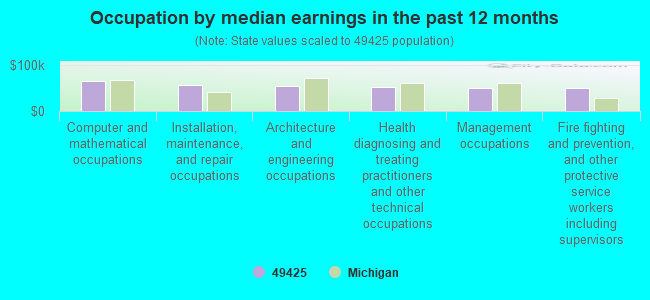
Occupation by median earnings in the past 12 months ($)
65,201Computer and mathematical occupations
56,680Installation, maintenance, and repair occupations
55,141Architecture and engineering occupations
52,199Health diagnosing and treating practitioners and other technical occupations
49,062Management occupations
49,030Fire fighting and prevention, and other protective service workers including supervisors
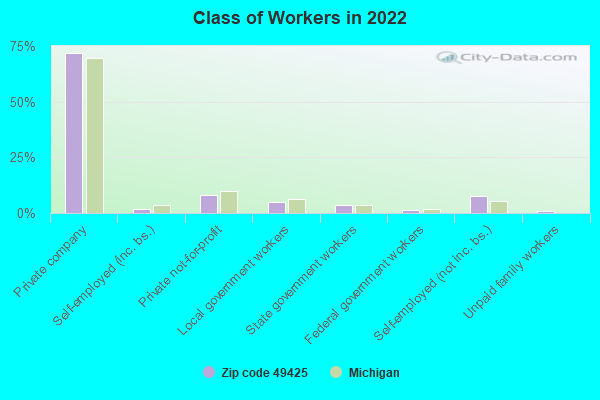
Top industries in this zip code by the number of employees in 2005:
Administrative and Support and Waste Management and Remediation Services: Janitorial Services (50-99 employees: 1 establishment, 1-4 employees: 1 establishment)
Construction: Poured Concrete Foundation and Structure Contractors (10-19: 1)
Accommodation and Food Services: Full-Service Restaurants (10-19: 1)
Construction: Power and Communication Line and Related Structures Construction (10-19: 1)
Construction: Site Preparation Contractors (1-4: 5)
Other Services (except Public Administration): Civic and Social Organizations (5-9: 1)
Other Services (except Public Administration): Religious Organizations (5-9: 1)
People in group quarters in 2010:
24 people in workers' group living quarters and job corps centers
Fatal accident statistics in 2014:
Fatal accident count: 2
Vehicles involved in fatal accidents: 3
Fatal accidents caused by drunken drivers: 0
Fatalities: 2
Persons involved in fatal accidents: 4
Pedestrians involved in fatal accidents: 0
Fatal accident statistics in 2012:
Fatal accident count: 1
Vehicles involved in fatal accidents: 1
Fatal accidents caused by drunken drivers: 0
Fatalities: 1
Persons involved in fatal accidents: 1
Pedestrians involved in fatal accidents: 0
Home Mortgage Disclosure Act Aggregated Statistics For Year 2009 (Based on 4 partial tracts)
A) FHA, FSA/RHS & VA Home Purchase Loans
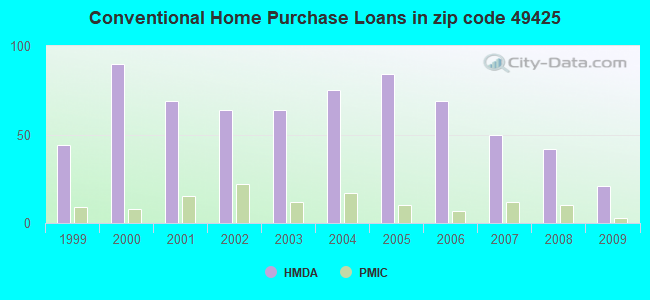
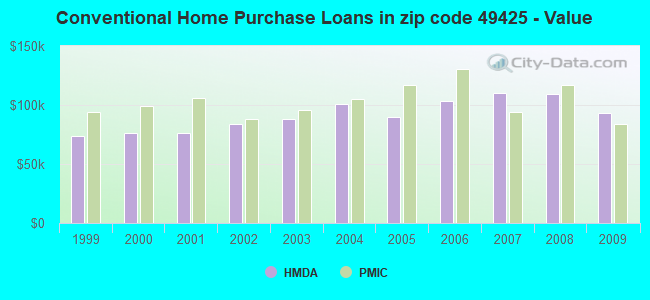
B) Conventional Home Purchase Loans
C) Refinancings
D) Home Improvement Loans
F) Non-occupant Loans on < 5 Family Dwellings (A B C & D)
G) Loans On Manufactured Home Dwelling (A B C & D)
Number
Average Value
Number
Average Value
Number
Average Value
Number
Average Value
Number
Average Value
Number
Average Value
LOANS ORIGINATED
23
$102,025
21
$93,466
116
$142,897
3
$48,077
6
$94,840
13
$59,863
APPLICATIONS APPROVED, NOT ACCEPTED
1
$96,320
2
$102,080
19
$124,234
5
$63,386
2
$75,100
0
$0
APPLICATIONS DENIED
7
$102,990
4
$226,078
47
$107,691
5
$19,556
4
$93,758
8
$71,814
APPLICATIONS WITHDRAWN
3
$80,807
5
$52,638
30
$128,867
1
$5,230
0
$0
3
$64,780
FILES CLOSED FOR INCOMPLETENESS
1
$49,210
0
$0
11
$110,351
0
$0
0
$0
2
$95,275
Aggregated Statistics For Year 2008 (Based on 4 partial tracts)
A) FHA, FSA/RHS & VA Home Purchase Loans
B) Conventional Home Purchase Loans
C) Refinancings
D) Home Improvement Loans
F) Non-occupant Loans on < 5 Family Dwellings (A B C & D)
G) Loans On Manufactured Home Dwelling (A B C & D)
Number
Average Value
Number
Average Value
Number
Average Value
Number
Average Value
Number
Average Value
Number
Average Value
LOANS ORIGINATED
17
$100,556
42
$109,219
88
$105,968
5
$27,268
8
$102,308
16
$65,838
APPLICATIONS APPROVED, NOT ACCEPTED
0
$0
5
$94,780
14
$95,739
1
$29,370
0
$0
2
$105,980
APPLICATIONS DENIED
7
$114,036
7
$76,951
64
$123,367
8
$64,796
1
$165,020
10
$64,181
APPLICATIONS WITHDRAWN
4
$77,215
3
$65,217
14
$102,324
0
$0
0
$0
4
$64,652
FILES CLOSED FOR INCOMPLETENESS
0
$0
2
$55,435
3
$115,647
0
$0
0
$0
0
$0
Aggregated Statistics For Year 2007 (Based on 4 partial tracts)
A) FHA, FSA/RHS & VA Home Purchase Loans
B) Conventional Home Purchase Loans
C) Refinancings
D) Home Improvement Loans
F) Non-occupant Loans on < 5 Family Dwellings (A B C & D)
G) Loans On Manufactured Home Dwelling (A B C & D)
Number
Average Value
Number
Average Value
Number
Average Value
Number
Average Value
Number
Average Value
Number
Average Value
LOANS ORIGINATED
6
$104,773
50
$109,971
101
$86,392
23
$45,199
13
$92,445
21
$67,786
APPLICATIONS APPROVED, NOT ACCEPTED
1
$81,670
9
$84,434
30
$102,235
4
$37,132
3
$90,740
5
$55,512
APPLICATIONS DENIED
10
$80,256
23
$67,402
101
$105,584
27
$36,820
10
$58,527
21
$59,275
APPLICATIONS WITHDRAWN
2
$90,190
10
$126,702
34
$111,239
1
$15,700
3
$63,867
3
$95,400
FILES CLOSED FOR INCOMPLETENESS
1
$109,930
3
$91,090
6
$105,857
0
$0
0
$0
1
$86,900
Aggregated Statistics For Year 2006 (Based on 4 partial tracts)
A) FHA, FSA/RHS & VA Home Purchase Loans
B) Conventional Home Purchase Loans
C) Refinancings
D) Home Improvement Loans
F) Non-occupant Loans on < 5 Family Dwellings (A B C & D)
G) Loans On Manufactured Home Dwelling (A B C & D)
Number
Average Value
Number
Average Value
Number
Average Value
Number
Average Value
Number
Average Value
Number
Average Value
LOANS ORIGINATED
16
$98,415
69
$102,971
133
$91,414
37
$58,779
11
$97,230
28
$69,598
APPLICATIONS APPROVED, NOT ACCEPTED
2
$98,420
8
$126,719
15
$94,373
2
$74,130
0
$0
1
$60,360
APPLICATIONS DENIED
9
$91,127
21
$89,174
103
$96,692
15
$32,262
6
$77,420
17
$73,346
APPLICATIONS WITHDRAWN
0
$0
6
$129,693
55
$112,332
5
$52,128
2
$100,510
0
$0
FILES CLOSED FOR INCOMPLETENESS
3
$78,747
1
$109,370
22
$131,385
2
$104,700
0
$0
2
$106,795
Aggregated Statistics For Year 2005 (Based on 4 partial tracts)
A) FHA, FSA/RHS & VA Home Purchase Loans
B) Conventional Home Purchase Loans
C) Refinancings
D) Home Improvement Loans
F) Non-occupant Loans on < 5 Family Dwellings (A B C & D)
G) Loans On Manufactured Home Dwelling (A B C & D)
Number
Average Value
Number
Average Value
Number
Average Value
Number
Average Value
Number
Average Value
Number
Average Value
LOANS ORIGINATED
7
$84,060
84
$90,030
168
$96,911
22
$42,619
17
$94,918
36
$65,638
APPLICATIONS APPROVED, NOT ACCEPTED
0
$0
6
$85,390
18
$96,721
1
$15,700
0
$0
4
$93,182
APPLICATIONS DENIED
9
$92,020
26
$67,300
137
$97,374
23
$21,417
3
$61,200
33
$69,054
APPLICATIONS WITHDRAWN
4
$90,042
6
$74,512
94
$111,814
1
$23,220
1
$108,890
7
$51,067
FILES CLOSED FOR INCOMPLETENESS
0
$0
2
$100,365
36
$102,998
3
$73,987
0
$0
1
$94,230
Aggregated Statistics For Year 2004 (Based on 4 partial tracts)
A) FHA, FSA/RHS & VA Home Purchase Loans
B) Conventional Home Purchase Loans
C) Refinancings
D) Home Improvement Loans
F) Non-occupant Loans on < 5 Family Dwellings (A B C & D)
G) Loans On Manufactured Home Dwelling (A B C & D)
Number
Average Value
Number
Average Value
Number
Average Value
Number
Average Value
Number
Average Value
Number
Average Value
LOANS ORIGINATED
7
$97,764
75
$100,443
174
$102,460
23
$58,190
12
$81,102
24
$101,686
APPLICATIONS APPROVED, NOT ACCEPTED
0
$0
13
$65,258
45
$86,560
1
$68,050
5
$56,186
8
$40,574
APPLICATIONS DENIED
4
$106,308
31
$58,394
124
$102,774
21
$42,795
9
$69,334
29
$58,580
APPLICATIONS WITHDRAWN
0
$0
9
$94,700
61
$109,440
4
$65,695
2
$59,670
6
$91,647
FILES CLOSED FOR INCOMPLETENESS
1
$84,810
3
$94,927
28
$103,697
1
$63,040
0
$0
1
$103,960
Aggregated Statistics For Year 2003 (Based on 4 partial tracts)
A) FHA, FSA/RHS & VA Home Purchase Loans
B) Conventional Home Purchase Loans
C) Refinancings
D) Home Improvement Loans
F) Non-occupant Loans on < 5 Family Dwellings (A B C & D)
Number
Average Value
Number
Average Value
Number
Average Value
Number
Average Value
Number
Average Value
LOANS ORIGINATED
14
$97,584
64
$88,020
338
$97,869
14
$27,251
17
$92,481
APPLICATIONS APPROVED, NOT ACCEPTED
1
$95,280
7
$78,886
60
$92,851
2
$37,050
2
$129,550
APPLICATIONS DENIED
2
$104,700
22
$75,187
179
$84,893
16
$36,084
6
$66,333
APPLICATIONS WITHDRAWN
2
$112,030
6
$91,113
61
$88,548
2
$18,320
1
$62,320
FILES CLOSED FOR INCOMPLETENESS
0
$0
2
$170,815
19
$102,601
0
$0
0
$0
Aggregated Statistics For Year 2002 (Based on 4 partial tracts)
A) FHA, FSA/RHS & VA Home Purchase Loans
B) Conventional Home Purchase Loans
C) Refinancings
D) Home Improvement Loans
F) Non-occupant Loans on < 5 Family Dwellings (A B C & D)
Number
Average Value
Number
Average Value
Number
Average Value
Number
Average Value
Number
Average Value
LOANS ORIGINATED
9
$95,321
64
$83,749
273
$92,915
35
$27,348
15
$77,473
APPLICATIONS APPROVED, NOT ACCEPTED
0
$0
12
$77,143
50
$89,066
6
$63,307
5
$50,722
APPLICATIONS DENIED
2
$108,650
33
$64,407
112
$91,589
15
$12,183
1
$62,820
APPLICATIONS WITHDRAWN
1
$48,160
3
$88,030
50
$88,301
1
$48,160
2
$85,330
FILES CLOSED FOR INCOMPLETENESS
0
$0
2
$97,370
14
$114,671
0
$0
0
$0
Aggregated Statistics For Year 2001 (Based on 4 partial tracts)
A) FHA, FSA/RHS & VA Home Purchase Loans
B) Conventional Home Purchase Loans
C) Refinancings
D) Home Improvement Loans
F) Non-occupant Loans on < 5 Family Dwellings (A B C & D)
Number
Average Value
Number
Average Value
Number
Average Value
Number
Average Value
Number
Average Value
LOANS ORIGINATED
6
$91,883
69
$75,959
226
$85,679
39
$21,954
11
$62,997
APPLICATIONS APPROVED, NOT ACCEPTED
0
$0
18
$41,567
36
$76,198
11
$21,107
3
$57,107
APPLICATIONS DENIED
2
$79,050
39
$39,585
105
$77,674
35
$18,613
7
$70,897
APPLICATIONS WITHDRAWN
1
$85,850
4
$69,362
57
$85,215
6
$17,738
1
$40,830
FILES CLOSED FOR INCOMPLETENESS
1
$94,230
1
$169,610
10
$84,137
2
$63,345
0
$0
Aggregated Statistics For Year 2000 (Based on 4 partial tracts)
A) FHA, FSA/RHS & VA Home Purchase Loans
B) Conventional Home Purchase Loans
C) Refinancings
D) Home Improvement Loans
F) Non-occupant Loans on < 5 Family Dwellings (A B C & D)
Number
Average Value
Number
Average Value
Number
Average Value
Number
Average Value
Number
Average Value
LOANS ORIGINATED
14
$69,731
90
$76,414
94
$64,898
37
$24,233
7
$76,086
APPLICATIONS APPROVED, NOT ACCEPTED
1
$75,380
18
$62,413
32
$62,703
13
$33,056
4
$69,362
APPLICATIONS DENIED
2
$99,990
69
$46,295
92
$62,599
17
$18,667
2
$102,975
APPLICATIONS WITHDRAWN
1
$71,200
7
$65,873
28
$62,782
3
$66,310
0
$0
FILES CLOSED FOR INCOMPLETENESS
0
$0
2
$86,900
10
$62,659
0
$0
0
$0
Aggregated Statistics For Year 1999 (Based on 2 partial tracts)
A) FHA, FSA/RHS & VA Home Purchase Loans
B) Conventional Home Purchase Loans
C) Refinancings
D) Home Improvement Loans
F) Non-occupant Loans on < 5 Family Dwellings (A B C & D)
Detailed PMIC statistics for the following Tracts:0033.00
, 0040.00
2002 - 2018 National Fire Incident Reporting System (NFIRS) incidents
Based on the data from the years 2002 - 2018 the average number of fire incidents per year is 25. The highest number of reported fires - 44 took place in 2012, and the least - 7 in 2007. The data has a dropping trend.
When looking into fire subcategories, the most incidents belonged to: Structure Fires (52.2%), and Outside Fires (33.8%).
Fire incident types reported to NFIRS in Zip Code 49425


 Nearest zip codes: 49457, 49412, 49421, 49452, 49442, 49461.


 Based on the data from the years 2002 - 2018 the average number of fire incidents per year is 25. The highest number of reported fires - 44 took place in 2012, and the least - 7 in 2007. The data has a dropping trend.
 When looking into fire subcategories, the most incidents belonged to: Structure Fires (52.2%), and Outside Fires (33.8%).