Estimated zip code population in 2022: 32,248 Zip code population in 2010: 31,216 Zip code population in 2000: 31,967
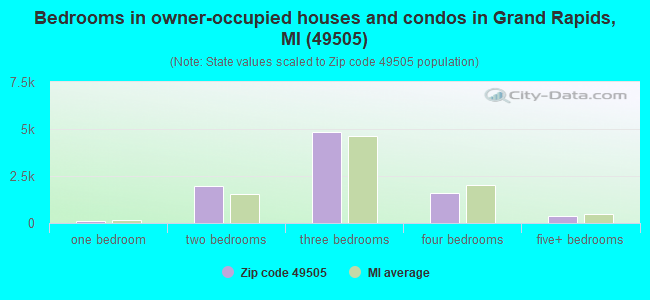
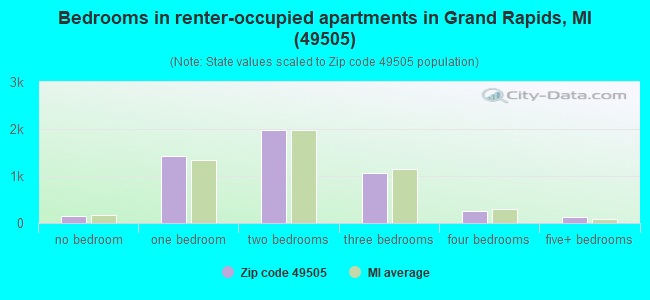
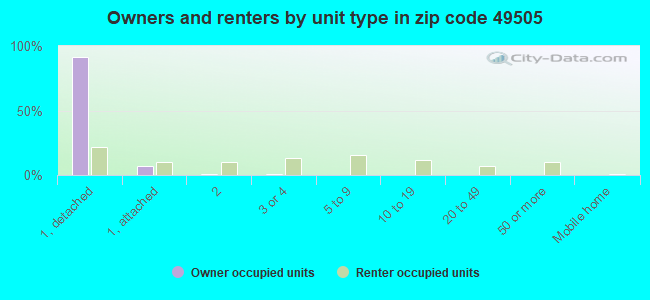
Houses and condos: 14,180 Renter-occupied apartments: 4,965
% of renters here:
36%
State:
27%
March 2022 cost of living index in zip code 49505: 86.0 (less than average, U.S. average is 100)
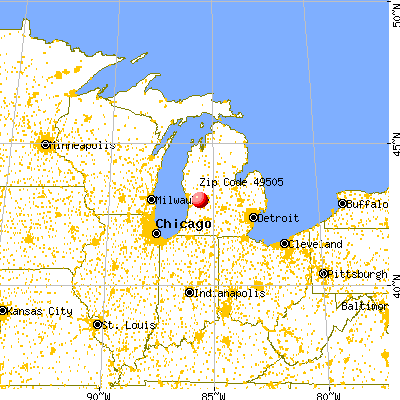
Land area: 8.9 sq. mi. Water area: 0.2 sq. mi.
Population density: 3,623 people per square mile
(average).
OSM Map
General Map
Google Map
MSN Map
OSM Map
General Map
Google Map
MSN Map
OSM Map
General Map
Google Map
MSN Map
OSM Map
General Map
Google Map
MSN Map
Please wait while loading the map...
Real estate property taxes paid for housing units in 2022:
This zip code:
1.0% ($2,340)
Michigan:
1.2% ($2,746)
Median real estate property taxes paid for housing units with mortgages in 2022: $2,402 (1.1%) Median real estate property taxes paid for housing units with no mortgage in 2022: $2,224 (0.9%)
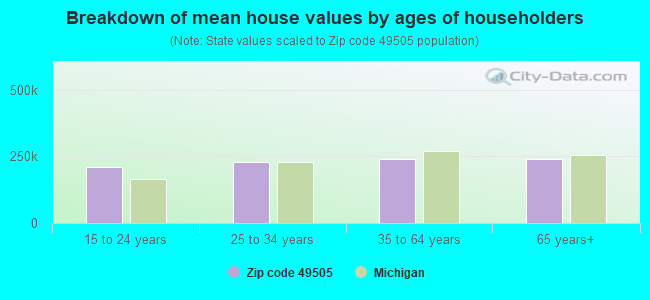
Estimated median house/condo value in 2022: $225,851
49505:
$225,851
Michigan:
$224,400
According to our research of Michigan and other state lists, there were 121 registered sex offenders living in 49505 zip code as of April 18, 2024. The ratio of all residents to sex offenders in zip code 49505 is 266 to 1. The ratio of registered sex offenders to all residents in this zip code is near the state average.
Median resident age:
This zip code:
34.9 years
Michigan median age:
40.3 years
Average household size:
This zip code:
2.3 people
Michigan:
2.4 people
Averages for the 2020 tax year for zip code 49505, filed in 2021:
Average Adjusted Gross Income (AGI) in 2020: $52,473 (Individual Income Tax Returns)
Here:
$52,473
State:
$68,945
Salary/wage: $47,097 (reported on 83.1% of returns)
Here:
$47,097
State:
$57,142
(% of AGI for various income ranges: 1073.8% for AGIs below $25k, 3571.4% for AGIs $25k-50k, 6716.9% for AGIs $50k-75k, 9858.6% for AGIs $75k-100k, 16692.6% for AGIs $100k-200k, 63380.0% for AGIs over 200k)
Taxable interest for individuals: $674 (reported on 34.5% of returns)
This zip code:
$674
Michigan:
$1,630
(% of AGI for various income ranges: 14.8% for AGIs below $25k, 12.8% for AGIs $25k-50k, 27.7% for AGIs $50k-75k, 45.6% for AGIs $75k-100k, 107.3% for AGIs $100k-200k, 801.2% for AGIs over 200k)
Ordinary dividends: $3,426 (reported on 16.7% of returns)
Here:
$3,426
State:
$6,972
(% of AGI for various income ranges: 24.8% for AGIs below $25k, 26.3% for AGIs $25k-50k, 65.5% for AGIs $50k-75k, 99.7% for AGIs $75k-100k, 279.0% for AGIs $100k-200k, 2807.5% for AGIs over 200k)
Net capital gain/loss in AGI: +$7,354 (reported on 14.9% of returns)
Here:
+$7,354
State:
+$20,064
(% of AGI for various income ranges: 6.2% for AGIs below $25k, 21.2% for AGIs $25k-50k, 57.5% for AGIs $50k-75k, 129.8% for AGIs $75k-100k, 468.1% for AGIs $100k-200k, 12115.0% for AGIs over 200k)
Profit/loss from business: +$9,564 (reported on 13.8% of returns)
Here:
+$9,564
State:
+$11,172
(% of AGI for various income ranges: 70.7% for AGIs below $25k, 95.7% for AGIs $25k-50k, 212.0% for AGIs $50k-75k, 224.2% for AGIs $75k-100k, 618.7% for AGIs $100k-200k, 2851.2% for AGIs over 200k)
Taxable individual retirement arrangement distribution: $15,554 (reported on 9.3% of returns)
49505:
$15,554
Michigan:
$19,803
(% of AGI for various income ranges: 79.8% for AGIs below $25k, 90.0% for AGIs $25k-50k, 167.3% for AGIs $50k-75k, 348.3% for AGIs $75k-100k, 749.5% for AGIs $100k-200k, 3143.8% for AGIs over 200k)
Self-employed (Keogh) retirement plans: $18,500 (reported on 0.2% of returns)
49505:
$18,500
Michigan:
$25,132
(% of AGI for various income ranges: 75.5% for AGIs $100k-200k)
Total itemized deductions: $27,671 (reported on 4.8% of returns)
Here:
$27,671
State:
$34,117
(% of AGI for various income ranges: 39.8% for AGIs below $25k, 57.8% for AGIs $25k-50k, 191.0% for AGIs $50k-75k, 299.3% for AGIs $75k-100k, 589.0% for AGIs $100k-200k, 6048.8% for AGIs over 200k)
Charity contributions: $10,377 (reported on 3.7% of returns)
Here:
$10,377
State:
$13,548
(% of AGI for various income ranges: 4.2% for AGIs below $25k, 6.3% for AGIs $25k-50k, 35.5% for AGIs $50k-75k, 67.4% for AGIs $75k-100k, 184.6% for AGIs $100k-200k, 3316.2% for AGIs over 200k)
Taxes paid: $6,888 (reported on 4.8% of returns)
49505:
$6,888
State:
$7,972
(% of AGI for various income ranges: 4.3% for AGIs below $25k, 9.4% for AGIs $25k-50k, 50.6% for AGIs $50k-75k, 103.9% for AGIs $75k-100k, 176.0% for AGIs $100k-200k, 1183.8% for AGIs over 200k)
Earned income credit: $2,136 (reported on 14.3% of returns)
Here:
$2,136
State:
$2,251
(% of AGI for various income ranges: 78.0% for AGIs below $25k, 51.9% for AGIs $25k-50k, 0.7% for AGIs $50k-75k)
Percentage of individuals using paid preparers for their 2020 taxes: 94.0%
Here:
94%
State:
93%
(% for various income ranges: 92.4% for AGIs below $25k, 94.7% for AGIs $25k-50k, 94.7% for AGIs $50k-75k, 94.2% for AGIs $75k-100k, 95.2% for AGIs $100k-200k, 96.2% for AGIs over 200k)
Averages for the 2012 tax year for zip code 49505, filed in 2013:
Average Adjusted Gross Income (AGI) in 2012: $41,171 (Individual Income Tax Returns)
Here:
$41,171
State:
$55,609
Salary/wage: $37,908 (reported on 83.9% of returns)
Here:
$37,908
State:
$46,782
(% of AGI for various income ranges: 74.0% for AGIs below $25k, 82.5% for AGIs $25k-50k, 79.8% for AGIs $50k-75k, 78.6% for AGIs $75k-100k, 75.9% for AGIs $100k-200k, 58.1% for AGIs over 200k)
Taxable interest for individuals: $803 (reported on 34.1% of returns)
This zip code:
$803
Michigan:
$1,491
(% of AGI for various income ranges: 1.0% for AGIs below $25k, 0.5% for AGIs $25k-50k, 0.5% for AGIs $50k-75k, 0.7% for AGIs $75k-100k, 0.5% for AGIs $100k-200k, 1.2% for AGIs over 200k)
Ordinary dividends: $2,996 (reported on 16.2% of returns)
Here:
$2,996
State:
$6,225
(% of AGI for various income ranges: 1.3% for AGIs below $25k, 0.8% for AGIs $25k-50k, 0.8% for AGIs $50k-75k, 1.1% for AGIs $75k-100k, 1.5% for AGIs $100k-200k, 2.6% for AGIs over 200k)
Net capital gain/loss in AGI: +$2,251 (reported on 11.9% of returns)
Here:
+$2,251
State:
+$9,326
(% of AGI for various income ranges: 0.4% for AGIs $50k-75k, 0.5% for AGIs $75k-100k, 1.0% for AGIs $100k-200k, 4.4% for AGIs over 200k)
Profit/loss from business: +$9,921 (reported on 13.3% of returns)
Here:
+$9,921
State:
+$11,523
(% of AGI for various income ranges: 6.6% for AGIs below $25k, 2.5% for AGIs $25k-50k, 2.5% for AGIs $50k-75k, 3.0% for AGIs $75k-100k, 3.3% for AGIs $100k-200k, 1.9% for AGIs over 200k)
Taxable individual retirement arrangement distribution: $11,693 (reported on 11.0% of returns)
49505:
$11,693
Michigan:
$15,298
(% of AGI for various income ranges: 4.3% for AGIs below $25k, 2.6% for AGIs $25k-50k, 2.8% for AGIs $50k-75k, 2.9% for AGIs $75k-100k, 3.9% for AGIs $100k-200k, 2.2% for AGIs over 200k)
Self-employment retirement plans: $13,100 (reported on 0.3% of returns)
49505:
$13,100
Michigan:
$20,834
Total itemized deductions: $16,545 (22% of AGI, reported on 27.3% of returns)
Here:
$16,545
State:
$21,628
Here:
21.7% of AGI
State:
18.4% of AGI
(% of AGI for various income ranges: 6.7% for AGIs below $25k, 8.8% for AGIs $25k-50k, 11.0% for AGIs $50k-75k, 12.3% for AGIs $75k-100k, 14.1% for AGIs $100k-200k, 15.3% for AGIs over 200k)
Charity contributions: $3,932 (reported on 21.9% of returns)
Here:
$3,932
State:
$4,225
(% of AGI for various income ranges: 0.8% for AGIs below $25k, 1.1% for AGIs $25k-50k, 1.9% for AGIs $50k-75k, 2.5% for AGIs $75k-100k, 3.0% for AGIs $100k-200k, 5.4% for AGIs over 200k)
Taxes paid: $6,061 (reported on 27.3% of returns)
49505:
$6,061
State:
$8,327
(% of AGI for various income ranges: 1.5% for AGIs below $25k, 2.7% for AGIs $25k-50k, 3.8% for AGIs $50k-75k, 4.8% for AGIs $75k-100k, 6.2% for AGIs $100k-200k, 6.3% for AGIs over 200k)
Earned income credit: $2,304 (reported on 19.3% of returns)
Here:
$2,304
State:
$2,306
(% of AGI for various income ranges: 6.6% for AGIs below $25k, 0.9% for AGIs $25k-50k)
Percentage of individuals using paid preparers for their 2012 taxes: 48.2%
Here:
48%
State:
57%
(% for various income ranges: 46.0% for AGIs below $25k, 47.0% for AGIs $25k-50k, 50.9% for AGIs $50k-75k, 51.9% for AGIs $75k-100k, 54.9% for AGIs $100k-200k, 69.2% for AGIs over 200k)
Averages for the 2004 tax year for zip code 49505, filed in 2005:
Average Adjusted Gross Income (AGI) in 2004: $37,274 (Individual Income Tax Returns)
Here:
$37,274
State:
$48,204
Salary/wage: $35,235 (reported on 85.6% of returns)
Here:
$35,235
State:
$42,791
(% of AGI for various income ranges: 85.3% for AGIs below $10k, 74.4% for AGIs $10k-25k, 85.0% for AGIs $25k-50k, 84.6% for AGIs $50k-75k, 81.9% for AGIs $75k-100k, 72.1% for AGIs over 100k)
Taxable interest for individuals: $1,248 (reported on 43.6% of returns)
This zip code:
$1,248
Michigan:
$1,725
(% of AGI for various income ranges: 4.9% for AGIs below $10k, 2.7% for AGIs $10k-25k, 1.1% for AGIs $25k-50k, 1.0% for AGIs $50k-75k, 1.2% for AGIs $75k-100k, 1.7% for AGIs over 100k)
Taxable dividends: $2,011 (reported on 21.4% of returns)
Here:
$2,011
State:
$3,420
(% of AGI for various income ranges: 3.0% for AGIs below $10k, 1.8% for AGIs $10k-25k, 0.8% for AGIs $25k-50k, 0.7% for AGIs $50k-75k, 1.1% for AGIs $75k-100k, 1.7% for AGIs over 100k)
Net capital gain/loss: +$3,309 (reported on 15.7% of returns)
Here:
+$3,309
State:
+$8,532
(% of AGI for various income ranges: -2.1% for AGIs below $10k, -0.2% for AGIs $10k-25k, 0.3% for AGIs $25k-50k, 0.7% for AGIs $50k-75k, 1.7% for AGIs $75k-100k, 5.3% for AGIs over 100k)
Profit/loss from business: +$8,177 (reported on 12.1% of returns)
Here:
+$8,177
State:
+$9,547
(% of AGI for various income ranges: 3.1% for AGIs below $10k, 3.8% for AGIs $10k-25k, 2.3% for AGIs $25k-50k, 2.2% for AGIs $50k-75k, 2.5% for AGIs $75k-100k, 3.1% for AGIs over 100k)
IRA payment deduction: $2,577 (reported on 2.0% of returns)
49505:
$2,577
Michigan:
$2,875
(% of AGI for various income ranges: 0.2% for AGIs $10k-25k, 0.2% for AGIs $25k-50k, 0.1% for AGIs $50k-75k, 0.1% for AGIs $75k-100k, 0.1% for AGIs over 100k)
Self-employed pension: $9,259 (reported on 0.6% of returns)
Here:
$9,259
Michigan:
$13,826
(% of AGI for various income ranges: 0.1% for AGIs $25k-50k, 0.1% for AGIs $50k-75k, 0.1% for AGIs $75k-100k, 0.4% for AGIs over 100k)
Total itemized deductions: $14,293 (23% of AGI, reported on 36.5% of returns)
Here:
$14,293
State:
$18,509
Here:
23.3% of AGI
State:
20.7% of AGI
(% of AGI for various income ranges: 13.7% for AGIs below $10k, 10.5% for AGIs $10k-25k, 13.1% for AGIs $25k-50k, 14.9% for AGIs $50k-75k, 15.6% for AGIs $75k-100k, 15.1% for AGIs over 100k)
Charity contributions deductions: $3,076 (5% of AGI, reported on 30.3% of returns)
Here:
$3,076
State:
$3,365
Here:
4.7% of AGI
State:
3.6% of AGI
(% of AGI for various income ranges: 1.2% for AGIs below $10k, 1.3% for AGIs $10k-25k, 1.7% for AGIs $25k-50k, 2.5% for AGIs $50k-75k, 3.0% for AGIs $75k-100k, 4.2% for AGIs over 100k)
Total tax: $4,714 (reported on 73.9% of returns)
49505:
$4,714
State:
$7,691
(% of AGI for various income ranges: 2.1% for AGIs below $10k, 3.9% for AGIs $10k-25k, 7.2% for AGIs $25k-50k, 9.1% for AGIs $50k-75k, 10.6% for AGIs $75k-100k, 16.4% for AGIs over 100k)
Earned income credit: $1,701 (reported on 15.0% of returns)
Here:
$1,701
State:
$1,737
Percentage of individuals using paid preparers for their 2004 taxes: 52.5%
Here:
52%
State:
60%
(% for various income ranges: 48.9% for AGIs below $10k, 54.5% for AGIs $10k-25k, 50.6% for AGIs $25k-50k, 51.6% for AGIs $50k-75k, 56.8% for AGIs $75k-100k, 65.5% for AGIs over 100k)
Likely homosexual households (counted as self-reported same-sex unmarried-partner households)
Lesbian couples: 0.1% of all households
Gay men: 0.1% of all households
Household received Food Stamps/SNAP in the past 12 months: 2,238 Household did not receive Food Stamps/SNAP in the past 12 months: 11,700
Women who had a birth in the past 12 months: 550 (357 now married, 191 unmarried) Women who did not have a birth in the past 12 months: 7,532 (2,948 now married, 4,584 unmarried)
Housing units in zip code 49505 with a mortgage: 5,897 (422 second mortgage, 22 home equity loan, 403 both second mortgage and home equity loan) Houses without a mortgage: 97
Median monthly owner costs for units with a mortgage: $1,220 Median monthly owner costs for units without a mortgage: $487
Residents with income below the poverty level in 2022:
This zip code:
15.7%
Whole state:
13.4%
Residents with income below 50% of the poverty level in 2022:
This zip code:
10.0%
Whole state:
6.9%
Median number of rooms in houses and condos:
Here:
6.5
State:
6.5
Median number of rooms in apartments:
Here:
4.2
State:
4.3
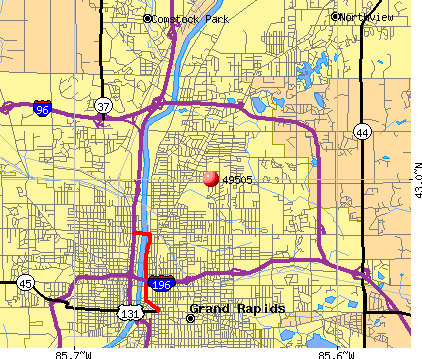
Notable locations in this zip code not listed on our city pages
Notable locations in zip code 49505: Kent Country Club (A), Leonard Fuller Plaza (B), Grand Rapids Fire Department Plainfield Avenue Station (C), Grand Rapids Fire Department Leonard Street Station (D), Van Belkum Library (E), Yankee Clipper Library (F). Display/hide their locations on the map
Churches in zip code 49505 include: First Free Church (A), Trinity Church (B), Blessed Sacrament Church (C), Faith Lutheran Church (D), Jehovah's Witnesses (E), New Community Church (F), All Nations Church (G), Aberdeen Reformed Church (H), Beckwith Hills Christian Reformed Church (I). Display/hide their locations on the map
Parks in zip code 49505 include: Barber Briggs Historical Marker (1), Veterans' Facility Historical Marker (2), Veterans' Cemetery Historical Marker (3), Huff Park (4), Blessed Sacrament Park (5), Briggs Park (6), Comstock Riverside Park (7). Display/hide their locations on the map
3,581 married couples with children.
2,270 single-parent households (390 men, 1,880 women).
91.2% of residents of 49505 zip code speak English at home.
2.7% of residents speak Spanish at home (76% very well, 19% well, 5% not well).
1.9% of residents speak other Indo-European language at home (78% very well, 12% well, 8% not well, 2% not at all).
1.6% of residents speak Asian or Pacific Island language at home (57% very well, 35% well, 5% not well, 3% not at all).
2.6% of residents speak other language at home (22% very well, 45% well, 15% not well, 18% not at all).
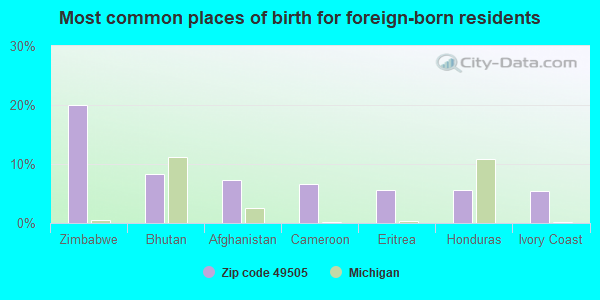
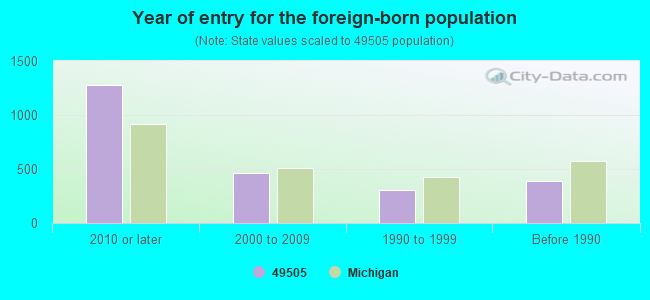
Foreign born population: 2,159 (6.7%) (45.1% of them are naturalized citizens)
Major facilities with environmental interests located in this zip code:
DISPLAY PACK INCORPORATED (1340 MONROE AVENUE NORTHWEST in GRAND RAPIDS, MI)
(Integrated Compliance Information System) - ICIS-05-1990-0079, FORMAL ENFORCEMENT ACTION COMPLIANCE ACTIVITY (Tracking inspections of insecticide, fungicide, and rodenticide, and toxic substances) Small Quantity Generators, between 100 kg and 1000 kg of hazardous waste/month (Resource Conservation and Recovery Act (tracking hazardous waste)) TRI REPORTER (Tracking of toxic chemicals releasing facilities) Business SIC classification: COMMERCIAL PRINTING; PLASTICS PRODUCTS; SPECIAL INDUSTRY MACHINERY; BUSINESS SERVICES Organizations: HANSEN ROGER (CONTACT/OPERATOR)
BAKER FURNITURE COMPANY (1661 MONROE AVENUE in GRAND RAPIDS, MI)
AIR MINOR (AIRS/AFS) COMPLIANCE ACTIVITY (Tracking inspections of insecticide, fungicide, and rodenticide, and toxic substances) CRITERIA AND HAZARDOUS AIR POLLUTANT INVENTORY (Inventory of air pollution sources) (Resource Conservation and Recovery Act (tracking hazardous waste)) TRI REPORTER (Tracking of toxic chemicals releasing facilities) Business SIC classification: WOOD HOUSEHOLD FURNITURE, EXCEPT UPHOLSTERED; METAL HOUSEHOLD FURNITURE; WOOD OFFICE FURNITURE Business NAICS classification: CORPORATE, SUBSIDIARY, AND REGIONAL MANAGING OFFICES. Organizations: KOHLER CO (CONTACT/OPERATOR)
Alternative names: BAKER KNAPP & TUBBS INC
ABERDEEN TECH/MATH ACADEMY (928 ABERDEEN STREET NE in GRAND RAPIDS, MI)
(National Center for Education Statistics) - STATE ID-08359 Organizations: GRAND RAPIDS PUBLIC SCHOOLS (SCHOOL DISTRICT)
GRAND RAPIDS TECH HIGH SCHOOL (1625 LEONARD NE in GRAND RAPIDS, MI)
(National Center for Education Statistics) - STATE ID-08365 Organizations: GRAND RAPIDS PUBLIC SCHOOLS (SCHOOL DISTRICT)
BETHANY BASED SCHOOL (901 EASTERN NE in GRAND RAPIDS, MI)
(National Center for Education Statistics) - STATE ID-07784 Organizations: GRAND RAPIDS PUBLIC SCHOOLS (SCHOOL DISTRICT)
GRAND RAPIDS LABEL CO (2351 OAK INDUSTRIAL in GRAND RAPIDS, MI)
AIR MINOR (AIRS/AFS) COMPLIANCE ACTIVITY (Tracking inspections of insecticide, fungicide, and rodenticide, and toxic substances) Small Quantity Generators, between 100 kg and 1000 kg of hazardous waste/month (Resource Conservation and Recovery Act (tracking hazardous waste)) Business SIC classification: DIE-CUT PAPER AND PAPERBOARD AND CARDBOARD; COMMERCIAL PRINTING; BUSINESS SERVICES Business NAICS classification: COMMERCIAL FLEXOGRAPHIC PRINTING. Organizations: GRAND RAPIDS LABEL COMPANY (CONTACT/OPERATOR)
AMOCO OIL CO (3100 PLAINFIELD N E in GRAND RAPIDS, MI)
(Resource Conservation and Recovery Act (tracking hazardous waste)) Organizations: AMOCO OIL COMPANY (CONTACT/OWNER)
, BP PRODUCTS NORTH AMERICA INC (CONTACT/OWNER)
Alternative names: AMOCO OIL CO 9758
AMOCO OIL CO (1169 E BELTLINE AVE in GRAND RAPIDS, MI)
(Resource Conservation and Recovery Act (tracking hazardous waste)) Organizations: AMOCO OIL COMPANY (CONTACT/OWNER)
, BP PRODUCTS NORTH AMERICA (CONTACT/OWNER)
Alternative names: AMOCO OIL CO 5474
DEVRIES PROPERTIES VENTURE LLC (1430 MONROE NE in GRAND RAPIDS, MI)
Large Quantity Generators, more that 1000 kg of hazardous waste/month (Resource Conservation and Recovery Act (tracking hazardous waste)) Organizations: MIKE DEVRIES (CONTACT/OWNER)
DISPLAY PACK INC (2990 MONROE NW in GRAND RAPIDS, MI)
AIR MINOR (AIRS/AFS)
EVERGREEN CLEANERS & LAUNDRY #2 (1621 LEONARD ST NE in GRAND RAPIDS, MI)
(Resource Conservation and Recovery Act (tracking hazardous waste)) Organizations: CHUNG CHO (CONTACT/OWNER)
Housing units lacking complete plumbing facilities: 0.0% Housing units lacking complete kitchen facilities: 1.0%
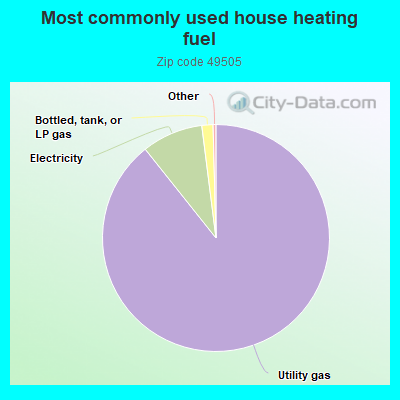
89.3%Utility gas
8.7%Electricity
1.6%Bottled, tank, or LP gas
Population in 1990: 52,883.
Place of birth for U.S.-born residents:
This state: 25,099
Northeast: 714
Midwest: 2,020
South: 1,240
West: 813
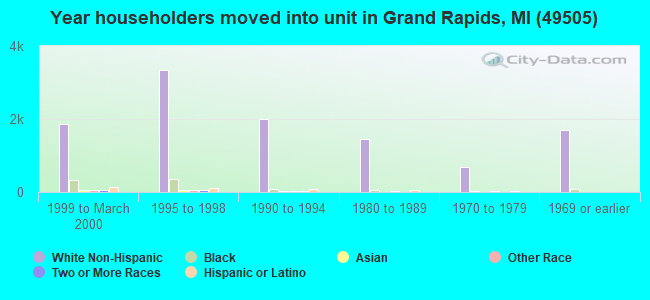
54% of the 49505 zip code residents lived in the same house 5 years ago. Out of people who lived in different houses, 71% lived in this county. Out of people who lived in different counties, 50% lived in Michigan.
88% of the 49505 zip code residents lived in the same house 1 year ago. Out of people who lived in different houses, 71% moved from this county. Out of people who lived in different houses, 14% moved from different county within same state. Out of people who lived in different houses, 5% moved from different state. Out of people who lived in different houses, 7% moved from abroad.
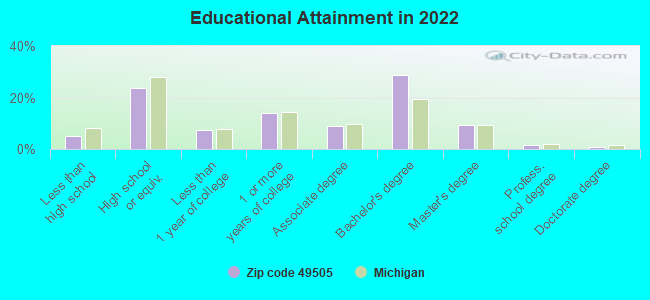
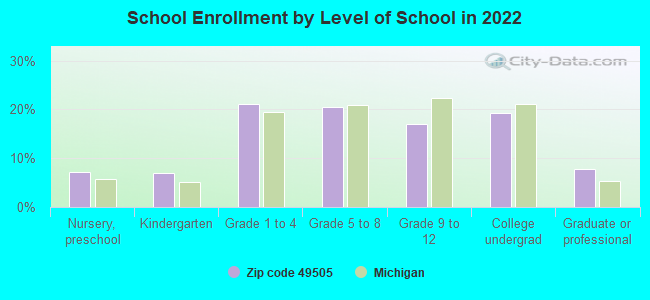
Private vs. public school enrollment:
Students in private schools in grades 1 to 8 (elementary and middle school): 581
Here:
19.8%
Michigan:
12.4%
Students in private schools in grades 9 to 12 (high school): 397
Here:
33.1%
Michigan:
9.8%
Students in private undergraduate colleges: 189
Here:
14.1%
Michigan:
14.9%
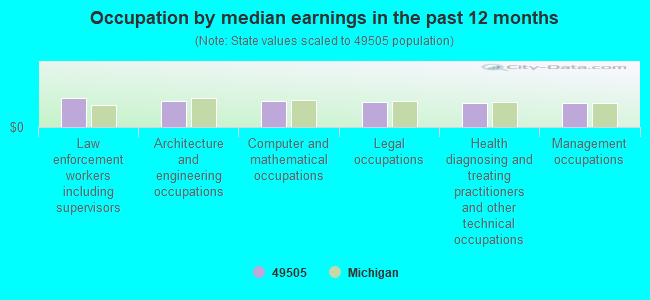
Occupation by median earnings in the past 12 months ($)
79,000Law enforcement workers including supervisors
72,154Architecture and engineering occupations
71,464Computer and mathematical occupations
68,387Legal occupations
65,501Health diagnosing and treating practitioners and other technical occupations
65,172Management occupations
Companies with federal contracts located in this zip code (GRAND RAPIDS, MI):
METRON U S , INC (1345 MONROE N W , SUITE 25; small business) : $39,998 in 5 contractsfrom 2003 to 2005
Contracts for Electrical and Electronic Properties Measuring and Testing Instruments, Chemical Analysis Instruments, Medical and Surgical Instruments, Equipment, and Supplies, Combination and Miscellaneous Instruments by Army, Air Force Signed by year:2000: $0; 2001: $0; 2002: $0; 2003: $5,022; 2004: $31,624; 2005: $3,352; 2006: $0.
Biggest contracts:
$14,985 with Army for Electrical and Electronic Properties Measuring and Testing Instruments. Signed on 2004-09-02. Completion date: 2004-09-28.
$9,297 with Army for Chemical Analysis Instruments. Signed on 2004-08-15. Completion date: 2004-08-16.
$7,342 with Army for Medical and Surgical Instruments, Equipment, and Supplies. Signed on 2004-08-02. Completion date: 2004-08-16.
$5,022 with Army for Combination and Miscellaneous Instruments. Signed on 2003-09-16. Completion date: 2003-10-17.
DEMATIC CORP (507 PLYMOUTH AVE NE)
$27,573 with Air Force for Miscellaneous Vehicular Components. Signed on 2006-06-21. Completion date: 2006-08-31.
TENDER LAWN CARE INC (2436 OAK INDUSTRIAL DR NE; small business) : $19,647 in 6 contractsfrom 2003 to 2004
Contracts for Landscaping/Groundskeeping Services by Army Signed by year:2000: $0; 2001: $0; 2002: $0; 2003: $9,510; 2004: $10,137; 2005: $0; 2006: $0.
Biggest contracts:
$7,261 with Army for Landscaping/Groundskeeping Services. Signed on 2004-03-23. Completion date: 2004-03-31.
$7,048, same as above.Signed on 2003-03-17. Completion date: 2004-03-31.
$2,876, same as above.Signed on 2004-03-23. Completion date: 2004-03-31.
$2,462, same as above.Signed on 2003-03-15. Completion date: 2004-03-31.
ANN & MONROE CLEANERS & COIN L (1808 MONROE AVE NW; small business) : $16,142 in 4 contractsfrom 2002 to 2004
$6,003 with Army for Laundry and DryCleaning Services. Signed on 2004-11-04. Completion date: 2005-09-30.
$5,554, same as above.Signed on 2003-11-07. Completion date: 2004-09-30.
$4,192, same as above.Signed on 2002-11-19. Completion date: 2003-09-30.
$393, same as above.Signed on 2004-08-13. Completion date: 2004-09-30.
MARTIN, JIM (2215 OAK INDUSTRIAL DR STE; small business)
$4,500 with Army for Technical Representation Services -- Musical Instruments, Phonographs, and Home-Type Radios. Signed on 2006-02-01. Completion date: 2006-03-10.
Top industries in this zip code by the number of employees in 2005:
Finance and Insurance: Direct Health and Medical Insurance Carriers (500-999 employees: 1 establishment)
Administrative and Support and Waste Management and Remediation Services: Packaging and Labeling Services (250-499: 1)
2002 - 2018 National Fire Incident Reporting System (NFIRS) incidents
According to the data from the years 2002 - 2018 the average number of fire incidents per year is 84. The highest number of reported fire incidents - 120 took place in 2002, and the least - 53 in 2014. The data has a declining trend.
When looking into fire subcategories, the most incidents belonged to: Structure Fires (53.5%), and Outside Fires (24.8%).
Fire incident types reported to NFIRS in Zip Code 49505


 Nearest zip codes: 49503, 49525, 49506, 49507, 49504, 49321.


 According to the data from the years 2002 - 2018 the average number of fire incidents per year is 84. The highest number of reported fire incidents - 120 took place in 2002, and the least - 53 in 2014. The data has a declining trend.
 When looking into fire subcategories, the most incidents belonged to: Structure Fires (53.5%), and Outside Fires (24.8%).