Estimated zip code population in 2022: 34,226 Zip code population in 2010: 31,880 Zip code population in 2000: 33,844
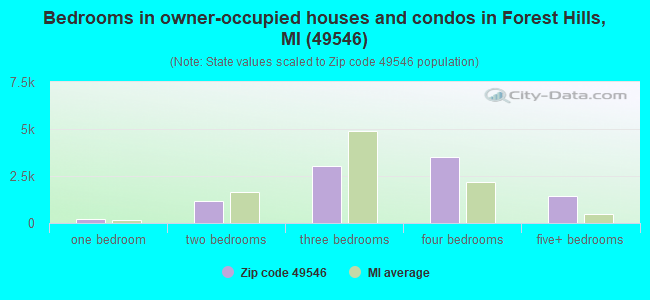
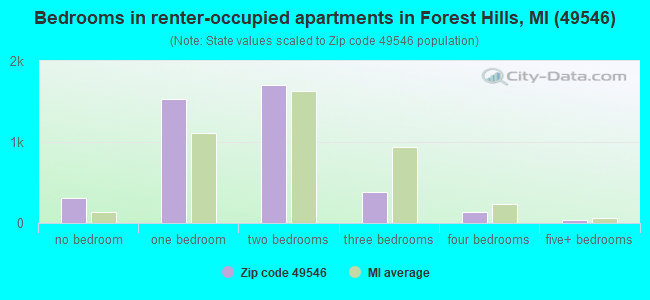
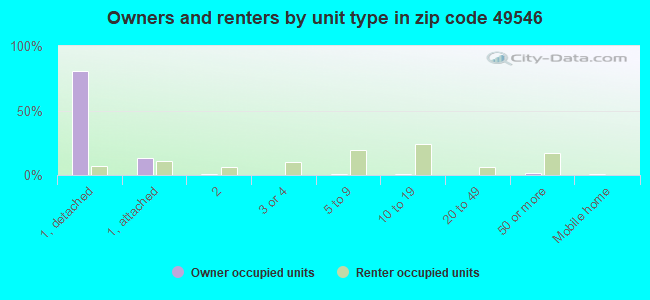
Houses and condos: 13,678 Renter-occupied apartments: 4,105
% of renters here:
31%
State:
27%
March 2022 cost of living index in zip code 49546: 87.0 (less than average, U.S. average is 100)
Land area: 18.1 sq. mi. Water area: 0.6 sq. mi.
Population density: 1,895 people per square mile
(low).
OSM Map
General Map
Google Map
MSN Map
OSM Map
General Map
Google Map
MSN Map
OSM Map
General Map
Google Map
MSN Map
OSM Map
General Map
Google Map
MSN Map
Please wait while loading the map...
Real estate property taxes paid for housing units in 2022:
This zip code:
1.1% ($4,207)
Michigan:
1.2% ($2,746)
Median real estate property taxes paid for housing units with mortgages in 2022: $4,621 (1.1%) Median real estate property taxes paid for housing units with no mortgage in 2022: $3,685 (1.0%)
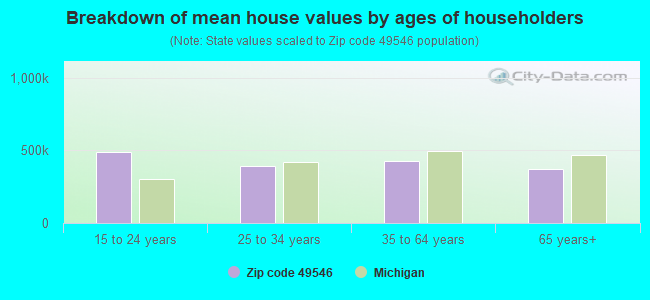
Estimated median house/condo value in 2022: $396,131
49546:
$396,131
Michigan:
$224,400
According to our research of Michigan and other state lists, there were 31 registered sex offenders living in 49546 zip code as of April 25, 2024. The ratio of all residents to sex offenders in zip code 49546 is 1,086 to 1. The ratio of registered sex offenders to all residents in this zip code is much lower than the state average.
Median resident age:
This zip code:
39.9 years
Michigan median age:
40.3 years
Average household size:
This zip code:
2.4 people
Michigan:
2.4 people
Averages for the 2020 tax year for zip code 49546, filed in 2021:
Average Adjusted Gross Income (AGI) in 2020: $131,750 (Individual Income Tax Returns)
Here:
$131,750
State:
$68,945
Salary/wage: $93,125 (reported on 76.2% of returns)
Here:
$93,125
State:
$57,142
(% of AGI for various income ranges: 1082.0% for AGIs below $25k, 3470.6% for AGIs $25k-50k, 6239.1% for AGIs $50k-75k, 8798.0% for AGIs $75k-100k, 18679.8% for AGIs $100k-200k, 98450.0% for AGIs over 200k)
Taxable interest for individuals: $2,605 (reported on 50.0% of returns)
This zip code:
$2,605
Michigan:
$1,630
(% of AGI for various income ranges: 28.2% for AGIs below $25k, 40.6% for AGIs $25k-50k, 95.0% for AGIs $50k-75k, 146.7% for AGIs $75k-100k, 268.8% for AGIs $100k-200k, 2104.2% for AGIs over 200k)
Ordinary dividends: $13,158 (reported on 36.4% of returns)
Here:
$13,158
State:
$6,972
(% of AGI for various income ranges: 73.4% for AGIs below $25k, 120.9% for AGIs $25k-50k, 306.4% for AGIs $50k-75k, 497.7% for AGIs $75k-100k, 962.2% for AGIs $100k-200k, 8201.2% for AGIs over 200k)
Net capital gain/loss in AGI: +$48,426 (reported on 33.6% of returns)
Here:
+$48,426
State:
+$20,064
(% of AGI for various income ranges: 22.2% for AGIs below $25k, 79.5% for AGIs $25k-50k, 195.4% for AGIs $50k-75k, 441.8% for AGIs $75k-100k, 1088.2% for AGIs $100k-200k, 39215.1% for AGIs over 200k)
Profit/loss from business: +$21,837 (reported on 17.1% of returns)
Here:
+$21,837
State:
+$11,172
(% of AGI for various income ranges: 93.0% for AGIs below $25k, 192.7% for AGIs $25k-50k, 283.4% for AGIs $50k-75k, 657.7% for AGIs $75k-100k, 893.9% for AGIs $100k-200k, 5034.7% for AGIs over 200k)
Taxable individual retirement arrangement distribution: $28,882 (reported on 15.9% of returns)
49546:
$28,882
Michigan:
$19,803
(% of AGI for various income ranges: 102.6% for AGIs below $25k, 241.2% for AGIs $25k-50k, 597.5% for AGIs $50k-75k, 930.0% for AGIs $75k-100k, 1737.0% for AGIs $100k-200k, 3871.9% for AGIs over 200k)
Self-employed (Keogh) retirement plans: $28,435 (reported on 1.5% of returns)
49546:
$28,435
Michigan:
$25,132
(% of AGI for various income ranges: 22.7% for AGIs $50k-75k, 54.3% for AGIs $100k-200k, 919.2% for AGIs over 200k)
Total itemized deductions: $60,730 (reported on 13.9% of returns)
Here:
$60,730
State:
$34,117
(% of AGI for various income ranges: 106.2% for AGIs below $25k, 153.6% for AGIs $25k-50k, 558.4% for AGIs $50k-75k, 751.7% for AGIs $75k-100k, 1272.9% for AGIs $100k-200k, 15981.7% for AGIs over 200k)
Charity contributions: $39,906 (reported on 12.4% of returns)
Here:
$39,906
State:
$13,548
(% of AGI for various income ranges: 10.0% for AGIs below $25k, 28.2% for AGIs $25k-50k, 101.8% for AGIs $50k-75k, 182.4% for AGIs $75k-100k, 442.4% for AGIs $100k-200k, 11409.8% for AGIs over 200k)
Taxes paid: $8,506 (reported on 13.9% of returns)
49546:
$8,506
State:
$7,972
(% of AGI for various income ranges: 13.7% for AGIs below $25k, 31.9% for AGIs $25k-50k, 108.2% for AGIs $50k-75k, 179.3% for AGIs $75k-100k, 339.2% for AGIs $100k-200k, 1615.9% for AGIs over 200k)
Earned income credit: $2,179 (reported on 7.9% of returns)
Here:
$2,179
State:
$2,251
(% of AGI for various income ranges: 61.1% for AGIs below $25k, 51.3% for AGIs $25k-50k)
Percentage of individuals using paid preparers for their 2020 taxes: 93.0%
Here:
93%
State:
93%
(% for various income ranges: 91.3% for AGIs below $25k, 93.0% for AGIs $25k-50k, 93.4% for AGIs $50k-75k, 92.9% for AGIs $75k-100k, 93.3% for AGIs $100k-200k, 96.1% for AGIs over 200k)
Averages for the 2012 tax year for zip code 49546, filed in 2013:
Average Adjusted Gross Income (AGI) in 2012: $101,092 (Individual Income Tax Returns)
Here:
$101,092
State:
$55,609
Salary/wage: $76,546 (reported on 77.3% of returns)
Here:
$76,546
State:
$46,782
(% of AGI for various income ranges: 68.8% for AGIs below $25k, 67.6% for AGIs $25k-50k, 61.5% for AGIs $50k-75k, 65.7% for AGIs $75k-100k, 71.3% for AGIs $100k-200k, 49.6% for AGIs over 200k)
Taxable interest for individuals: $2,886 (reported on 50.9% of returns)
This zip code:
$2,886
Michigan:
$1,491
(% of AGI for various income ranges: 2.4% for AGIs below $25k, 1.7% for AGIs $25k-50k, 1.4% for AGIs $50k-75k, 1.3% for AGIs $75k-100k, 1.0% for AGIs $100k-200k, 1.6% for AGIs over 200k)
Ordinary dividends: $14,382 (reported on 36.6% of returns)
Here:
$14,382
State:
$6,225
(% of AGI for various income ranges: 4.6% for AGIs below $25k, 3.4% for AGIs $25k-50k, 4.1% for AGIs $50k-75k, 3.4% for AGIs $75k-100k, 3.3% for AGIs $100k-200k, 6.7% for AGIs over 200k)
Net capital gain/loss in AGI: +$22,463 (reported on 31.6% of returns)
Here:
+$22,463
State:
+$9,326
(% of AGI for various income ranges: 0.4% for AGIs $25k-50k, 0.9% for AGIs $50k-75k, 1.1% for AGIs $75k-100k, 2.1% for AGIs $100k-200k, 12.3% for AGIs over 200k)
Profit/loss from business: +$23,974 (reported on 16.5% of returns)
Here:
+$23,974
State:
+$11,523
(% of AGI for various income ranges: 6.9% for AGIs below $25k, 4.6% for AGIs $25k-50k, 3.7% for AGIs $50k-75k, 4.0% for AGIs $75k-100k, 4.3% for AGIs $100k-200k, 3.5% for AGIs over 200k)
Taxable individual retirement arrangement distribution: $22,325 (reported on 18.2% of returns)
49546:
$22,325
Michigan:
$15,298
(% of AGI for various income ranges: 6.9% for AGIs below $25k, 5.7% for AGIs $25k-50k, 7.0% for AGIs $50k-75k, 5.8% for AGIs $75k-100k, 5.4% for AGIs $100k-200k, 2.3% for AGIs over 200k)
Self-employment retirement plans: $25,584 (reported on 1.7% of returns)
49546:
$25,584
Michigan:
$20,834
(% of AGI for various income ranges: 0.4% for AGIs $50k-75k, 0.4% for AGIs $100k-200k, 0.6% for AGIs over 200k)
Total itemized deductions: $31,821 (17% of AGI, reported on 45.3% of returns)
Here:
$31,821
State:
$21,628
Here:
16.9% of AGI
State:
18.4% of AGI
(% of AGI for various income ranges: 15.2% for AGIs below $25k, 13.9% for AGIs $25k-50k, 16.8% for AGIs $50k-75k, 16.9% for AGIs $75k-100k, 16.8% for AGIs $100k-200k, 12.4% for AGIs over 200k)
Charity contributions: $9,125 (reported on 41.0% of returns)
Here:
$9,125
State:
$4,225
(% of AGI for various income ranges: 1.6% for AGIs below $25k, 2.4% for AGIs $25k-50k, 3.2% for AGIs $50k-75k, 3.0% for AGIs $75k-100k, 3.5% for AGIs $100k-200k, 4.3% for AGIs over 200k)
Taxes paid: $12,782 (reported on 45.3% of returns)
49546:
$12,782
State:
$8,327
(% of AGI for various income ranges: 2.9% for AGIs below $25k, 3.5% for AGIs $25k-50k, 5.1% for AGIs $50k-75k, 5.9% for AGIs $75k-100k, 6.9% for AGIs $100k-200k, 5.7% for AGIs over 200k)
Earned income credit: $2,198 (reported on 10.2% of returns)
Here:
$2,198
State:
$2,306
(% of AGI for various income ranges: 4.6% for AGIs below $25k, 0.8% for AGIs $25k-50k)
Percentage of individuals using paid preparers for their 2012 taxes: 55.8%
Here:
56%
State:
57%
(% for various income ranges: 48.5% for AGIs below $25k, 55.0% for AGIs $25k-50k, 59.6% for AGIs $50k-75k, 57.9% for AGIs $75k-100k, 56.4% for AGIs $100k-200k, 78.5% for AGIs over 200k)
Averages for the 2004 tax year for zip code 49546, filed in 2005:
Average Adjusted Gross Income (AGI) in 2004: $85,426 (Individual Income Tax Returns)
Here:
$85,426
State:
$48,204
Salary/wage: $65,417 (reported on 77.4% of returns)
Here:
$65,417
State:
$42,791
(% of AGI for various income ranges: 132.1% for AGIs below $10k, 65.2% for AGIs $10k-25k, 66.9% for AGIs $25k-50k, 68.1% for AGIs $50k-75k, 71.9% for AGIs $75k-100k, 54.6% for AGIs over 100k)
Taxable interest for individuals: $3,835 (reported on 61.3% of returns)
This zip code:
$3,835
Michigan:
$1,725
(% of AGI for various income ranges: 12.5% for AGIs below $10k, 5.6% for AGIs $10k-25k, 3.7% for AGIs $25k-50k, 2.9% for AGIs $50k-75k, 2.6% for AGIs $75k-100k, 2.4% for AGIs over 100k)
Taxable dividends: $7,107 (reported on 44.8% of returns)
Here:
$7,107
State:
$3,420
(% of AGI for various income ranges: 13.3% for AGIs below $10k, 4.9% for AGIs $10k-25k, 3.8% for AGIs $25k-50k, 3.7% for AGIs $50k-75k, 3.1% for AGIs $75k-100k, 3.7% for AGIs over 100k)
Net capital gain/loss: +$16,438 (reported on 38.2% of returns)
Here:
+$16,438
State:
+$8,532
(% of AGI for various income ranges: -7.3% for AGIs below $10k, 0.2% for AGIs $10k-25k, 1.1% for AGIs $25k-50k, 1.6% for AGIs $50k-75k, 2.3% for AGIs $75k-100k, 9.9% for AGIs over 100k)
Profit/loss from business: +$21,319 (reported on 16.3% of returns)
Here:
+$21,319
State:
+$9,547
(% of AGI for various income ranges: -4.7% for AGIs below $10k, 4.2% for AGIs $10k-25k, 4.1% for AGIs $25k-50k, 4.3% for AGIs $50k-75k, 4.4% for AGIs $75k-100k, 4.1% for AGIs over 100k)
Profit/loss from farming: +$214 (reported on 0.1% of returns)
Here:
+$214
State:
-$4,492
IRA payment deduction: $3,215 (reported on 2.8% of returns)
49546:
$3,215
Michigan:
$2,875
(% of AGI for various income ranges: 0.3% for AGIs $10k-25k, 0.3% for AGIs $25k-50k, 0.2% for AGIs $50k-75k, 0.2% for AGIs $75k-100k, 0.0% for AGIs over 100k)
Self-employed pension: $18,805 (reported on 2.3% of returns)
Here:
$18,805
Michigan:
$13,826
(% of AGI for various income ranges: 0.2% for AGIs $25k-50k, 0.2% for AGIs $50k-75k, 0.3% for AGIs $75k-100k, 0.6% for AGIs over 100k)
Total itemized deductions: $32,548 (22% of AGI, reported on 50.2% of returns)
Here:
$32,548
State:
$18,509
Here:
21.9% of AGI
State:
20.7% of AGI
(% of AGI for various income ranges: 27.1% for AGIs below $10k, 19.2% for AGIs $10k-25k, 19.4% for AGIs $25k-50k, 19.8% for AGIs $50k-75k, 20.5% for AGIs $75k-100k, 18.8% for AGIs over 100k)
Charity contributions deductions: $7,670 (5% of AGI, reported on 46.7% of returns)
Here:
$7,670
State:
$3,365
Here:
5.3% of AGI
State:
3.6% of AGI
(% of AGI for various income ranges: 1.9% for AGIs below $10k, 2.9% for AGIs $10k-25k, 3.3% for AGIs $25k-50k, 3.7% for AGIs $50k-75k, 4.0% for AGIs $75k-100k, 4.5% for AGIs over 100k)
Total tax: $21,734 (reported on 76.6% of returns)
49546:
$21,734
State:
$7,691
(% of AGI for various income ranges: 4.1% for AGIs below $10k, 3.9% for AGIs $10k-25k, 7.0% for AGIs $25k-50k, 8.9% for AGIs $50k-75k, 9.5% for AGIs $75k-100k, 24.3% for AGIs over 100k)
Earned income credit: $1,735 (reported on 8.0% of returns)
Here:
$1,735
State:
$1,737
Percentage of individuals using paid preparers for their 2004 taxes: 56.8%
Here:
57%
State:
60%
(% for various income ranges: 47.0% for AGIs below $10k, 53.5% for AGIs $10k-25k, 58.9% for AGIs $25k-50k, 60.0% for AGIs $50k-75k, 55.8% for AGIs $75k-100k, 67.2% for AGIs over 100k)
Likely homosexual households (counted as self-reported same-sex unmarried-partner households)
Lesbian couples: 0.1% of all households
Gay men: 0.2% of all households
Household received Food Stamps/SNAP in the past 12 months: 612 Household did not receive Food Stamps/SNAP in the past 12 months: 12,750
Women who had a birth in the past 12 months: 408 (395 now married, 21 unmarried) Women who did not have a birth in the past 12 months: 7,304 (3,154 now married, 4,144 unmarried)
Housing units in zip code 49546 with a mortgage: 5,303 (819 second mortgage, 6 home equity loan, 816 both second mortgage and home equity loan) Houses without a mortgage: 126
Median monthly owner costs for units with a mortgage: $1,951 Median monthly owner costs for units without a mortgage: $757
Residents with income below the poverty level in 2022:
This zip code:
8.0%
Whole state:
13.4%
Residents with income below 50% of the poverty level in 2022:
This zip code:
3.7%
Whole state:
6.9%
Median number of rooms in houses and condos:
Here:
8.3
State:
6.5
Median number of rooms in apartments:
Here:
3.5
State:
4.3
Notable locations in this zip code not listed on our city pages
Notable locations in zip code 49546: Forest Hills Country Club (A), Cascade Country Club (B), Prince Conference Center (C), DeVos Communication Center (D), Huizenga Tennis and Track Center (E), Van Noord Arena (F), Hoogenboom Health and Recreation Center (G), Venema Aquatic Center (H), North Hall (I), Science Building (J), DeVries Hall (K), DeWit Manor (L), Spoelhof Center (M), Hiemenga Hall (N), Hekman Library (O), Commons and Commons Annex (P), Bolt Hall (Q), Heyns Hall (R), Timmer Hall (S), Rooks Hall (T). Display/hide their locations on the map
Churches in zip code 49546 include: First Free Church (A), The Open Bible Church (B), White Hills Bible Church (C), Genesis United Methodist Church (D), Christ Community Church (E), Woodland Drive-In Church (F), Saint Nicholas Antiochian Church (G), Our Savior Lutheran Church (H), Saint Paul the Apostle Church (I). Display/hide their locations on the map
Lakes: Walden Lake (A), Paradise Lake (B), Laraway Lake (C), Wood Lake (D), Hidden Lake (E), Echo Lake (F), East Lake (G), Lake Eastbrook (H). Display/hide their locations on the map
Parks in zip code 49546 include: Cascade Christian Church Historical Marker (1), Cascade Township Hall Historical Marker (2), Calvin College and Seminary Historical Marker (3), Forest Hill Park (4), Northeast Park (5), Ridgemoor Park (6), Camelot Park (7). Display/hide their locations on the map
Tourist attractions (not listed on the city page) : Global Vacation Network (3949 Sparks Drive Southeast) (1), International Tours & Cruises (Tours & Charters; 6809 Cascade Road Southeast Suite B) (2). Display/hide their approximate locations on the map
6,097 married couples with children.
1,288 single-parent households (276 men, 1,012 women).
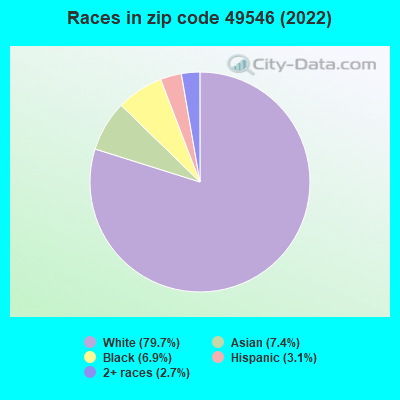
86.5% of residents of 49546 zip code speak English at home.
2.1% of residents speak Spanish at home (73% very well, 15% well, 11% not well).
5.2% of residents speak other Indo-European language at home (70% very well, 20% well, 5% not well, 5% not at all).
4.3% of residents speak Asian or Pacific Island language at home (39% very well, 45% well, 15% not well).
2.3% of residents speak other language at home (44% very well, 34% well, 14% not well, 8% not at all).
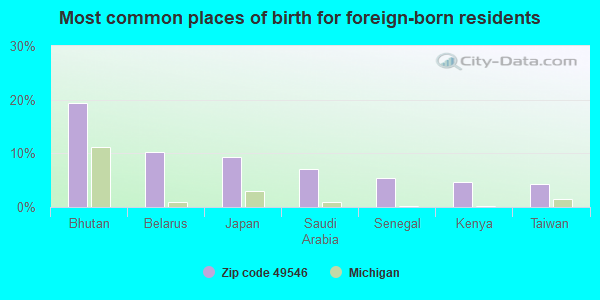
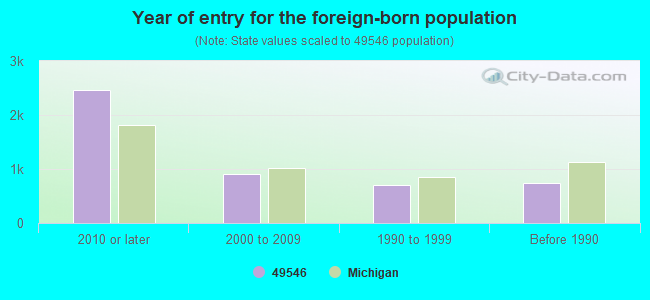
Foreign born population: 4,372 (12.8%) (48.4% of them are naturalized citizens)
Major facilities with environmental interests located in this zip code:
ADA ELEMENTARY SCHOOL (731 ADA DRIVE SE in GRAND RAPIDS, MI)
(National Center for Education Statistics) - STATE ID-00014 Organizations: FOREST HILLS PUBLIC SCHOOLS (SCHOOL DISTRICT)
ALLIANCE ACADEMY OF CINCINNATI (5211 CASCADE RD SE in GRAND RAPIDS, MI)
(National Center for Education Statistics) - STATE ID-000139
MEADOW BROOK ELEMENTARY SCHOOL (1450 FOREST HILL AVENUE SE in GRAND RAPIDS, MI)
(National Center for Education Statistics) - STATE ID-07638 Organizations: FOREST HILLS PUBLIC SCHOOLS (SCHOOL DISTRICT)
FOREST HILLS CENTRAL HIGH SCHOOL (5901 HALL STREET SE in GRAND RAPIDS, MI)
(National Center for Education Statistics) - STATE ID-01265 Organizations: FOREST HILLS PUBLIC SCHOOLS (SCHOOL DISTRICT)
CENTRAL MIDDLE SCHOOL (5810 ADA DRIVE SE in GRAND RAPIDS, MI)
(National Center for Education Statistics) - STATE ID-01264 Organizations: FOREST HILLS PUBLIC SCHOOLS (SCHOOL DISTRICT)
CENTRAL WOODLANDS 5/6 SCHOOL (400 ALTA DALE SE in GRAND RAPIDS, MI)
(National Center for Education Statistics) - STATE ID-08542 Organizations: FOREST HILLS PUBLIC SCHOOLS (SCHOOL DISTRICT)
ABLE ENVIRO TECH SVCS INC (2680 HORIZON SE in GRAND RAPIDS, MI)
(Resource Conservation and Recovery Act (tracking hazardous waste))
AMOCO OIL CO GARYS CASCADE SVC STA (6895 CASCADE RD SE in GRAND RAPIDS, MI)
(Resource Conservation and Recovery Act (tracking hazardous waste))
DIAMOND OIL DISTRIBUTORS (4875 STARR SE in GRAND RAPIDS, MI)
(Resource Conservation and Recovery Act (tracking hazardous waste))
DR JAMES ELDERSVELD DDS (4500 CASCADE SE in GRAND RAPIDS, MI)
(Resource Conservation and Recovery Act (tracking hazardous waste))
BELL CLEANERS (6471 28TH ST SE in GRAND RAPIDS, MI)
Small Quantity Generators, between 100 kg and 1000 kg of hazardous waste/month (Resource Conservation and Recovery Act (tracking hazardous waste)) Organizations: RAY/THOMAS/DAN BELL (CONTACT/OWNER)
BEST CLEANERS (5925 28TH ST SE, SUITE D in GRAND RAPIDS, MI)
Conditionally Exempt Small Quantity Generators, less than 100 kg/month of hazardous waste (Resource Conservation and Recovery Act (tracking hazardous waste)) - notification Organizations: JAE CHOI (CONTACT/OWNER)
BETTEN IMPORTS (5901 28TH ST SE in GRAND RAPIDS, MI)
Conditionally Exempt Small Quantity Generators, less than 100 kg/month of hazardous waste (Resource Conservation and Recovery Act (tracking hazardous waste)) Organizations: MARION BETTEN (CONTACT/OPERATOR)
Housing units lacking complete plumbing facilities: 0.8% Housing units lacking complete kitchen facilities: 3.1%
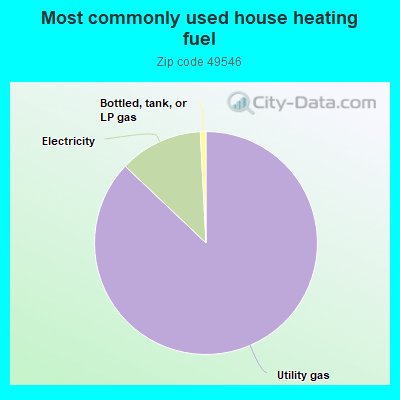
86.5%Utility gas
12.0%Electricity
0.8%Bottled, tank, or LP gas
Population in 1990: 25,471. Population change in the 1990s: +8,373 (+32.9%).
Place of birth for U.S.-born residents:
This state: 20,862
Northeast: 1,591
Midwest: 4,196
South: 1,402
West: 1,637
53% of the 49546 zip code residents lived in the same house 5 years ago. Out of people who lived in different houses, 57% lived in this county. Out of people who lived in different counties, 50% lived in Michigan.
88% of the 49546 zip code residents lived in the same house 1 year ago. Out of people who lived in different houses, 51% moved from this county. Out of people who lived in different houses, 21% moved from different county within same state. Out of people who lived in different houses, 23% moved from different state. Out of people who lived in different houses, 6% moved from abroad.
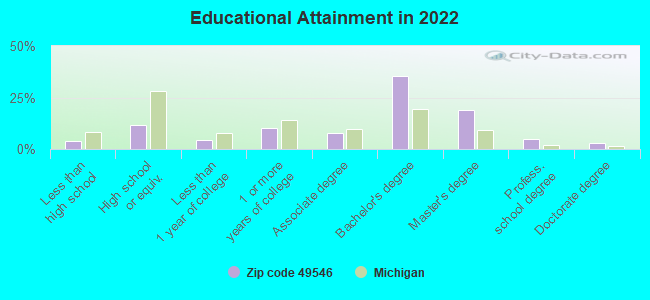
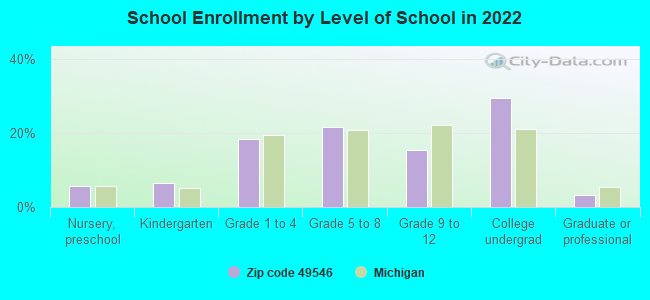
Private vs. public school enrollment:
Students in private schools in grades 1 to 8 (elementary and middle school): 835
Here:
21.9%
Michigan:
12.4%
Students in private schools in grades 9 to 12 (high school): 276
Here:
18.8%
Michigan:
9.8%
Students in private undergraduate colleges: 1,929
Here:
70.7%
Michigan:
14.9%
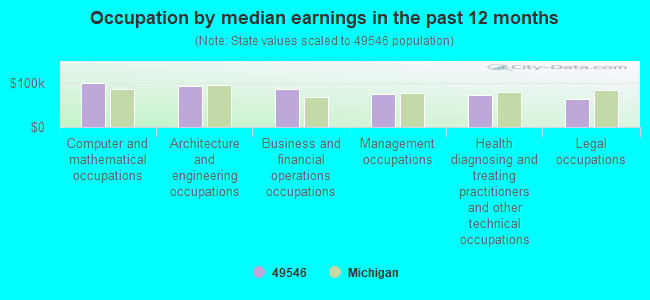
Occupation by median earnings in the past 12 months ($)
99,566Computer and mathematical occupations
93,027Architecture and engineering occupations
85,173Business and financial operations occupations
75,687Management occupations
71,704Health diagnosing and treating practitioners and other technical occupations
64,433Legal occupations
Companies with federal contracts located in this zip code (GRAND RAPIDS, MI):
FISHBECK, THOMPSON, CARR & HUB (1515 ARBORETUM DRIVE, S E; small business) : $15,903,828 in 28 contractsfrom 2000 to 2006
Contracts for Maintenance, Repair and Rebuilding of Equipment -- Water Purification and Sewage Treatment Equipment, Operation of Government-Owned Facilities -- Waste Treatment and Storage Facilities by U.S. Army Corps of Engineers - civil program financing only, Army Signed by year:2000: $1,996,311; 2001: $2,474,538; 2002: $2,008,493; 2003: $2,293,936; 2004: $3,320,756; 2005: $3,875,576; 2006: -$65,782.
Biggest contracts:
$2,345,200 with U.S. Army Corps of Engineers - civil program financing only for Maintenance, Repair and Rebuilding of Equipment -- Water Purification and Sewage Treatment Equipment. Signed on 2003-08-27. Completion date: 2002-09-20.
$2,086,572, same as above.Signed on 2000-08-23. Completion date: 2001-08-25.
$2,062,804, same as above.Signed on 2001-09-06. Completion date: 2002-09-20.
$1,926,410, same as above.Signed on 2002-09-19. Completion date: 2002-09-20.
URS GROUP, INC (3950 SPARKS DRIVE, SE) : $783,778 in 6 contractsfrom 2001 to 2002
Contracts for Architect - Engineer Services (including landscaping, interior layout, and designing) by Army Signed by year:2000: $0; 2001: $703,689; 2002: $80,089; 2003: $0; 2004: $0; 2005: $0; 2006: $0.
Biggest contracts:
$459,380 with Army for Architect - Engineer Services (including landscaping, interior layout, and designing). Signed on 2001-09-28. Completion date: 2002-02-21.
$244,309, same as above.Signed on 2001-05-23. Completion date: 2002-02-21.
$74,027 with Army for Architect - Engineer Services (including landscaping, interior layout, and designing). Taking place in DC. Signed on 2002-05-09. Completion date: 2003-11-28.
$6,062, same as above.Signed on 2002-09-30. Completion date: 2003-11-28.
INDEPENDENT TELECOMMUNICATION (4079 PARK EAST CT SE; small business) : $185,101 in 5 contractsfrom 2003 to 2006
Contracts for ADP Software, Communications Security Equipment and Components by Army Signed by year:2000: $0; 2001: $0; 2002: $0; 2003: $22,420; 2004: $130,866; 2005: $9,234; 2006: $22,581.
Biggest contracts:
$116,975 with Army for ADP Software. Signed on 2004-08-04. Completion date: 2004-09-03.
$22,581 with Army for Communications Security Equipment and Components. Signed on 2006-02-10. Completion date: 2006-09-30.
$22,420 with Army for ADP Software. Signed on 2003-09-12. Completion date: 2003-09-30.
$13,891, same as above.Signed on 2004-03-24. Completion date: 2004-05-28.
CYCLE-SAFE, INC. (478 ARROWHEAD SE; small business) : $59,802 in 4 contractsfrom 2003 to 2006
$37,118 with Navy for Wallboard, Building Paper, and Thermal Insulation Materials. Signed on 2004-03-26. Completion date: 2004-05-03.
$11,439 with Navy for Miscellaneous Prefabricated Structures. Signed on 2003-01-29. Completion date: 2003-02-06.
$11,216 with Department of Veterans Affairs for Recreational and Gymnastic Equipment. Taking place in CA. Signed on 2006-09-15. Completion date: 2006-10-30.
$29 with Department of Veterans Affairs for Electronic Modules. Taking place in CA. Signed on 2006-08-08. Completion date: 2006-08-18.
SUNSTONE HOTEL INVESTORS LLC (5700 28TH ST SE) : $18,586 in 3 contractsfrom 2004 to 2005
$15,000 with Army for Lodging - Hotel/Motel. Signed on 2005-06-23. Completion date: 2005-06-12.
$3,986, same as above.Signed on 2004-05-05. Completion date: 2004-05-16.
-$400, same as above.Signed on 2004-06-17. Completion date: 2004-05-16.
CENTURY MASONARY CO (2337 GROUSE CT SE; small business)
$9,050 with Navy for Saws and Filing Machines. Taking place in CA. Signed on 2005-07-29. Completion date: 2005-08-25.
Top industries in this zip code by the number of employees in 2005:
Administrative and Support and Waste Management and Remediation Services: Temporary Help Services (500-999 employees: 2 establishments, 100-249 employees: 4 establishments, 50-99 employees: 3 establishments, 1-4 employees: 2 establishments)
Educational Services: Colleges, Universities, and Professional Schools (over 1000: 1, 100-249: 1)
Educational Services: Elementary and Secondary Schools (over 1000: 1)
Health Care and Social Assistance: Offices of Physicians (except Mental Health Specialists) (20-49: 19, 10-19: 15, 5-9: 21, 1-4: 25)
Management of Companies and Enterprises: Corporate, Subsidiary, and Regional Managing Offices (250-499: 1, 100-249: 1, 50-99: 2, 20-49: 4, 10-19: 5, 5-9: 2, 1-4: 4)
2002 - 2018 National Fire Incident Reporting System (NFIRS) incidents
Based on the data from the years 2002 - 2018 the average number of fires per year is 58. The highest number of reported fires - 90 took place in 2002, and the least - 41 in 2013. The data has a decreasing trend.
When looking into fire subcategories, the most incidents belonged to: Structure Fires (49.3%), and Mobile Property/Vehicle Fires (26.7%).
Fire incident types reported to NFIRS in Zip Code 49546


+$214
-$4,492
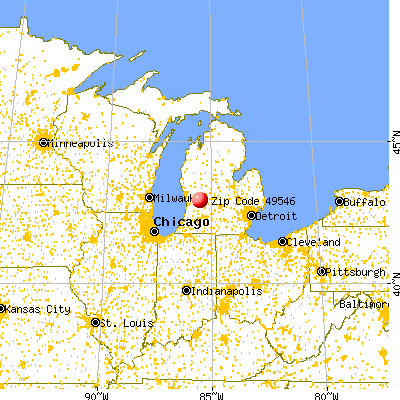
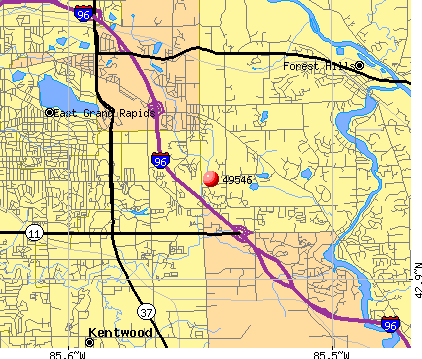 Nearest zip codes: 49512, 49301, 49506, 49508, 49525, 49507.


 Based on the data from the years 2002 - 2018 the average number of fires per year is 58. The highest number of reported fires - 90 took place in 2002, and the least - 41 in 2013. The data has a decreasing trend.
 When looking into fire subcategories, the most incidents belonged to: Structure Fires (49.3%), and Mobile Property/Vehicle Fires (26.7%).