Estimated zip code population in 2022: 2,806 Zip code population in 2010: 2,445 Zip code population in 2000: 2,074
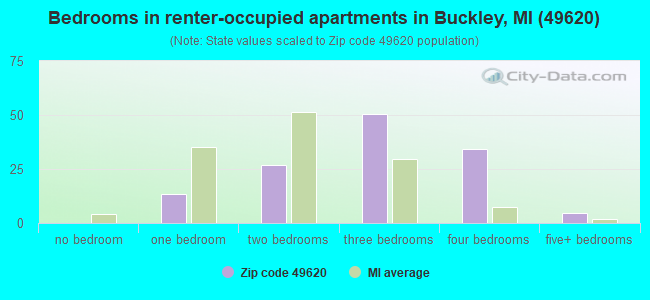
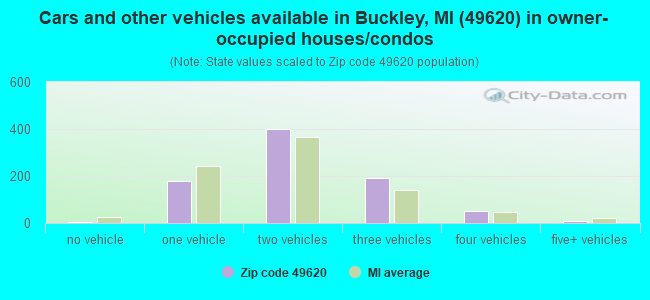
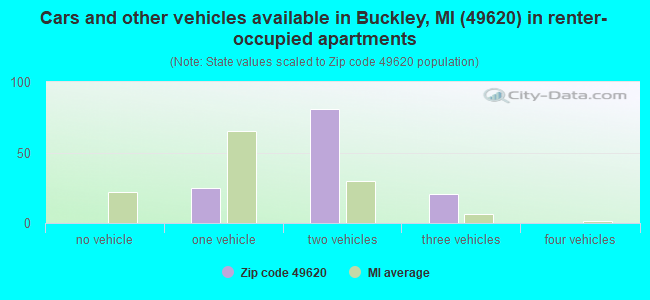
Houses and condos: 1,107 Renter-occupied apartments: 128
% of renters here:
13%
State:
27%
March 2022 cost of living index in zip code 49620: 81.8 (low, U.S. average is 100)
Land area: 52.3 sq. mi. Water area: 0.3 sq. mi.
Population density: 54 people per square mile
(very low).
OSM Map
General Map
Google Map
MSN Map
OSM Map
General Map
Google Map
MSN Map
OSM Map
General Map
Google Map
MSN Map
OSM Map
General Map
Google Map
MSN Map
Please wait while loading the map...
Real estate property taxes paid for housing units in 2022:
This zip code:
0.9% ($1,830)
Michigan:
1.2% ($2,746)
Median real estate property taxes paid for housing units with mortgages in 2022: $1,731 (0.8%) Median real estate property taxes paid for housing units with no mortgage in 2022: $2,016 (1.1%)
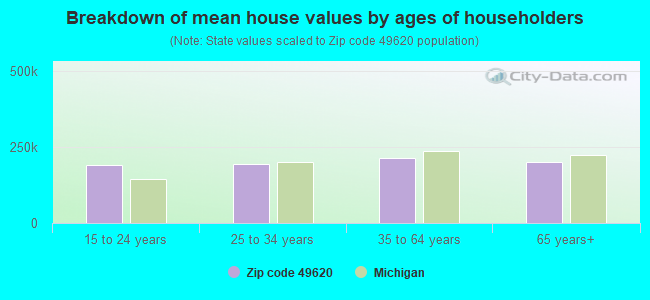
Estimated median house/condo value in 2022: $201,078
49620:
$201,078
Michigan:
$224,400
According to our research of Michigan and other state lists, there were 10 registered sex offenders living in 49620 zip code as of April 19, 2024. The ratio of all residents to sex offenders in zip code 49620 is 272 to 1. The ratio of registered sex offenders to all residents in this zip code is near the state average.
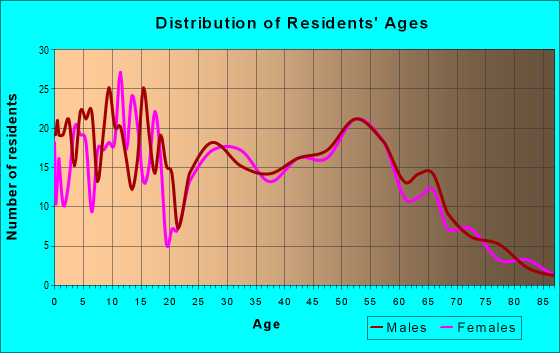
Median resident age:
This zip code:
37.2 years
Michigan median age:
40.3 years
Average household size:
This zip code:
2.9 people
Michigan:
2.4 people
Averages for the 2020 tax year for zip code 49620, filed in 2021:
Average Adjusted Gross Income (AGI) in 2020: $50,566 (Individual Income Tax Returns)
Here:
$50,566
State:
$68,945
Salary/wage: $43,901 (reported on 82.0% of returns)
Here:
$43,901
State:
$57,142
(% of AGI for various income ranges: 1024.1% for AGIs below $25k, 3252.1% for AGIs $25k-50k, 5800.6% for AGIs $50k-75k, 9340.0% for AGIs $75k-100k, 15832.2% for AGIs $100k-200k)
Taxable interest for individuals: $745 (reported on 23.3% of returns)
This zip code:
$745
Michigan:
$1,630
(% of AGI for various income ranges: 12.2% for AGIs below $25k, 11.2% for AGIs $25k-50k, 40.0% for AGIs $50k-75k, 32.0% for AGIs $75k-100k, 62.2% for AGIs $100k-200k)
Ordinary dividends: $1,333 (reported on 11.3% of returns)
Here:
$1,333
State:
$6,972
(% of AGI for various income ranges: 4.4% for AGIs below $25k, 8.8% for AGIs $25k-50k, 50.0% for AGIs $50k-75k, 75.6% for AGIs $100k-200k)
Net capital gain/loss in AGI: +$6,407 (reported on 11.3% of returns)
Here:
+$6,407
State:
+$20,064
(% of AGI for various income ranges: 12.4% for AGIs $25k-50k, 51.7% for AGIs $50k-75k, 924.4% for AGIs $100k-200k)
Profit/loss from business: +$10,757 (reported on 17.3% of returns)
Here:
+$10,757
State:
+$11,172
(% of AGI for various income ranges: 226.7% for AGIs below $25k, 122.4% for AGIs $25k-50k, 109.4% for AGIs $50k-75k, 389.0% for AGIs $75k-100k, 955.6% for AGIs $100k-200k)
Taxable individual retirement arrangement distribution: $13,029 (reported on 10.5% of returns)
49620:
$13,029
Michigan:
$19,803
(% of AGI for various income ranges: 82.6% for AGIs below $25k, 59.4% for AGIs $25k-50k, 188.3% for AGIs $50k-75k, 491.0% for AGIs $75k-100k, 632.2% for AGIs $100k-200k)
Total itemized deductions: $23,700 (reported on 3.0% of returns)
Here:
$23,700
State:
$34,117
(% of AGI for various income ranges: 948.0% for AGIs $75k-100k)
Charity contributions: $7,900 (reported on 2.3% of returns)
Here:
$7,900
State:
$13,548
(% of AGI for various income ranges: 131.7% for AGIs $50k-75k)
Taxes paid: $6,150 (reported on 3.0% of returns)
49620:
$6,150
State:
$7,972
(% of AGI for various income ranges: 273.3% for AGIs $100k-200k)
Earned income credit: $2,192 (reported on 18.8% of returns)
Here:
$2,192
State:
$2,251
(% of AGI for various income ranges: 98.5% for AGIs below $25k, 82.9% for AGIs $25k-50k)
Percentage of individuals using paid preparers for their 2020 taxes: 92.5%
Here:
92%
State:
93%
(% for various income ranges: 87.8% for AGIs below $25k, 95.1% for AGIs $25k-50k, 95.5% for AGIs $50k-75k, 92.9% for AGIs $75k-100k, 93.3% for AGIs $100k-200k)
Averages for the 2012 tax year for zip code 49620, filed in 2013:
Average Adjusted Gross Income (AGI) in 2012: $36,251 (Individual Income Tax Returns)
Here:
$36,251
State:
$55,609
Salary/wage: $33,266 (reported on 84.0% of returns)
Here:
$33,266
State:
$46,782
(% of AGI for various income ranges: 77.8% for AGIs below $25k, 79.8% for AGIs $25k-50k, 83.5% for AGIs $50k-75k, 82.4% for AGIs $75k-100k, 58.9% for AGIs $100k-200k)
Taxable interest for individuals: $408 (reported on 21.8% of returns)
This zip code:
$408
Michigan:
$1,491
(% of AGI for various income ranges: 0.3% for AGIs below $25k, 0.3% for AGIs $25k-50k, 0.1% for AGIs $50k-75k, 0.3% for AGIs $75k-100k, 0.3% for AGIs $100k-200k)
Ordinary dividends: $954 (reported on 10.9% of returns)
Here:
$954
State:
$6,225
(% of AGI for various income ranges: 0.2% for AGIs below $25k, 0.5% for AGIs $25k-50k, 0.2% for AGIs $50k-75k, 0.5% for AGIs $75k-100k)
Net capital gain/loss in AGI: +$2,191 (reported on 9.2% of returns)
Here:
+$2,191
State:
+$9,326
(% of AGI for various income ranges: 0.2% for AGIs $25k-50k, 3.2% for AGIs $75k-100k)
Profit/loss from business: +$8,465 (reported on 16.8% of returns)
Here:
+$8,465
State:
+$11,523
(% of AGI for various income ranges: 4.8% for AGIs below $25k, 4.0% for AGIs $25k-50k, 2.1% for AGIs $50k-75k, 9.5% for AGIs $75k-100k)
Taxable individual retirement arrangement distribution: $7,656 (reported on 7.6% of returns)
49620:
$7,656
Michigan:
$15,298
(% of AGI for various income ranges: 2.0% for AGIs below $25k, 1.7% for AGIs $25k-50k, 3.6% for AGIs $50k-75k)
Total itemized deductions: $15,438 (23% of AGI, reported on 20.2% of returns)
Here:
$15,438
State:
$21,628
Here:
23.4% of AGI
State:
18.4% of AGI
(% of AGI for various income ranges: 7.1% for AGIs below $25k, 7.5% for AGIs $25k-50k, 9.1% for AGIs $50k-75k, 10.8% for AGIs $75k-100k, 8.9% for AGIs $100k-200k)
Charity contributions: $2,500 (reported on 15.1% of returns)
Here:
$2,500
State:
$4,225
(% of AGI for various income ranges: 0.6% for AGIs below $25k, 0.7% for AGIs $25k-50k, 1.1% for AGIs $50k-75k, 1.8% for AGIs $75k-100k, 1.0% for AGIs $100k-200k)
Taxes paid: $4,476 (reported on 21.0% of returns)
49620:
$4,476
State:
$8,327
(% of AGI for various income ranges: 1.3% for AGIs below $25k, 1.8% for AGIs $25k-50k, 2.7% for AGIs $50k-75k, 3.4% for AGIs $75k-100k, 4.0% for AGIs $100k-200k)
Earned income credit: $2,200 (reported on 25.2% of returns)
Here:
$2,200
State:
$2,306
(% of AGI for various income ranges: 7.4% for AGIs below $25k, 1.4% for AGIs $25k-50k)
Percentage of individuals using paid preparers for their 2012 taxes: 53.8%
Here:
54%
State:
57%
(% for various income ranges: 50.0% for AGIs below $25k, 54.5% for AGIs $25k-50k, 56.2% for AGIs $50k-75k, 55.6% for AGIs $75k-100k, 80.0% for AGIs $100k-200k)
Averages for the 2004 tax year for zip code 49620, filed in 2005:
Average Adjusted Gross Income (AGI) in 2004: $31,308 (Individual Income Tax Returns)
Here:
$31,308
State:
$48,204
Salary/wage: $29,250 (reported on 87.0% of returns)
Here:
$29,250
State:
$42,791
(% of AGI for various income ranges: 114.5% for AGIs below $10k, 80.5% for AGIs $10k-25k, 83.0% for AGIs $25k-50k, 86.8% for AGIs $50k-75k, 76.1% for AGIs $75k-100k, 53.8% for AGIs over 100k)
Taxable interest for individuals: $787 (reported on 35.9% of returns)
This zip code:
$787
Michigan:
$1,725
(% of AGI for various income ranges: 3.2% for AGIs below $10k, 1.1% for AGIs $10k-25k, 1.1% for AGIs $25k-50k, 0.3% for AGIs $50k-75k, 0.9% for AGIs $75k-100k, 0.9% for AGIs over 100k)
Taxable dividends: $731 (reported on 14.6% of returns)
Here:
$731
State:
$3,420
(% of AGI for various income ranges: 0.8% for AGIs below $10k, 0.4% for AGIs $10k-25k, 0.4% for AGIs $25k-50k, 0.1% for AGIs $50k-75k, 0.9% for AGIs $75k-100k)
Net capital gain/loss: +$4,423 (reported on 12.9% of returns)
Here:
+$4,423
State:
+$8,532
(% of AGI for various income ranges: -1.4% for AGIs below $10k, 1.2% for AGIs $10k-25k, 1.3% for AGIs $25k-50k, 0.8% for AGIs $50k-75k, 8.3% for AGIs $75k-100k)
Profit/loss from business: +$1,562 (reported on 16.2% of returns)
Here:
+$1,562
State:
+$9,547
(% of AGI for various income ranges: -14.5% for AGIs below $10k, 2.7% for AGIs $10k-25k, 2.0% for AGIs $25k-50k, -0.0% for AGIs $50k-75k)
IRA payment deduction: $2,105 (reported on 1.7% of returns)
49620:
$2,105
Michigan:
$2,875
Total itemized deductions: $13,587 (26% of AGI, reported on 28.4% of returns)
Here:
$13,587
State:
$18,509
Here:
26.4% of AGI
State:
20.7% of AGI
(% of AGI for various income ranges: 10.7% for AGIs below $10k, 10.5% for AGIs $10k-25k, 11.2% for AGIs $25k-50k, 12.2% for AGIs $50k-75k, 15.9% for AGIs $75k-100k, 16.5% for AGIs over 100k)
Charity contributions deductions: $1,882 (3% of AGI, reported on 21.6% of returns)
Here:
$1,882
State:
$3,365
Here:
3.4% of AGI
State:
3.6% of AGI
(% of AGI for various income ranges: 0.7% for AGIs $10k-25k, 0.9% for AGIs $25k-50k, 1.4% for AGIs $50k-75k, 2.6% for AGIs $75k-100k, 2.1% for AGIs over 100k)
Total tax: $3,089 (reported on 70.7% of returns)
49620:
$3,089
State:
$7,691
(% of AGI for various income ranges: 2.5% for AGIs below $10k, 3.8% for AGIs $10k-25k, 5.7% for AGIs $25k-50k, 7.7% for AGIs $50k-75k, 9.4% for AGIs $75k-100k, 14.4% for AGIs over 100k)
Earned income credit: $1,641 (reported on 19.0% of returns)
Here:
$1,641
State:
$1,737
Percentage of individuals using paid preparers for their 2004 taxes: 60.6%
Here:
61%
State:
60%
(% for various income ranges: 51.8% for AGIs below $10k, 61.4% for AGIs $10k-25k, 64.6% for AGIs $25k-50k, 55.6% for AGIs $50k-75k, 71.4% for AGIs $75k-100k, 90.0% for AGIs over 100k)
Household received Food Stamps/SNAP in the past 12 months: 126 Household did not receive Food Stamps/SNAP in the past 12 months: 838
Women who had a birth in the past 12 months: 21 (9 now married, 11 unmarried) Women who did not have a birth in the past 12 months: 533 (301 now married, 230 unmarried)
Housing units in zip code 49620 with a mortgage: 551 (29 second mortgage, 28 both second mortgage and home equity loan) Houses without a mortgage: 11
Median monthly owner costs for units with a mortgage: $1,289 Median monthly owner costs for units without a mortgage: $547
Residents with income below the poverty level in 2022:
This zip code:
10.7%
Whole state:
13.4%
Residents with income below 50% of the poverty level in 2022:
This zip code:
4.9%
Whole state:
6.9%
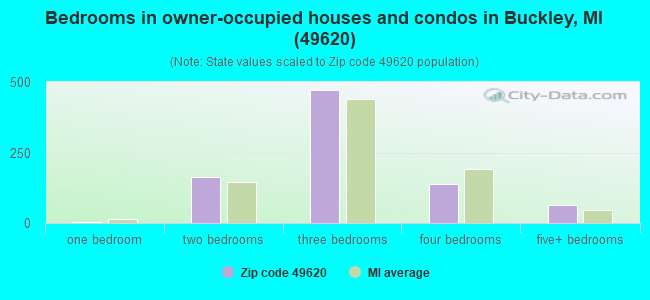
Median number of rooms in houses and condos:
Here:
6.5
State:
6.5
Median number of rooms in apartments:
Here:
5.2
State:
4.3
Notable locations in this zip code not listed on our city pages
Notable locations in zip code 49620: Traverse City South KOA Campground (A), Cornell School (B), Bartlett School (C), Canada School (D), Buckley Volunteer Fire Department (E), Buckley Public Library (F). Display/hide their locations on the map
Churches in zip code 49620 include: Grant Church (A), Buckley Gospel Tabernacle Church (B), Buckley Wayside Congregational Church (C), Grant United Methodist Church (D), Faith Community Nazarene Church (E). Display/hide their locations on the map
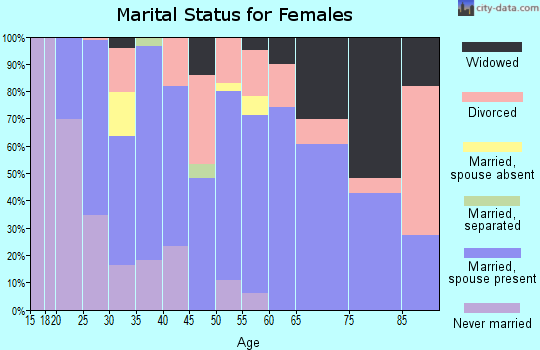
586 married couples with children.
110 single-parent households (32 men, 78 women).
97.2% of residents of 49620 zip code speak English at home.
0.3% of residents speak Spanish at home (43% very well, 57% well).
1.8% of residents speak other Indo-European language at home (2% very well, 38% well, 60% not well).
0.4% of residents speak Asian or Pacific Island language at home (100% very well).
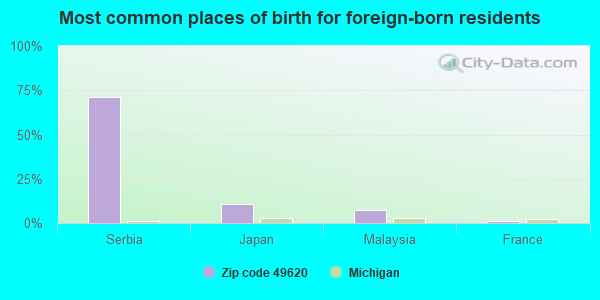
Foreign born population: 82 (3.0%) (28.4% of them are naturalized citizens)
This zip code:
3.0%
Whole state:
6.9%
71%Serbia
11%Japan
7%Malaysia
1%France
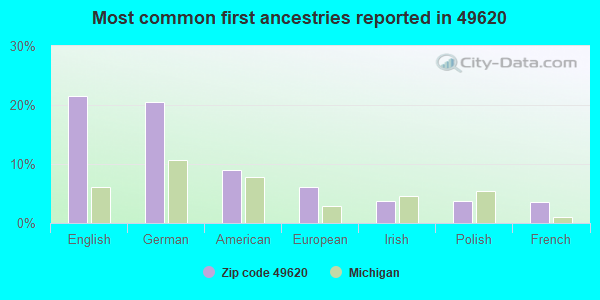
22%English
21%German
9%American
6%European
4%Irish
4%Polish
4%French
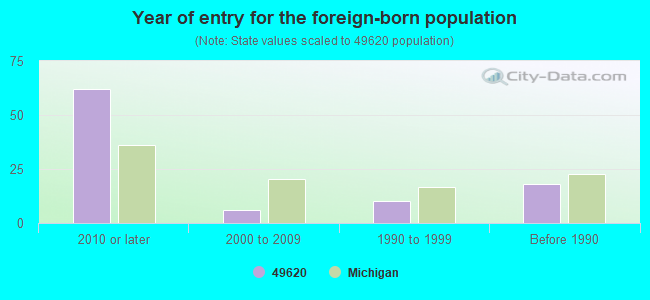
Year of entry for the foreign-born population
622010 or later
62000 to 2009
101990 to 1999
18Before 1990
Facilities with environmental interests located in this zip code:
MI DEPT/ENVIRONMENTAL QUALITY (HANNAH RD in BUCKLEY, MI)
(Resource Conservation and Recovery Act (tracking hazardous waste)) Alternative names: MI DEPT/ERD (E)
Housing units lacking complete plumbing facilities: 0.4%
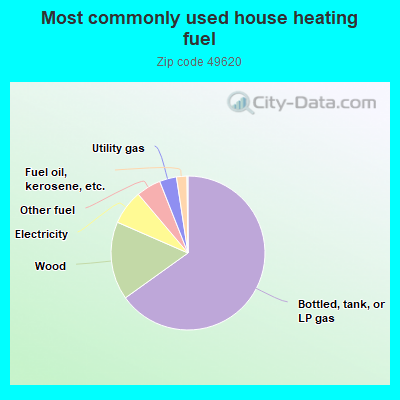
65.3%Bottled, tank, or LP gas
16.5%Wood
7.3%Electricity
5.2%Other fuel
3.6%Utility gas
2.2%Fuel oil, kerosene, etc.
Population in 1990: 1,788. Population change in the 1990s: +286 (+16.0%).
Place of birth for U.S.-born residents:
This state: 2,302
Northeast: 106
Midwest: 76
South: 120
West: 110
60% of the 49620 zip code residents lived in the same house 5 years ago. Out of people who lived in different houses, 34% lived in this county. Out of people who lived in different counties, 50% lived in Michigan.
91% of the 49620 zip code residents lived in the same house 1 year ago. Out of people who lived in different houses, 39% moved from this county. Out of people who lived in different houses, 52% moved from different county within same state. Out of people who lived in different houses, 4% moved from different state. Out of people who lived in different houses, 2% moved from abroad.
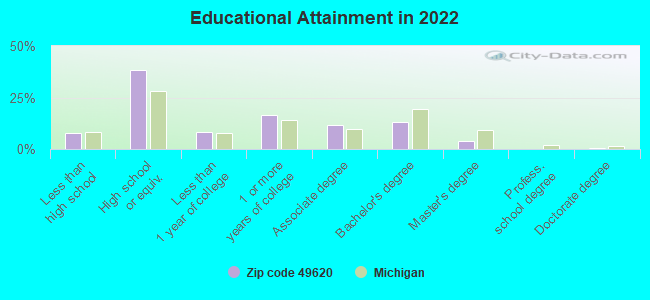
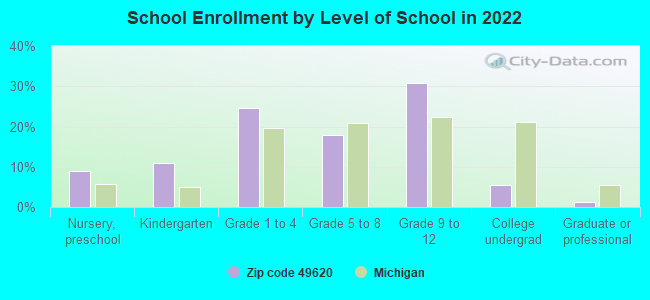
Private vs. public school enrollment:
Students in private schools in grades 1 to 8 (elementary and middle school): 18
Here:
6.9%
Michigan:
12.4%
Students in private schools in grades 9 to 12 (high school): 12
Here:
6.5%
Michigan:
9.8%
Students in private undergraduate colleges:
Here:
0.0%
Michigan:
14.9%
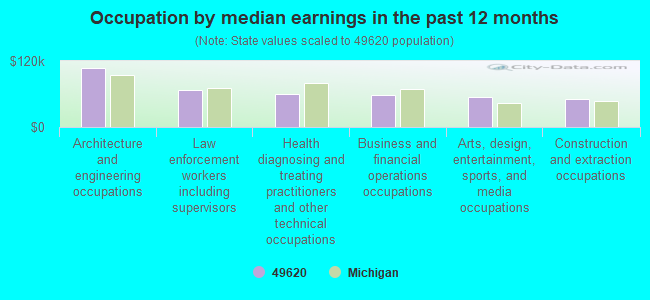
Occupation by median earnings in the past 12 months ($)
108,031Architecture and engineering occupations
68,029Law enforcement workers including supervisors
60,474Health diagnosing and treating practitioners and other technical occupations
58,980Business and financial operations occupations
55,241Arts, design, entertainment, sports, and media occupations
51,559Construction and extraction occupations
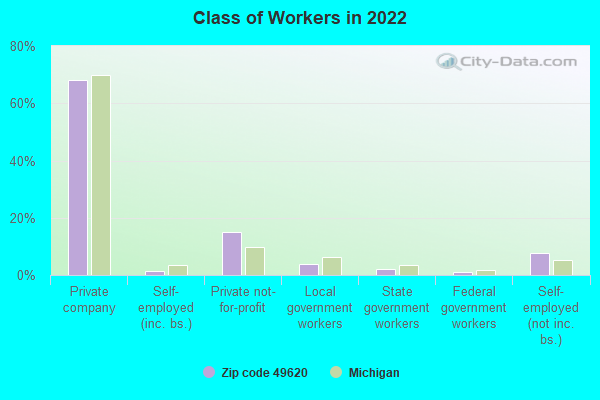
Top industries in this zip code by the number of employees in 2005:
Finance and Insurance: Commercial Banking (5-9: 1)
Health Care and Social Assistance: Offices of Physicians (except Mental Health Specialists) (5-9: 1)
Construction: New Single-Family Housing Construction (except Operative Builders) (1-4: 3)
People in group quarters in 2000:
7 people in agriculture workers' dormitories on farms
Fatal accident statistics in 2011:
Fatal accident count: 1
Vehicles involved in fatal accidents: 2
Fatal accidents caused by drunken drivers: 0
Fatalities: 1
Persons involved in fatal accidents: 3
Pedestrians involved in fatal accidents: 0
2002 - 2018 National Fire Incident Reporting System (NFIRS) incidents
According to the data from the years 2002 - 2018 the average number of fires per year is 21. The highest number of reported fires - 57 took place in 2018, and the least - 12 in 2004. The data has a growing trend.
When looking into fire subcategories, the most incidents belonged to: Structure Fires (52.4%), and Outside Fires (30.5%).
Fire incident types reported to NFIRS in Zip Code 49620


 Nearest zip codes: 49637, 49668, 49666, 49649, 49643, 49625.


 According to the data from the years 2002 - 2018 the average number of fires per year is 21. The highest number of reported fires - 57 took place in 2018, and the least - 12 in 2004. The data has a growing trend.
 When looking into fire subcategories, the most incidents belonged to: Structure Fires (52.4%), and Outside Fires (30.5%).