Estimated zip code population in 2022: 3,596 Zip code population in 2010: 3,405 Zip code population in 2000: 2,429
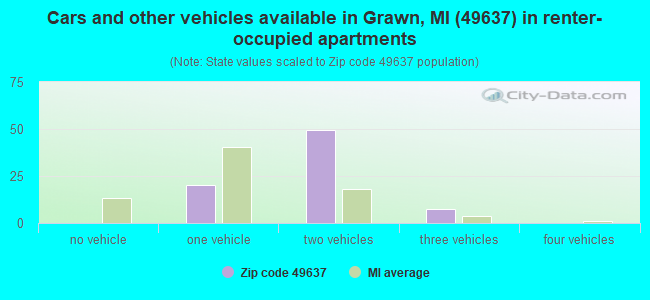
Houses and condos: 1,473 Renter-occupied apartments: 78
% of renters here:
7%
State:
27%
March 2022 cost of living index in zip code 49637: 82.2 (low, U.S. average is 100)
Land area: 25.0 sq. mi. Water area: 3.3 sq. mi.
Population density: 144 people per square mile
(very low).
OSM Map
General Map
Google Map
MSN Map
OSM Map
General Map
Google Map
MSN Map
OSM Map
General Map
Google Map
MSN Map
OSM Map
General Map
Google Map
MSN Map
Please wait while loading the map...
Real estate property taxes paid for housing units in 2022:
This zip code:
1.1% ($2,216)
Michigan:
1.2% ($2,746)
Median real estate property taxes paid for housing units with mortgages in 2022: $2,456 (0.9%) Median real estate property taxes paid for housing units with no mortgage in 2022: $1,408 (0.8%)
Business Search- 14 Million verified businesses
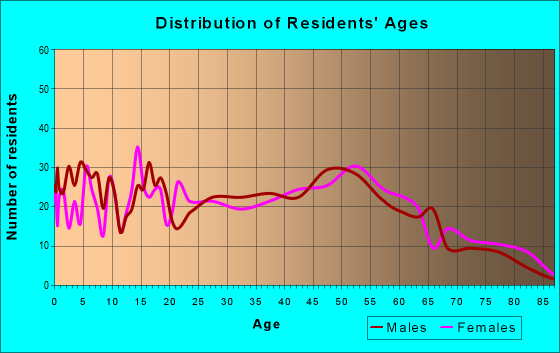
Males: 1,834
(51.0%)
Females: 1,761
(49.0%)
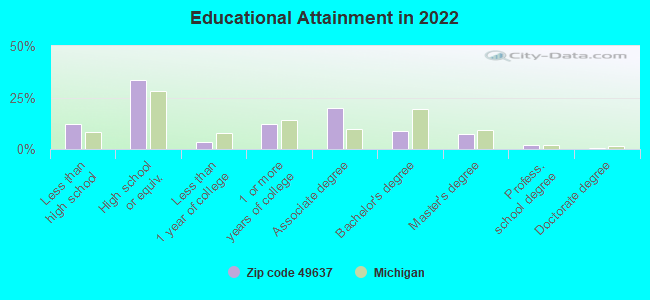
For population 25 years and over in 49637:
High school or higher: 88.4%
Bachelor's degree or higher: 19.2%
Graduate or professional degree: 10.3%
Unemployed: 2.2%
Mean travel time to work (commute): 23.6 minutes
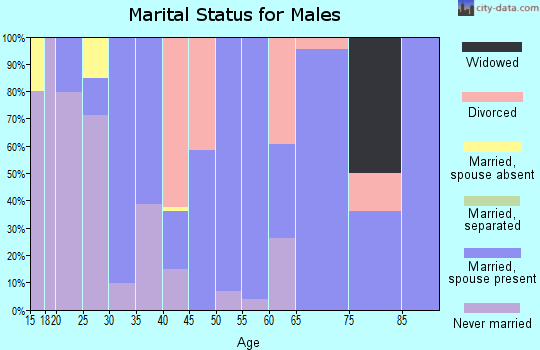
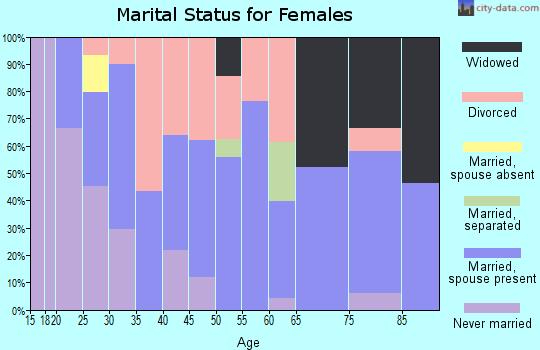
For population 15 years and over in 49637:
Never married: 45.5%
Now married: 41.0%
Separated: 0.4%
Widowed: 2.0%
Divorced: 11.2%
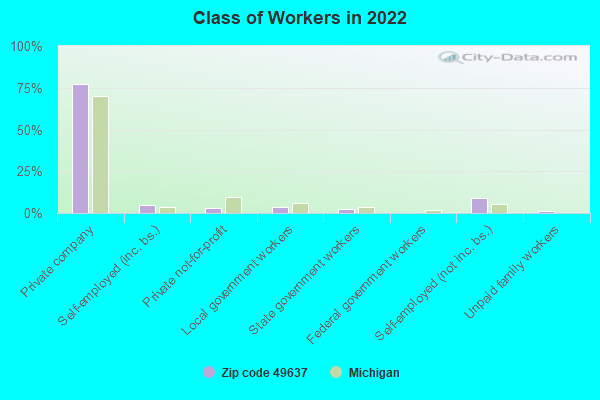
Zip code 49637 compared to state average:
Unemployed percentage below state average.
Black race population percentage significantly below state average.
Hispanic race population percentage above state average.
Foreign-born population percentage significantly below state average.
Renting percentage significantly below state average.
Length of stay since moving in above state average.
House age below state average.
Percentage of population with a bachelor's degree or higher below state average.
Averages for the 2020 tax year for zip code 49637, filed in 2021:
Average Adjusted Gross Income (AGI) in 2020: $54,118 (Individual Income Tax Returns)
Here:
$54,118
State:
$68,945
Salary/wage: $45,547 (reported on 80.4% of returns)
Here:
$45,547
State:
$57,142
(% of AGI for various income ranges: 1102.6% for AGIs below $25k, 3557.1% for AGIs $25k-50k, 6370.9% for AGIs $50k-75k, 9560.9% for AGIs $75k-100k, 13105.4% for AGIs $100k-200k)
Taxable interest for individuals: $978 (reported on 26.5% of returns)
This zip code:
$978
Michigan:
$1,630
(% of AGI for various income ranges: 20.3% for AGIs below $25k, 24.9% for AGIs $25k-50k, 28.6% for AGIs $50k-75k, 40.0% for AGIs $75k-100k, 89.2% for AGIs $100k-200k)
Ordinary dividends: $3,921 (reported on 14.8% of returns)
Here:
$3,921
State:
$6,972
(% of AGI for various income ranges: 7.6% for AGIs below $25k, 24.4% for AGIs $25k-50k, 65.9% for AGIs $50k-75k, 95.5% for AGIs $75k-100k, 278.5% for AGIs $100k-200k)
Net capital gain/loss in AGI: +$10,093 (reported on 14.8% of returns)
Here:
+$10,093
State:
+$20,064
(% of AGI for various income ranges: 17.8% for AGIs $25k-50k, 74.5% for AGIs $50k-75k, 260.0% for AGIs $75k-100k, 750.8% for AGIs $100k-200k)
Profit/loss from business: +$9,748 (reported on 16.4% of returns)
Here:
+$9,748
State:
+$11,172
(% of AGI for various income ranges: 133.4% for AGIs below $25k, 171.1% for AGIs $25k-50k, 256.8% for AGIs $50k-75k, 423.6% for AGIs $75k-100k, 549.2% for AGIs $100k-200k)
Taxable individual retirement arrangement distribution: $17,261 (reported on 9.5% of returns)
49637:
$17,261
Michigan:
$19,803
(% of AGI for various income ranges: 68.2% for AGIs below $25k, 81.8% for AGIs $25k-50k, 182.3% for AGIs $50k-75k, 328.2% for AGIs $75k-100k, 1321.5% for AGIs $100k-200k)
Total itemized deductions: $27,300 (reported on 3.7% of returns)
Here:
$27,300
State:
$34,117
(% of AGI for various income ranges: 342.3% for AGIs $50k-75k, 890.8% for AGIs $100k-200k)
Charity contributions: $9,280 (reported on 2.6% of returns)
Here:
$9,280
State:
$13,548
(% of AGI for various income ranges: 356.9% for AGIs $100k-200k)
Taxes paid: $8,150 (reported on 3.2% of returns)
49637:
$8,150
State:
$7,972
(% of AGI for various income ranges: 82.7% for AGIs $50k-75k, 236.2% for AGIs $100k-200k)
Earned income credit: $1,912 (reported on 13.8% of returns)
Here:
$1,912
State:
$2,251
(% of AGI for various income ranges: 66.6% for AGIs below $25k, 54.2% for AGIs $25k-50k)
Percentage of individuals using paid preparers for their 2020 taxes: 93.1%
Here:
93%
State:
93%
(% for various income ranges: 91.4% for AGIs below $25k, 91.5% for AGIs $25k-50k, 96.7% for AGIs $50k-75k, 94.1% for AGIs $75k-100k, 95.2% for AGIs $100k-200k, 100.0% for AGIs over 200k)
Averages for the 2012 tax year for zip code 49637, filed in 2013:
Average Adjusted Gross Income (AGI) in 2012: $41,021 (Individual Income Tax Returns)
Here:
$41,021
State:
$55,609
Salary/wage: $34,037 (reported on 82.3% of returns)
Here:
$34,037
State:
$46,782
(% of AGI for various income ranges: 74.3% for AGIs below $25k, 80.9% for AGIs $25k-50k, 78.6% for AGIs $50k-75k, 69.0% for AGIs $75k-100k, 46.1% for AGIs $100k-200k)
Taxable interest for individuals: $876 (reported on 26.3% of returns)
This zip code:
$876
Michigan:
$1,491
(% of AGI for various income ranges: 0.9% for AGIs below $25k, 0.7% for AGIs $25k-50k, 0.5% for AGIs $50k-75k, 0.6% for AGIs $75k-100k, 0.3% for AGIs $100k-200k)
Ordinary dividends: $4,062 (reported on 13.7% of returns)
Here:
$4,062
State:
$6,225
(% of AGI for various income ranges: 0.5% for AGIs below $25k, 0.7% for AGIs $25k-50k, 1.1% for AGIs $50k-75k, 0.4% for AGIs $75k-100k, 3.1% for AGIs $100k-200k)
Net capital gain/loss in AGI: +$2,739 (reported on 10.3% of returns)
Here:
+$2,739
State:
+$9,326
(% of AGI for various income ranges: 0.2% for AGIs below $25k, 0.4% for AGIs $50k-75k, 2.1% for AGIs $100k-200k)
Profit/loss from business: +$8,161 (reported on 16.0% of returns)
Here:
+$8,161
State:
+$11,523
(% of AGI for various income ranges: 8.9% for AGIs below $25k, 2.8% for AGIs $25k-50k, 1.1% for AGIs $50k-75k, 3.2% for AGIs $75k-100k, 2.2% for AGIs $100k-200k)
Taxable individual retirement arrangement distribution: $13,495 (reported on 10.9% of returns)
49637:
$13,495
Michigan:
$15,298
(% of AGI for various income ranges: 2.2% for AGIs below $25k, 3.4% for AGIs $25k-50k, 3.4% for AGIs $50k-75k, 5.0% for AGIs $75k-100k, 3.8% for AGIs $100k-200k)
Total itemized deductions: $17,333 (22% of AGI, reported on 24.6% of returns)
Here:
$17,333
State:
$21,628
Here:
22.1% of AGI
State:
18.4% of AGI
(% of AGI for various income ranges: 9.2% for AGIs below $25k, 9.1% for AGIs $25k-50k, 9.0% for AGIs $50k-75k, 11.3% for AGIs $75k-100k, 12.7% for AGIs $100k-200k)
Charity contributions: $2,447 (reported on 18.3% of returns)
Here:
$2,447
State:
$4,225
(% of AGI for various income ranges: 0.6% for AGIs below $25k, 0.7% for AGIs $25k-50k, 0.9% for AGIs $50k-75k, 1.2% for AGIs $75k-100k, 1.8% for AGIs $100k-200k)
Taxes paid: $5,700 (reported on 24.6% of returns)
49637:
$5,700
State:
$8,327
(% of AGI for various income ranges: 2.4% for AGIs below $25k, 2.4% for AGIs $25k-50k, 2.8% for AGIs $50k-75k, 3.6% for AGIs $75k-100k, 5.2% for AGIs $100k-200k)
Earned income credit: $2,230 (reported on 21.1% of returns)
Here:
$2,230
State:
$2,306
(% of AGI for various income ranges: 6.0% for AGIs below $25k, 1.3% for AGIs $25k-50k)
Percentage of individuals using paid preparers for their 2012 taxes: 51.4%
Here:
51%
State:
57%
(% for various income ranges: 47.0% for AGIs below $25k, 53.5% for AGIs $25k-50k, 53.8% for AGIs $50k-75k, 58.3% for AGIs $75k-100k, 63.6% for AGIs $100k-200k)
Averages for the 2004 tax year for zip code 49637, filed in 2005:
Average Adjusted Gross Income (AGI) in 2004: $35,380 (Individual Income Tax Returns)
Here:
$35,380
State:
$48,204
Salary/wage: $30,737 (reported on 86.8% of returns)
Here:
$30,737
State:
$42,791
(% of AGI for various income ranges: 133.0% for AGIs below $10k, 75.6% for AGIs $10k-25k, 83.5% for AGIs $25k-50k, 79.7% for AGIs $50k-75k, 74.4% for AGIs $75k-100k, 49.0% for AGIs over 100k)
Taxable interest for individuals: $1,119 (reported on 39.9% of returns)
This zip code:
$1,119
Michigan:
$1,725
(% of AGI for various income ranges: 5.4% for AGIs below $10k, 2.1% for AGIs $10k-25k, 1.1% for AGIs $25k-50k, 0.9% for AGIs $50k-75k, 1.6% for AGIs $75k-100k, 0.9% for AGIs over 100k)
Taxable dividends: $2,321 (reported on 17.8% of returns)
Here:
$2,321
State:
$3,420
(% of AGI for various income ranges: 4.0% for AGIs below $10k, 1.0% for AGIs $10k-25k, 0.6% for AGIs $25k-50k, 1.4% for AGIs $50k-75k, 0.5% for AGIs $75k-100k, 2.0% for AGIs over 100k)
Net capital gain/loss: +$3,346 (reported on 14.6% of returns)
Here:
+$3,346
State:
+$8,532
(% of AGI for various income ranges: -3.2% for AGIs below $10k, -0.1% for AGIs $10k-25k, 0.1% for AGIs $25k-50k, 1.2% for AGIs $50k-75k, 0.1% for AGIs $75k-100k, 6.4% for AGIs over 100k)
Profit/loss from business: +$9,500 (reported on 16.3% of returns)
Here:
+$9,500
State:
+$9,547
(% of AGI for various income ranges: 5.2% for AGIs below $10k, 7.7% for AGIs $10k-25k, 2.7% for AGIs $25k-50k, 0.9% for AGIs $50k-75k, 13.7% for AGIs over 100k)
IRA payment deduction: $2,154 (reported on 2.4% of returns)
49637:
$2,154
Michigan:
$2,875
Total itemized deductions: $14,601 (25% of AGI, reported on 31.0% of returns)
Here:
$14,601
State:
$18,509
Here:
24.8% of AGI
State:
20.7% of AGI
(% of AGI for various income ranges: 21.7% for AGIs below $10k, 9.1% for AGIs $10k-25k, 11.9% for AGIs $25k-50k, 13.0% for AGIs $50k-75k, 15.3% for AGIs $75k-100k, 14.4% for AGIs over 100k)
Charity contributions deductions: $1,832 (3% of AGI, reported on 23.8% of returns)
Here:
$1,832
State:
$3,365
Here:
2.8% of AGI
State:
3.6% of AGI
(% of AGI for various income ranges: 0.7% for AGIs $10k-25k, 0.9% for AGIs $25k-50k, 1.4% for AGIs $50k-75k, 1.4% for AGIs $75k-100k, 1.9% for AGIs over 100k)
Total tax: $4,187 (reported on 73.6% of returns)
49637:
$4,187
State:
$7,691
(% of AGI for various income ranges: 2.9% for AGIs below $10k, 4.6% for AGIs $10k-25k, 6.5% for AGIs $25k-50k, 7.8% for AGIs $50k-75k, 10.0% for AGIs $75k-100k, 17.3% for AGIs over 100k)
Earned income credit: $1,656 (reported on 17.1% of returns)
Here:
$1,656
State:
$1,737
Percentage of individuals using paid preparers for their 2004 taxes: 56.1%
Here:
56%
State:
60%
(% for various income ranges: 45.5% for AGIs below $10k, 57.8% for AGIs $10k-25k, 60.7% for AGIs $25k-50k, 56.0% for AGIs $50k-75k, 59.3% for AGIs $75k-100k, 62.3% for AGIs over 100k)
Household received Food Stamps/SNAP in the past 12 months: 153 Household did not receive Food Stamps/SNAP in the past 12 months: 986
Women who did not have a birth in the past 12 months: 998 (197 now married, 804 unmarried)
Housing units in zip code 49637 with a mortgage: 611 (62 second mortgage, 65 both second mortgage and home equity loan) Median monthly owner costs for units with a mortgage: $1,338 Median monthly owner costs for units without a mortgage: $425
Residents with income below the poverty level in 2022:
This zip code:
11.1%
Whole state:
13.4%
Residents with income below 50% of the poverty level in 2022:
This zip code:
7.0%
Whole state:
6.9%
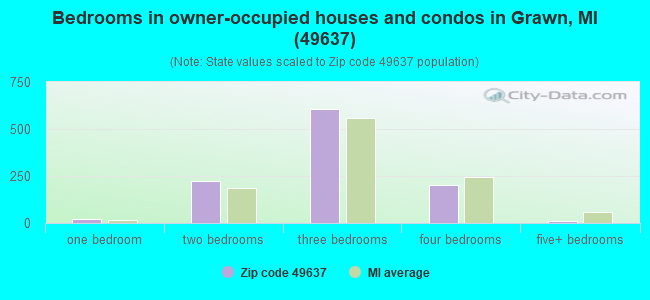
Median number of rooms in houses and condos:
Here:
5.9
State:
6.5
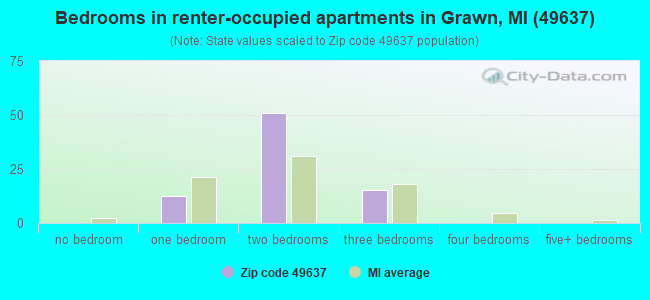
Median number of rooms in apartments:
Here:
3.7
State:
4.3
Notable locations in this zip code not listed on our city pages
Notable locations in zip code 49637: Grawn Station (A), Blair Township Hall (B), Blair Township Fire Department (C), Blair Township Emergency Medical Services (D). Display/hide their locations on the map
Lakes: Mud Lake (A), Yonkers Lake (B), Ellis Lake (C), Duck Lake (D), Cox Pond (E), Saunders Lake (F), Tonawanda Lake (G). Display/hide their locations on the map
In group quarters: 18 (-1 institutionalized population)
Size of family households: 431 2-persons, 138 3-persons, 160 4-persons, 52 5-persons, 30 6-persons, 46 7-or-more-persons
Size of nonfamily households: 122 1-person, 128 2-persons, 31 4-persons
329 married couples with children.
221 single-parent households (171 men, 50 women).
95.2% of residents of 49637 zip code speak English at home.
3.5% of residents speak Spanish at home (100% very well).
0.4% of residents speak other Indo-European language at home (100% very well).
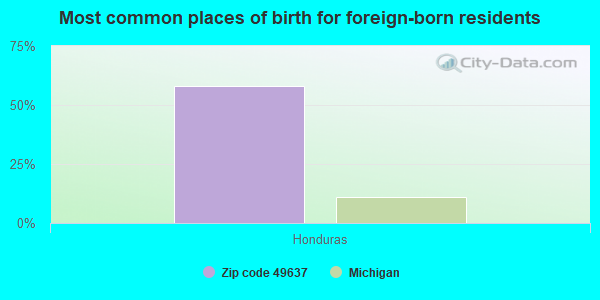
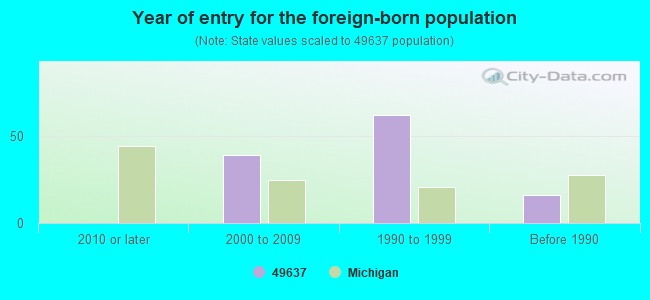
Foreign born population: 107 (3.0%) (2.9% of them are naturalized citizens)
This zip code:
3.0%
Whole state:
6.9%
58%Honduras
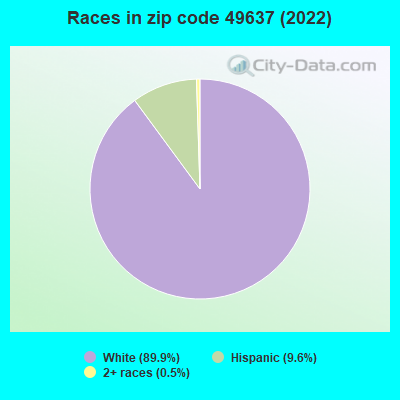
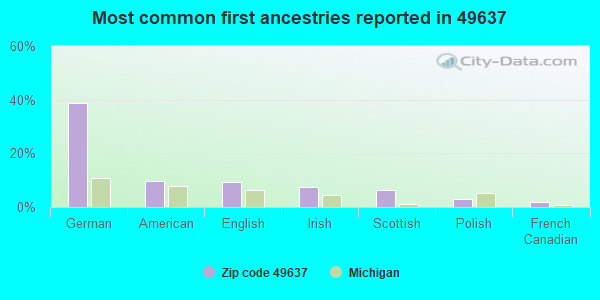
39%German
10%American
9%English
7%Irish
6%Scottish
3%Polish
2%French Canadian
Year of entry for the foreign-born population
02010 or later
392000 to 2009
621990 to 1999
16Before 1990
Facilities with environmental interests located in this zip code:
CHERRY GROWERS, INC (6331 US 31 SOUTH in GRAWN, MI)
ENFORCEMENT/COMPLIANCE ACTIVITY (Integrated Compliance Information System) - ICIS-05-2004-3600, FORMAL ENFORCEMENT ACTION (Integrated Compliance Information System) - ICIS-05-2004-3600, FORMAL ENFORCEMENT ACTION Conditionally Exempt Small Quantity Generators, less than 100 kg/month of hazardous waste (Resource Conservation and Recovery Act (tracking hazardous waste)) - notification Organizations: CHERRY GROWERS INC (CONTACT/OPERATOR)
MI DEPT/ENVIRONMENTAL QUALITY (5175 SAWYER WOODS DRIVE in GRAWN, MI)
(Resource Conservation and Recovery Act (tracking hazardous waste)) Alternative names: MI DEPT/ENVIRONMENTAL QUALITY RRD
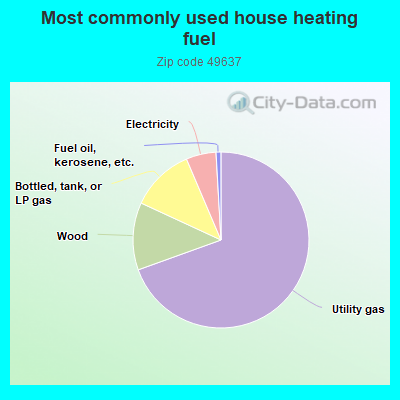
69.5%Utility gas
12.4%Wood
11.7%Bottled, tank, or LP gas
5.5%Electricity
0.9%Fuel oil, kerosene, etc.
Population in 1990: 1,869. Population change in the 1990s: +560 (+30.0%).
Place of birth for U.S.-born residents:
This state: 2,953
Northeast: 98
Midwest: 341
South: 29
West: 47
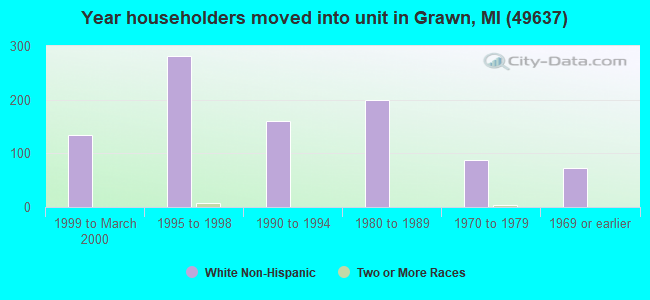
63% of the 49637 zip code residents lived in the same house 5 years ago. Out of people who lived in different houses, 58% lived in this county. Out of people who lived in different counties, 50% lived in Michigan.
98% of the 49637 zip code residents lived in the same house 1 year ago. Out of people who lived in different houses, 118% moved from different county within same state.
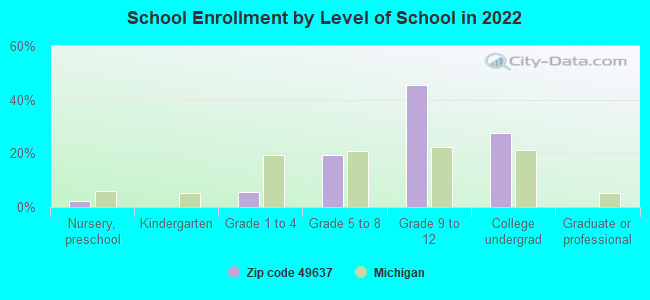
Private vs. public school enrollment:
Students in private schools in grades 1 to 8 (elementary and middle school): 92
Here:
32.6%
Michigan:
12.4%
Students in private schools in grades 9 to 12 (high school): 34
Here:
6.4%
Michigan:
9.8%
Students in private undergraduate colleges: 37
Here:
11.7%
Michigan:
14.9%
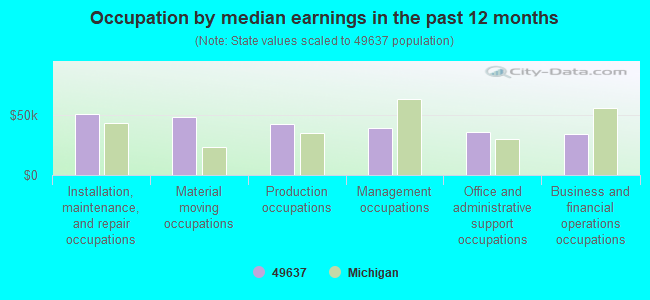
Occupation by median earnings in the past 12 months ($)
51,460Installation, maintenance, and repair occupations
49,005Material moving occupations
42,735Production occupations
39,298Management occupations
36,271Office and administrative support occupations
34,151Business and financial operations occupations
Top industries in this zip code by the number of employees in 2005:
Utilities: Electric Power Distribution (50-99 employees: 1 establishment)
Professional, Scientific, and Technical Services: Process, Physical Distribution, and Logistics Consulting Services (20-49: 1)
Administrative and Support and Waste Management and Remediation Services: Landscaping Services (10-19: 1, 5-9: 1, 1-4: 2)
Construction: All Other Specialty Trade Contractors (5-9: 3)
Construction: Highway, Street, and Bridge Construction (10-19: 1, 1-4: 2)
Health Care and Social Assistance: Residential Mental Retardation Facilities (10-19: 1)
People in group quarters in 2010:
11 people in group homes intended for adults
People in group quarters in 2000:
13 people in other group homes
Fatal accident statistics in 2014:
Fatal accident count: 2
Vehicles involved in fatal accidents: 3
Fatal accidents caused by drunken drivers: 0
Fatalities: 2
Persons involved in fatal accidents: 7
Pedestrians involved in fatal accidents: 1
Fatal accident statistics in 2012:
Fatal accident count: 1
Vehicles involved in fatal accidents: 2
Fatal accidents caused by drunken drivers: 0
Fatalities: 2
Persons involved in fatal accidents: 3
Pedestrians involved in fatal accidents: 0
2002 - 2018 National Fire Incident Reporting System (NFIRS) incidents
According to the data from the years 2002 - 2018 the average number of fires per year is 11. The highest number of reported fires - 30 took place in 2018, and the least - 4 in 2006. The data has a growing trend.
When looking into fire subcategories, the most incidents belonged to: Structure Fires (51.1%), and Outside Fires (31.6%).
Fire incident types reported to NFIRS in Zip Code 49637
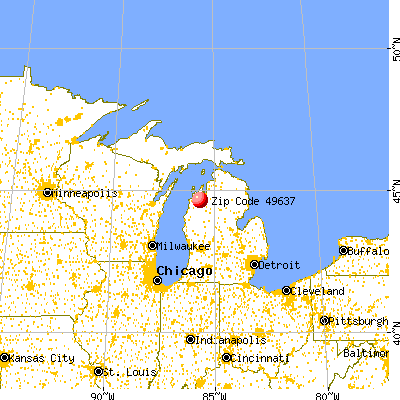


 Nearest zip codes: 49620, 49643, 49684, 49666, 49686, 49649.
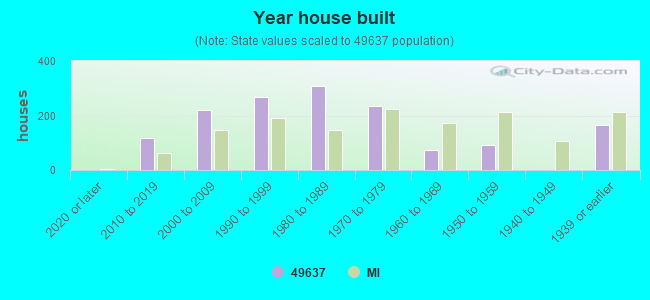


 According to the data from the years 2002 - 2018 the average number of fires per year is 11. The highest number of reported fires - 30 took place in 2018, and the least - 4 in 2006. The data has a growing trend.
 When looking into fire subcategories, the most incidents belonged to: Structure Fires (51.1%), and Outside Fires (31.6%).