Estimated zip code population in 2022: 1,748 Zip code population in 2010: 1,892 Zip code population in 2000: 2,040
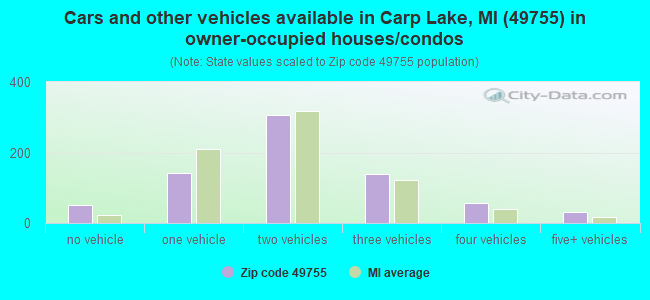
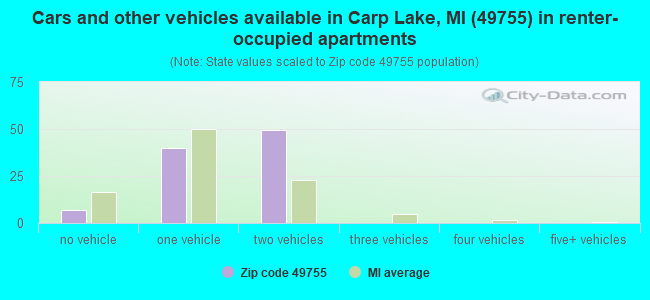
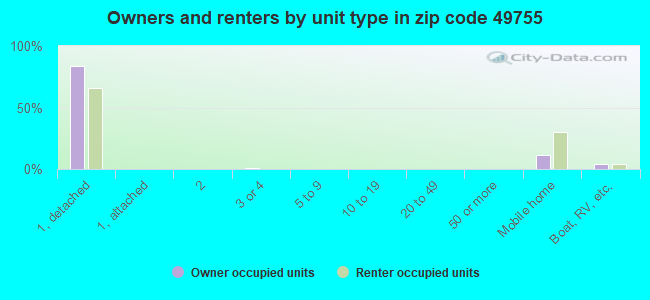
Houses and condos: 1,267 Renter-occupied apartments: 96
% of renters here:
12%
State:
27%
March 2022 cost of living index in zip code 49755: 81.4 (low, U.S. average is 100)
Land area: 99.8 sq. mi. Water area: 5.9 sq. mi.
Population density: 18 people per square mile
(very low).
OSM Map
General Map
Google Map
MSN Map
OSM Map
General Map
Google Map
MSN Map
OSM Map
General Map
Google Map
MSN Map
OSM Map
General Map
Google Map
MSN Map
Please wait while loading the map...
Real estate property taxes paid for housing units in 2022:
This zip code:
0.9% ($1,465)
Michigan:
1.2% ($2,746)
Median real estate property taxes paid for housing units with mortgages in 2022: $1,510 (0.8%) Median real estate property taxes paid for housing units with no mortgage in 2022: $1,405 (1.0%)
Business Search- 14 Million verified businesses
Males: 925
(52.9%)
Females: 823
(47.1%)
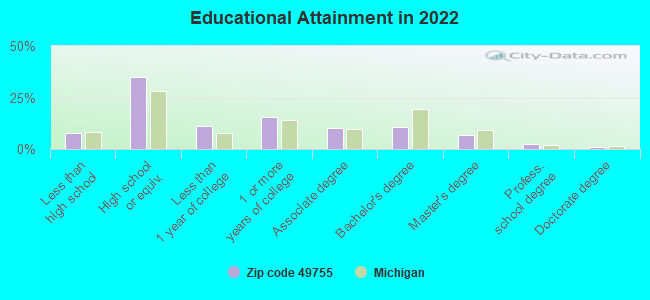
For population 25 years and over in 49755:
High school or higher: 92.3%
Bachelor's degree or higher: 20.6%
Graduate or professional degree: 10.1%
Unemployed: 8.1%
Mean travel time to work (commute): 29.6 minutes
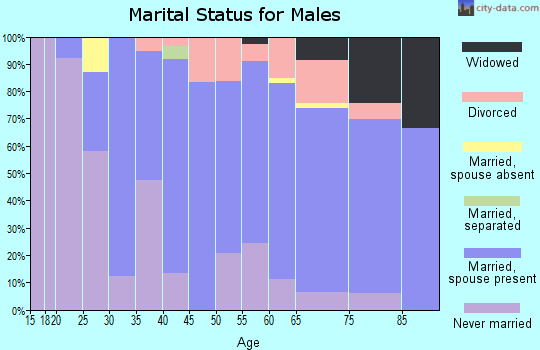
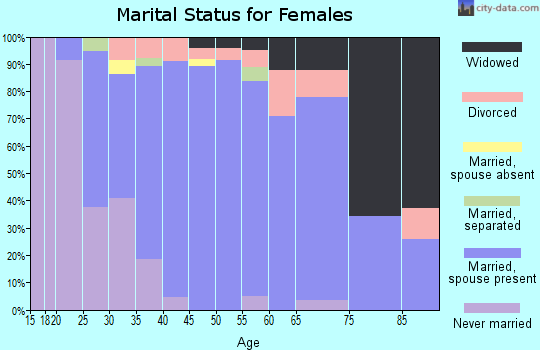
For population 15 years and over in 49755:
Never married: 24.5%
Now married: 58.2%
Separated: 0.2%
Widowed: 5.0%
Divorced: 12.0%
Zip code 49755 compared to state average:
Unemployed percentage above state average.
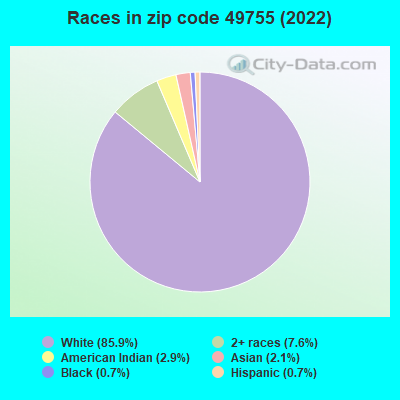
Black race population percentage significantly below state average.
Hispanic race population percentage significantly below state average.
Median age significantly above state average.
Foreign-born population percentage significantly below state average.
Renting percentage significantly below state average.
Length of stay since moving in significantly above state average.
Averages for the 2020 tax year for zip code 49755, filed in 2021:
Average Adjusted Gross Income (AGI) in 2020: $47,996 (Individual Income Tax Returns)
Here:
$47,996
State:
$68,945
Salary/wage: $40,755 (reported on 73.2% of returns)
Here:
$40,755
State:
$57,142
(% of AGI for various income ranges: 1115.2% for AGIs below $25k, 3251.4% for AGIs $25k-50k, 4979.1% for AGIs $50k-75k, 8450.0% for AGIs $75k-100k, 21677.5% for AGIs $100k-200k)
Taxable interest for individuals: $589 (reported on 27.8% of returns)
This zip code:
$589
Michigan:
$1,630
(% of AGI for various income ranges: 12.6% for AGIs below $25k, 7.3% for AGIs $25k-50k, 29.1% for AGIs $50k-75k, 6.7% for AGIs $75k-100k, 195.0% for AGIs $100k-200k)
Ordinary dividends: $2,887 (reported on 15.5% of returns)
Here:
$2,887
State:
$6,972
(% of AGI for various income ranges: 23.5% for AGIs below $25k, 37.3% for AGIs $25k-50k, 78.2% for AGIs $50k-75k, 527.5% for AGIs $100k-200k)
Net capital gain/loss in AGI: +$5,885 (reported on 13.4% of returns)
Here:
+$5,885
State:
+$20,064
(% of AGI for various income ranges: 6.5% for AGIs below $25k, 15.5% for AGIs $25k-50k, 72.7% for AGIs $50k-75k, 1590.0% for AGIs $100k-200k)
Profit/loss from business: +$5,600 (reported on 14.4% of returns)
Here:
+$5,600
State:
+$11,172
(% of AGI for various income ranges: 90.0% for AGIs below $25k, 95.0% for AGIs $25k-50k, 156.4% for AGIs $50k-75k, 326.7% for AGIs $75k-100k)
Taxable individual retirement arrangement distribution: $16,900 (reported on 13.4% of returns)
49755:
$16,900
Michigan:
$19,803
(% of AGI for various income ranges: 117.8% for AGIs below $25k, 108.2% for AGIs $25k-50k, 604.5% for AGIs $50k-75k, 2557.5% for AGIs $100k-200k)
Earned income credit: $2,014 (reported on 14.4% of returns)
Here:
$2,014
State:
$2,251
(% of AGI for various income ranges: 60.4% for AGIs below $25k, 65.0% for AGIs $25k-50k)
Percentage of individuals using paid preparers for their 2020 taxes: 92.8%
Here:
93%
State:
93%
(% for various income ranges: 91.4% for AGIs below $25k, 93.1% for AGIs $25k-50k, 86.7% for AGIs $50k-75k, 100.0% for AGIs $75k-100k, 100.0% for AGIs $100k-200k)
Averages for the 2012 tax year for zip code 49755, filed in 2013:
Average Adjusted Gross Income (AGI) in 2012: $38,121 (Individual Income Tax Returns)
Here:
$38,121
State:
$55,609
Salary/wage: $29,688 (reported on 76.4% of returns)
Here:
$29,688
State:
$46,782
(% of AGI for various income ranges: 62.3% for AGIs below $25k, 67.3% for AGIs $25k-50k, 69.2% for AGIs $50k-75k, 64.4% for AGIs $75k-100k, 35.1% for AGIs $100k-200k)
Taxable interest for individuals: $567 (reported on 33.7% of returns)
This zip code:
$567
Michigan:
$1,491
(% of AGI for various income ranges: 1.4% for AGIs below $25k, 0.5% for AGIs $25k-50k, 0.5% for AGIs $50k-75k, 0.1% for AGIs $75k-100k, 0.2% for AGIs $100k-200k)
Ordinary dividends: $2,280 (reported on 16.9% of returns)
Here:
$2,280
State:
$6,225
(% of AGI for various income ranges: 1.3% for AGIs below $25k, 0.8% for AGIs $25k-50k, 1.4% for AGIs $50k-75k, 1.9% for AGIs $75k-100k)
Net capital gain/loss in AGI: +$1,082 (reported on 12.4% of returns)
Here:
+$1,082
State:
+$9,326
(% of AGI for various income ranges: 0.3% for AGIs $25k-50k, 1.3% for AGIs $50k-75k, 0.1% for AGIs $75k-100k)
Profit/loss from business: +$4,953 (reported on 16.9% of returns)
Here:
+$4,953
State:
+$11,523
(% of AGI for various income ranges: 6.1% for AGIs below $25k, 2.1% for AGIs $25k-50k, 3.2% for AGIs $50k-75k)
Taxable individual retirement arrangement distribution: $16,108 (reported on 14.6% of returns)
49755:
$16,108
Michigan:
$15,298
(% of AGI for various income ranges: 4.4% for AGIs below $25k, 4.0% for AGIs $25k-50k, 5.5% for AGIs $50k-75k, 21.7% for AGIs $75k-100k)
Total itemized deductions: $17,021 (25% of AGI, reported on 21.3% of returns)
Here:
$17,021
State:
$21,628
Here:
24.8% of AGI
State:
18.4% of AGI
(% of AGI for various income ranges: 6.3% for AGIs below $25k, 7.9% for AGIs $25k-50k, 10.3% for AGIs $50k-75k, 11.9% for AGIs $75k-100k, 11.1% for AGIs $100k-200k)
Charity contributions: $2,164 (reported on 15.7% of returns)
Here:
$2,164
State:
$4,225
(% of AGI for various income ranges: 1.1% for AGIs $25k-50k, 1.2% for AGIs $50k-75k, 1.1% for AGIs $75k-100k, 0.8% for AGIs $100k-200k)
Taxes paid: $5,137 (reported on 21.3% of returns)
49755:
$5,137
State:
$8,327
(% of AGI for various income ranges: 1.2% for AGIs below $25k, 1.8% for AGIs $25k-50k, 2.7% for AGIs $50k-75k, 3.5% for AGIs $75k-100k, 5.0% for AGIs $100k-200k)
Earned income credit: $2,167 (reported on 20.2% of returns)
Here:
$2,167
State:
$2,306
(% of AGI for various income ranges: 5.9% for AGIs below $25k, 1.1% for AGIs $25k-50k)
Percentage of individuals using paid preparers for their 2012 taxes: 59.6%
Here:
60%
State:
57%
(% for various income ranges: 52.4% for AGIs below $25k, 62.5% for AGIs $25k-50k, 69.2% for AGIs $50k-75k, 66.7% for AGIs $75k-100k, 75.0% for AGIs $100k-200k)
Averages for the 2004 tax year for zip code 49755, filed in 2005:
Average Adjusted Gross Income (AGI) in 2004: $31,567 (Individual Income Tax Returns)
Here:
$31,567
State:
$48,204
Salary/wage: $26,272 (reported on 84.2% of returns)
Here:
$26,272
State:
$42,791
(% of AGI for various income ranges: 128.3% for AGIs below $10k, 70.0% for AGIs $10k-25k, 73.1% for AGIs $25k-50k, 76.2% for AGIs $50k-75k, 65.1% for AGIs $75k-100k, 48.9% for AGIs over 100k)
Taxable interest for individuals: $1,040 (reported on 41.5% of returns)
This zip code:
$1,040
Michigan:
$1,725
(% of AGI for various income ranges: 4.3% for AGIs below $10k, 2.2% for AGIs $10k-25k, 0.9% for AGIs $25k-50k, 1.1% for AGIs $50k-75k, 0.4% for AGIs $75k-100k, 2.2% for AGIs over 100k)
Taxable dividends: $1,451 (reported on 17.8% of returns)
Here:
$1,451
State:
$3,420
(% of AGI for various income ranges: 1.5% for AGIs below $10k, 0.7% for AGIs $10k-25k, 0.4% for AGIs $25k-50k, 0.3% for AGIs $50k-75k, 2.0% for AGIs $75k-100k, 1.8% for AGIs over 100k)
Net capital gain/loss: +$4,147 (reported on 12.8% of returns)
Here:
+$4,147
State:
+$8,532
(% of AGI for various income ranges: -1.6% for AGIs below $10k, -0.2% for AGIs $10k-25k, 1.6% for AGIs $25k-50k, 0.0% for AGIs $50k-75k, 1.5% for AGIs $75k-100k, 6.9% for AGIs over 100k)
Profit/loss from business: +$6,118 (reported on 15.8% of returns)
Here:
+$6,118
State:
+$9,547
(% of AGI for various income ranges: 11.3% for AGIs below $10k, 5.9% for AGIs $10k-25k, 4.4% for AGIs $25k-50k, 2.0% for AGIs $50k-75k)
IRA payment deduction: $1,526 (reported on 2.1% of returns)
49755:
$1,526
Michigan:
$2,875
Total itemized deductions: $14,572 (25% of AGI, reported on 22.9% of returns)
Here:
$14,572
State:
$18,509
Here:
25.0% of AGI
State:
20.7% of AGI
(% of AGI for various income ranges: 8.6% for AGIs $10k-25k, 10.4% for AGIs $25k-50k, 11.1% for AGIs $50k-75k, 14.6% for AGIs $75k-100k, 10.9% for AGIs over 100k)
Charity contributions deductions: $1,673 (3% of AGI, reported on 18.8% of returns)
Here:
$1,673
State:
$3,365
Here:
2.7% of AGI
State:
3.6% of AGI
(% of AGI for various income ranges: 0.5% for AGIs $10k-25k, 1.0% for AGIs $25k-50k, 1.0% for AGIs $50k-75k, 1.2% for AGIs $75k-100k, 1.5% for AGIs over 100k)
Total tax: $3,721 (reported on 69.4% of returns)
49755:
$3,721
State:
$7,691
(% of AGI for various income ranges: 3.3% for AGIs below $10k, 4.3% for AGIs $10k-25k, 5.9% for AGIs $25k-50k, 8.0% for AGIs $50k-75k, 9.0% for AGIs $75k-100k, 17.1% for AGIs over 100k)
Earned income credit: $1,617 (reported on 15.5% of returns)
Here:
$1,617
State:
$1,737
Percentage of individuals using paid preparers for their 2004 taxes: 60.5%
Here:
61%
State:
60%
(% for various income ranges: 48.6% for AGIs below $10k, 57.8% for AGIs $10k-25k, 67.6% for AGIs $25k-50k, 64.7% for AGIs $50k-75k, 70.3% for AGIs $75k-100k, 85.2% for AGIs over 100k)
Household received Food Stamps/SNAP in the past 12 months: 65 Household did not receive Food Stamps/SNAP in the past 12 months: 756
Women who had a birth in the past 12 months: 6 (2 now married, 3 unmarried) Women who did not have a birth in the past 12 months: 309 (158 now married, 150 unmarried)
Housing units in zip code 49755 with a mortgage: 396 (29 second mortgage, 28 both second mortgage and home equity loan) Houses without a mortgage: 10
Median monthly owner costs for units with a mortgage: $1,161 Median monthly owner costs for units without a mortgage: $472
Residents with income below the poverty level in 2022:
This zip code:
7.2%
Whole state:
13.4%
Residents with income below 50% of the poverty level in 2022:
This zip code:
2.9%
Whole state:
6.9%
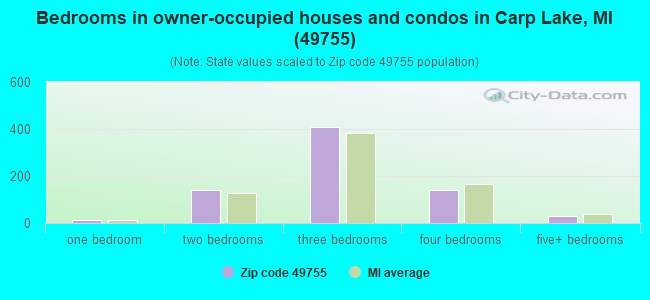
Median number of rooms in houses and condos:
Here:
6.3
State:
6.5
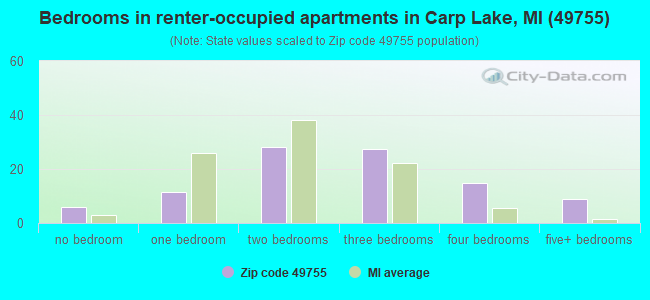
Median number of rooms in apartments:
Here:
6.1
State:
4.3
Notable locations in this zip code not listed on our city pages
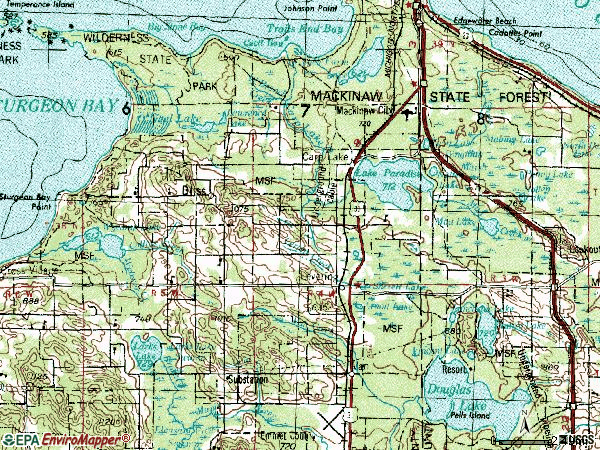
Notable locations in zip code 49755: Heils Corner (A), Camp Knight (B), Hebron Rest Area (C), Bliss Township Park (D), Cetus Corner (E), Bliss Branch Library (F), Levering Branch Library (G), Inverness Fire Department Station 2 (H). Display/hide their locations on the map
Churches in zip code 49755 include: New Hope United Methodist Church (A), Church of God (B), Pioneer Memorial Church (C), Bliss Pioneer Memorial Church (D). Display/hide their locations on the map
Lakes: Reed Lake (A), Lost Lake (B), Galloway Lake (C), Douglas Lake (D), Lancaster Lake (E), Munro Lake (F), Vincent Lake (G), Mud Lake (H). Display/hide their locations on the map
118 married couples with children.
39 single-parent households (17 men, 22 women).
97.7% of residents of 49755 zip code speak English at home.
0.5% of residents speak Spanish at home (100% very well).
0.5% of residents speak other Indo-European language at home (100% very well).
1.0% of residents speak Asian or Pacific Island language at home (81% very well, 19% not well).
0.3% of residents speak other language at home (100% very well).
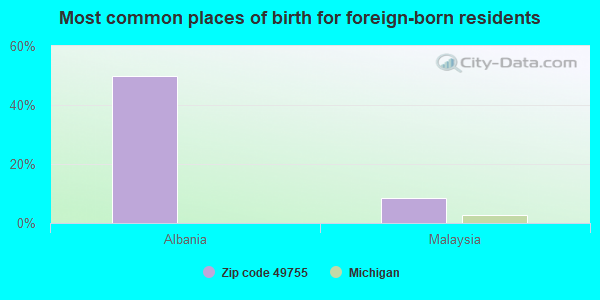
Foreign born population: 11 (0.7%) (8.7% of them are naturalized citizens)
This zip code:
0.7%
Whole state:
6.9%
50%Albania
8%Malaysia
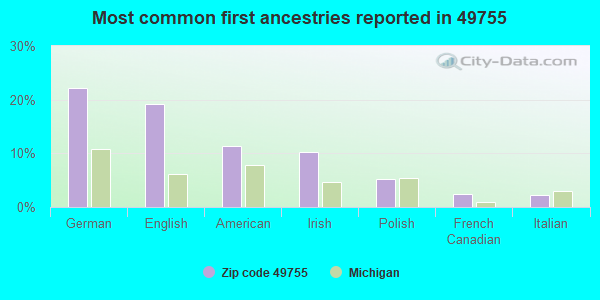
22%German
19%English
11%American
10%Irish
5%Polish
2%French Canadian
2%Italian
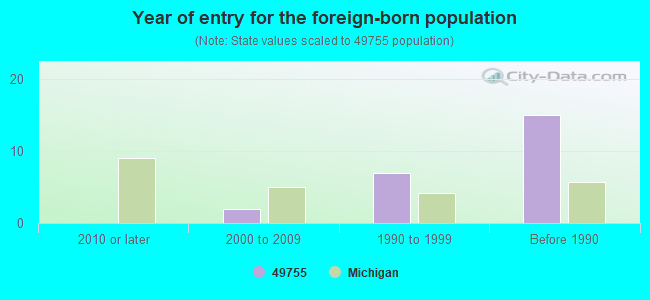
Year of entry for the foreign-born population
02010 or later
22000 to 2009
71990 to 1999
15Before 1990
Facilities with environmental interests located in this zip code:
H & D INC (11101 LEVERING RD LEVERING, MI in MUNRO TWP, MI)
CRITERIA AND HAZARDOUS AIR POLLUTANT INVENTORY (Inventory of air pollution sources) Business SIC classification: ASPHALT PAVING MIXTURES AND BLOCKS Business NAICS classification: ASPHALT PAVING MIXTURE AND BLOCK MANUFACTURING.
Housing units lacking complete plumbing facilities: 5.2% Housing units lacking complete kitchen facilities: 4.7%
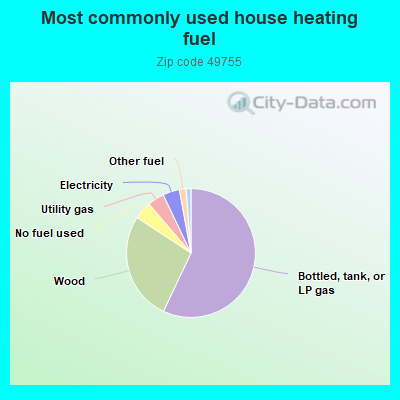
57.2%Bottled, tank, or LP gas
27.3%Wood
4.5%No fuel used
4.2%Utility gas
4.2%Electricity
1.7%Other fuel
1.2%Fuel oil, kerosene, etc.
Population in 1990: 1,251. Population change in the 1990s: +789 (+63.1%).
Place of birth for U.S.-born residents:
This state: 1,466
Northeast: 40
Midwest: 86
South: 51
West: 78
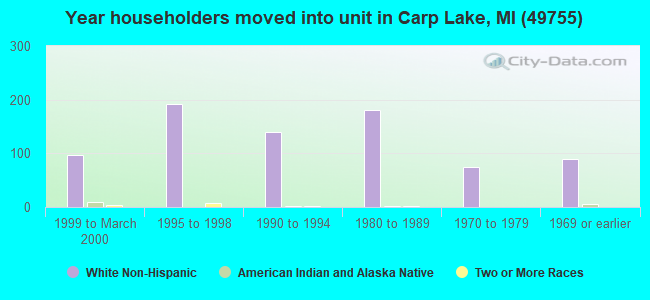
65% of the 49755 zip code residents lived in the same house 5 years ago. Out of people who lived in different houses, 30% lived in this county. Out of people who lived in different counties, 50% lived in Michigan.
93% of the 49755 zip code residents lived in the same house 1 year ago. Out of people who lived in different houses, 24% moved from this county. Out of people who lived in different houses, 59% moved from different county within same state. Out of people who lived in different houses, 17% moved from different state.
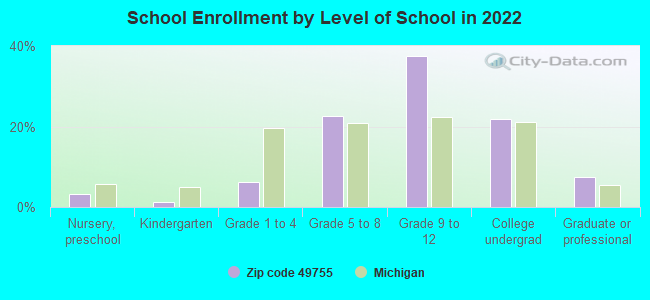
Private vs. public school enrollment:
Students in private schools in grades 1 to 8 (elementary and middle school): 6
Here:
8.5%
Michigan:
12.4%
Students in private schools in grades 9 to 12 (high school): 18
Here:
19.1%
Michigan:
9.8%
Students in private undergraduate colleges:
Here:
0.0%
Michigan:
14.9%
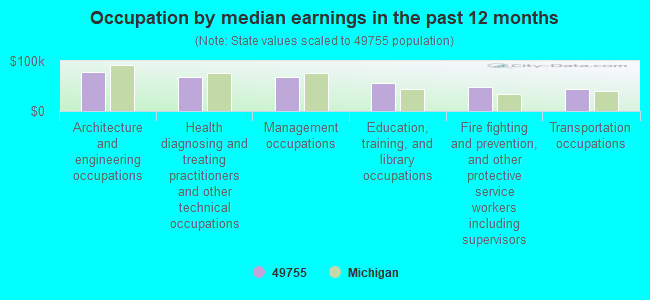
Occupation by median earnings in the past 12 months ($)
77,622Architecture and engineering occupations
68,774Health diagnosing and treating practitioners and other technical occupations
68,390Management occupations
56,805Education, training, and library occupations
47,618Fire fighting and prevention, and other protective service workers including supervisors
44,086Transportation occupations
Top industries in this zip code by the number of employees in 2005:
Administrative and Support and Waste Management and Remediation Services: Professional Employer Organizations (20-49 employees: 2 establishments)
Accommodation and Food Services: Full-Service Restaurants (5-9: 1, 1-4: 1)
Construction: New Single-Family Housing Construction (except Operative Builders) (1-4: 4)
Construction: Site Preparation Contractors (1-4: 4)
Accommodation and Food Services: Drinking Places (Alcoholic Beverages) (5-9: 1)
Construction: Painting and Wall Covering Contractors (1-4: 2)
Administrative and Support and Waste Management and Remediation Services: Landscaping Services (1-4: 2)
People in group quarters in 2010:
9 people in group homes intended for adults
Fatal accident statistics in 2011:
Fatal accident count: 1
Vehicles involved in fatal accidents: 1
Fatal accidents caused by drunken drivers: 1
Fatalities: 1
Persons involved in fatal accidents: 1
Pedestrians involved in fatal accidents: 0
Fatal accident statistics in 2010:
Fatal accident count: 1
Vehicles involved in fatal accidents: 2
Fatal accidents caused by drunken drivers: 0
Fatalities: 1
Persons involved in fatal accidents: 3
Pedestrians involved in fatal accidents: 0
Most common first names in zip code 49755 among deceased individuals
Name
Count
Lived (average)
John
10
75.8 years
Robert
9
71.0 years
Peter
8
78.7 years
Charles
7
74.9 years
Frank
7
79.3 years
William
7
67.3 years
Joseph
6
75.9 years
Harold
6
77.0 years
Anna
6
84.5 years
George
6
74.8 years
Most common last names in zip code 49755 among deceased individuals
Last name
Count
Lived (average)
Mallory
10
76.7 years
Wheelock
8
78.9 years
Keiser
7
66.7 years
Schmalzried
7
88.0 years
Kilpatrick
6
80.5 years
Bonnett
6
83.5 years
Drier
6
79.8 years
Smith
6
84.0 years
Marshall
5
81.4 years
Wenk
5
80.4 years
Discuss Carp Lake, Michigan (MI) on our hugely popular Michigan forum.


 Nearest zip codes: 49769, 49718, 49716, 49701, 49706, 49764.