Estimated zip code population in 2022: 1,705 Zip code population in 2010: 1,644 Zip code population in 2000: 1,515
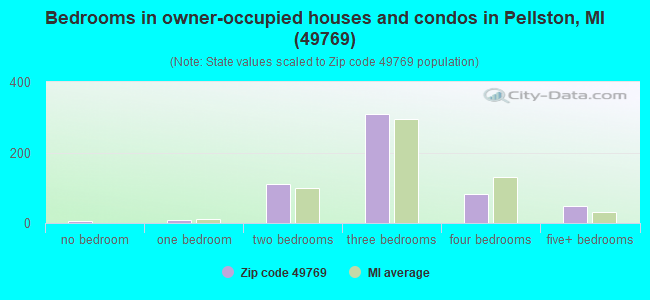
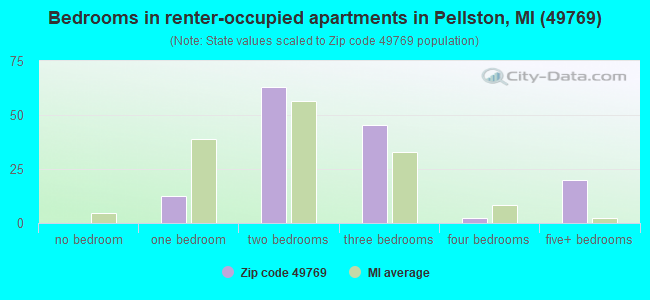
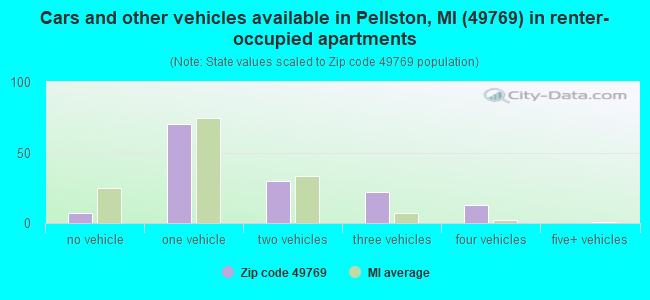
Houses and condos: 953 Renter-occupied apartments: 142
% of renters here:
20%
State:
27%
March 2022 cost of living index in zip code 49769: 81.2 (low, U.S. average is 100)
Land area: 53.4 sq. mi. Water area: 2.8 sq. mi.
Population density: 32 people per square mile
(very low).
OSM Map
General Map
Google Map
MSN Map
OSM Map
General Map
Google Map
MSN Map
OSM Map
General Map
Google Map
MSN Map
OSM Map
General Map
Google Map
MSN Map
Please wait while loading the map...
Real estate property taxes paid for housing units in 2022:
This zip code:
1.1% ($1,600)
Michigan:
1.2% ($2,746)
Median real estate property taxes paid for housing units with mortgages in 2022: $1,673 (1.1%) Median real estate property taxes paid for housing units with no mortgage in 2022: $1,357 (1.0%)
Business Search- 14 Million verified businesses
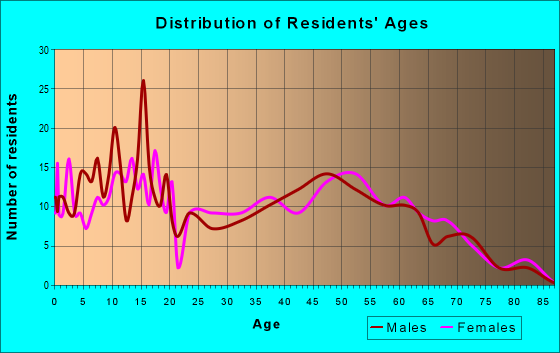
Males: 888
(52.1%)
Females: 817
(47.9%)
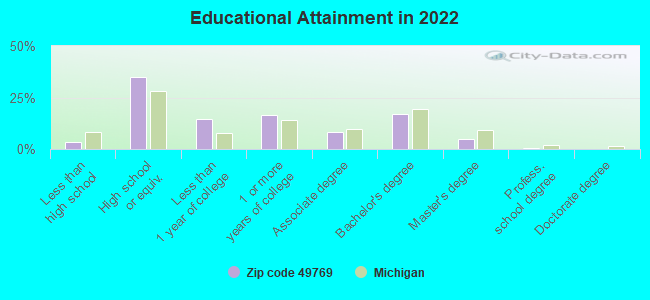
For population 25 years and over in 49769:
High school or higher: 95.8%
Bachelor's degree or higher: 21.9%
Graduate or professional degree: 5.3%
Unemployed: 6.2%
Mean travel time to work (commute): 25.0 minutes
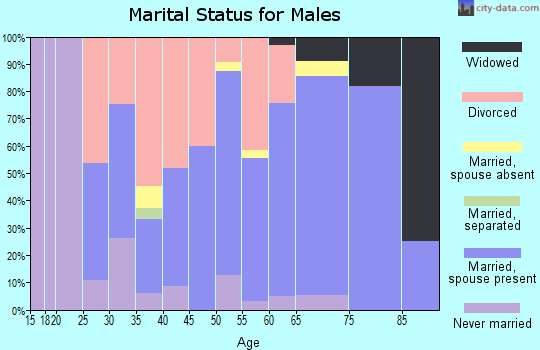
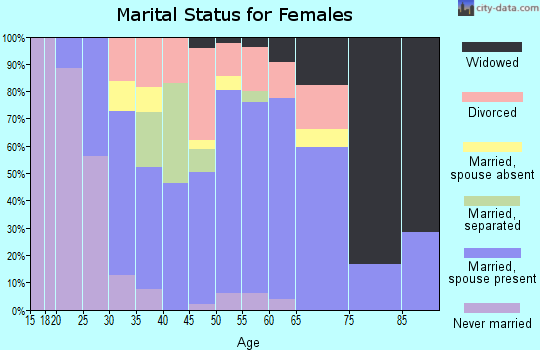
For population 15 years and over in 49769:
Never married: 29.0%
Now married: 53.9%
Separated: 1.3%
Widowed: 6.0%
Divorced: 9.9%
Zip code 49769 compared to state average:
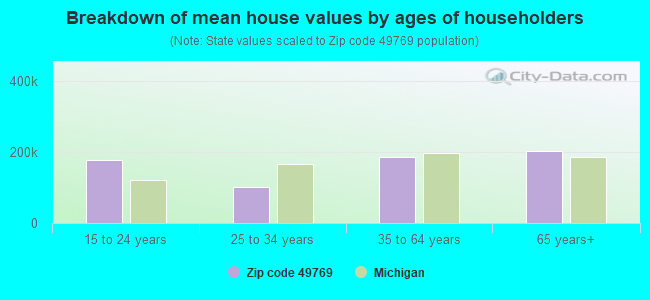
Median house value below state average.
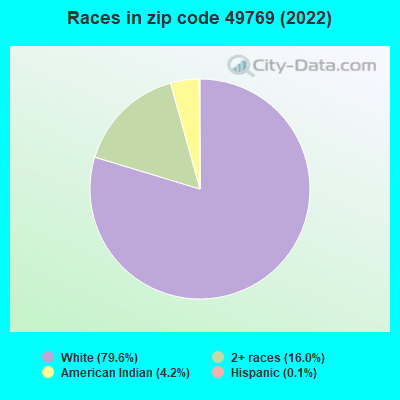
Black race population percentage significantly below state average.
Hispanic race population percentage significantly below state average.
Median age below state average.
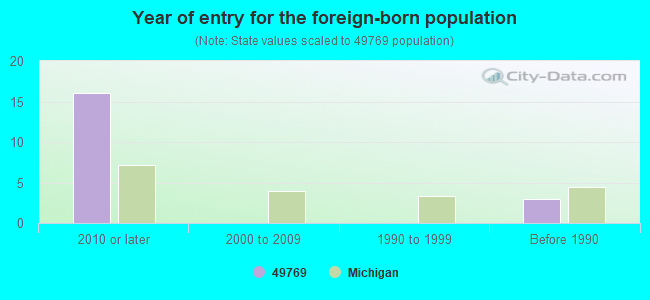
Foreign-born population percentage significantly below state average.
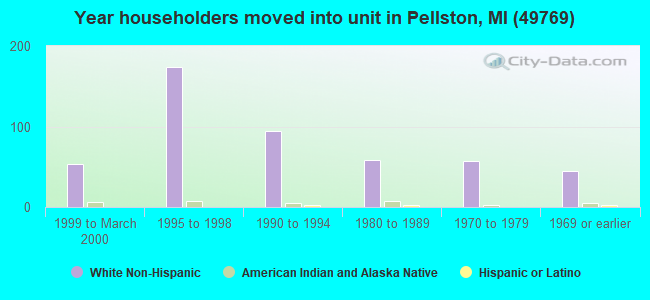
Length of stay since moving in significantly above state average.
Percentage of population with a bachelor's degree or higher below state average.
Estimated median house/condo value in 2022: $143,946
49769:
$143,946
Michigan:
$224,400
According to our research of Michigan and other state lists, there were 6 registered sex offenders living in 49769 zip code as of April 19, 2024. The ratio of all residents to sex offenders in zip code 49769 is 280 to 1. The ratio of registered sex offenders to all residents in this zip code is near the state average.
Median resident age:
This zip code:
36.2 years
Michigan median age:
40.3 years
Average household size:
This zip code:
2.4 people
Michigan:
2.4 people
Averages for the 2020 tax year for zip code 49769, filed in 2021:
Average Adjusted Gross Income (AGI) in 2020: $43,999 (Individual Income Tax Returns)
Here:
$43,999
State:
$68,945
Salary/wage: $34,521 (reported on 83.3% of returns)
Here:
$34,521
State:
$57,142
(% of AGI for various income ranges: 1131.5% for AGIs below $25k, 3195.7% for AGIs $25k-50k, 6872.2% for AGIs $50k-75k, 8086.7% for AGIs $75k-100k, 14852.5% for AGIs $100k-200k)
Taxable interest for individuals: $458 (reported on 22.6% of returns)
This zip code:
$458
Michigan:
$1,630
(% of AGI for various income ranges: 6.5% for AGIs below $25k, 8.7% for AGIs $25k-50k, 21.1% for AGIs $50k-75k, 87.5% for AGIs $100k-200k)
Ordinary dividends: $4,460 (reported on 11.9% of returns)
Here:
$4,460
State:
$6,972
(% of AGI for various income ranges: 11.0% for AGIs below $25k, 10.0% for AGIs $25k-50k, 61.1% for AGIs $50k-75k, 865.0% for AGIs $100k-200k)
Net capital gain/loss in AGI: +$7,080 (reported on 11.9% of returns)
Here:
+$7,080
State:
+$20,064
(% of AGI for various income ranges: 23.5% for AGIs below $25k, 76.7% for AGIs $50k-75k, 1480.0% for AGIs $100k-200k)
Profit/loss from business: +$7,340 (reported on 11.9% of returns)
Here:
+$7,340
State:
+$11,172
(% of AGI for various income ranges: 64.0% for AGIs below $25k, 140.4% for AGIs $25k-50k, 138.9% for AGIs $50k-75k, 526.7% for AGIs $75k-100k)
Taxable individual retirement arrangement distribution: $12,414 (reported on 8.3% of returns)
49769:
$12,414
Michigan:
$19,803
(% of AGI for various income ranges: 81.5% for AGIs below $25k, 70.9% for AGIs $25k-50k, 1810.0% for AGIs $75k-100k)
Earned income credit: $2,336 (reported on 16.7% of returns)
Here:
$2,336
State:
$2,251
(% of AGI for various income ranges: 76.5% for AGIs below $25k, 75.7% for AGIs $25k-50k)
Percentage of individuals using paid preparers for their 2020 taxes: 94.0%
Here:
94%
State:
93%
(% for various income ranges: 90.0% for AGIs below $25k, 100.0% for AGIs $25k-50k, 92.9% for AGIs $50k-75k, 80.0% for AGIs $75k-100k, 100.0% for AGIs $100k-200k)
Averages for the 2012 tax year for zip code 49769, filed in 2013:
Average Adjusted Gross Income (AGI) in 2012: $34,108 (Individual Income Tax Returns)
Here:
$34,108
State:
$55,609
Salary/wage: $26,798 (reported on 84.6% of returns)
Here:
$26,798
State:
$46,782
(% of AGI for various income ranges: 70.3% for AGIs below $25k, 73.5% for AGIs $25k-50k, 75.5% for AGIs $50k-75k, 65.8% for AGIs $75k-100k, 43.5% for AGIs $100k-200k)
Taxable interest for individuals: $389 (reported on 24.4% of returns)
This zip code:
$389
Michigan:
$1,491
(% of AGI for various income ranges: 0.4% for AGIs below $25k, 0.3% for AGIs $50k-75k, 0.5% for AGIs $75k-100k, 0.2% for AGIs $100k-200k)
Ordinary dividends: $2,100 (reported on 10.3% of returns)
Here:
$2,100
State:
$6,225
(% of AGI for various income ranges: 0.2% for AGIs below $25k, 0.9% for AGIs $25k-50k, 2.3% for AGIs $75k-100k)
Net capital gain/loss in AGI: +$2,933 (reported on 7.7% of returns)
Here:
+$2,933
State:
+$9,326
Profit/loss from business: +$6,529 (reported on 17.9% of returns)
Here:
+$6,529
State:
+$11,523
(% of AGI for various income ranges: 8.2% for AGIs below $25k, 4.6% for AGIs $25k-50k, 3.1% for AGIs $50k-75k)
Taxable individual retirement arrangement distribution: $9,225 (reported on 10.3% of returns)
49769:
$9,225
Michigan:
$15,298
(% of AGI for various income ranges: 2.7% for AGIs below $25k, 2.9% for AGIs $25k-50k, 9.4% for AGIs $75k-100k)
Total itemized deductions: $16,667 (25% of AGI, reported on 15.4% of returns)
Here:
$16,667
State:
$21,628
Here:
25.5% of AGI
State:
18.4% of AGI
(% of AGI for various income ranges: 5.5% for AGIs below $25k, 6.4% for AGIs $25k-50k, 7.6% for AGIs $50k-75k, 8.1% for AGIs $75k-100k, 10.6% for AGIs $100k-200k)
Charity contributions: $2,233 (reported on 11.5% of returns)
Here:
$2,233
State:
$4,225
(% of AGI for various income ranges: 1.1% for AGIs $25k-50k, 0.7% for AGIs $50k-75k, 1.7% for AGIs $100k-200k)
Taxes paid: $4,742 (reported on 15.4% of returns)
49769:
$4,742
State:
$8,327
(% of AGI for various income ranges: 1.0% for AGIs below $25k, 1.5% for AGIs $25k-50k, 1.7% for AGIs $50k-75k, 3.2% for AGIs $75k-100k, 3.7% for AGIs $100k-200k)
Earned income credit: $2,410 (reported on 26.9% of returns)
Here:
$2,410
State:
$2,306
(% of AGI for various income ranges: 7.9% for AGIs below $25k, 1.4% for AGIs $25k-50k)
Percentage of individuals using paid preparers for their 2012 taxes: 52.6%
Here:
53%
State:
57%
(% for various income ranges: 47.6% for AGIs below $25k, 57.9% for AGIs $25k-50k, 55.6% for AGIs $50k-75k, 60.0% for AGIs $75k-100k, 66.7% for AGIs $100k-200k)
Averages for the 2004 tax year for zip code 49769, filed in 2005:
Average Adjusted Gross Income (AGI) in 2004: $30,177 (Individual Income Tax Returns)
Here:
$30,177
State:
$48,204
Salary/wage: $25,774 (reported on 87.4% of returns)
Here:
$25,774
State:
$42,791
(% of AGI for various income ranges: 85.0% for AGIs below $10k, 78.6% for AGIs $10k-25k, 84.5% for AGIs $25k-50k, 74.6% for AGIs $50k-75k, 61.8% for AGIs $75k-100k, 48.9% for AGIs over 100k)
Taxable interest for individuals: $731 (reported on 32.1% of returns)
This zip code:
$731
Michigan:
$1,725
(% of AGI for various income ranges: 1.8% for AGIs below $10k, 0.9% for AGIs $10k-25k, 0.5% for AGIs $25k-50k, 1.2% for AGIs $50k-75k, 0.4% for AGIs $75k-100k, 0.6% for AGIs over 100k)
Taxable dividends: $905 (reported on 11.2% of returns)
Here:
$905
State:
$3,420
(% of AGI for various income ranges: 0.3% for AGIs $10k-25k, 0.2% for AGIs $25k-50k, 0.3% for AGIs $50k-75k, 1.6% for AGIs $75k-100k)
Net capital gain/loss: +$6,091 (reported on 8.8% of returns)
Here:
+$6,091
State:
+$8,532
(% of AGI for various income ranges: -2.9% for AGIs below $10k, 0.2% for AGIs $25k-50k, 1.1% for AGIs $50k-75k, 12.9% for AGIs over 100k)
Profit/loss from business: +$6,739 (reported on 17.8% of returns)
Here:
+$6,739
State:
+$9,547
(% of AGI for various income ranges: 18.3% for AGIs below $10k, 5.8% for AGIs $10k-25k, 4.1% for AGIs $25k-50k, 4.1% for AGIs $50k-75k)
IRA payment deduction: $3,280 (reported on 3.3% of returns)
49769:
$3,280
Michigan:
$2,875
Total itemized deductions: $13,621 (25% of AGI, reported on 21.4% of returns)
Here:
$13,621
State:
$18,509
Here:
25.4% of AGI
State:
20.7% of AGI
(% of AGI for various income ranges: 9.3% for AGIs $10k-25k, 9.9% for AGIs $25k-50k, 10.0% for AGIs $50k-75k, 8.5% for AGIs $75k-100k, 12.2% for AGIs over 100k)
Charity contributions deductions: $1,895 (3% of AGI, reported on 15.1% of returns)
Here:
$1,895
State:
$3,365
Here:
3.4% of AGI
State:
3.6% of AGI
(% of AGI for various income ranges: 0.6% for AGIs $10k-25k, 0.7% for AGIs $25k-50k, 1.4% for AGIs $50k-75k, 1.1% for AGIs $75k-100k, 1.6% for AGIs over 100k)
Total tax: $3,287 (reported on 67.2% of returns)
49769:
$3,287
State:
$7,691
(% of AGI for various income ranges: 3.8% for AGIs below $10k, 3.9% for AGIs $10k-25k, 5.6% for AGIs $25k-50k, 8.1% for AGIs $50k-75k, 10.6% for AGIs $75k-100k, 13.8% for AGIs over 100k)
Earned income credit: $1,751 (reported on 23.5% of returns)
Here:
$1,751
State:
$1,737
Percentage of individuals using paid preparers for their 2004 taxes: 60.6%
Here:
61%
State:
60%
(% for various income ranges: 53.8% for AGIs below $10k, 62.3% for AGIs $10k-25k, 61.0% for AGIs $25k-50k, 63.6% for AGIs $50k-75k, 60.7% for AGIs $75k-100k, 80.0% for AGIs over 100k)
Household received Food Stamps/SNAP in the past 12 months: 117 Household did not receive Food Stamps/SNAP in the past 12 months: 591
Women who had a birth in the past 12 months: 25 (14 now married, 10 unmarried) Women who did not have a birth in the past 12 months: 347 (182 now married, 163 unmarried)
Housing units in zip code 49769 with a mortgage: 374 (38 second mortgage, 2 home equity loan, 3 both second mortgage and home equity loan) Houses without a mortgage: 3
Median monthly owner costs for units with a mortgage: $1,069 Median monthly owner costs for units without a mortgage: $440
Residents with income below the poverty level in 2022:
This zip code:
8.0%
Whole state:
13.4%
Residents with income below 50% of the poverty level in 2022:
This zip code:
4.0%
Whole state:
6.9%
Median number of rooms in houses and condos:
Here:
6.2
State:
6.5
Median number of rooms in apartments:
Here:
4.6
State:
4.3
Notable locations in this zip code not listed on our city pages
Notable locations in zip code 49769: Maple Tree Corners (A), Camp Pellston (B), Websters Corners (C), Pellston Department of Natural Resources (D), Pellston Branch Library (E), Pellston Fire Department (F). Display/hide their locations on the map
Churches in zip code 49769 include: First Church (A), Saint Nichols Church (B), Grace Community Church (C), Saint Clement Catholic Church (D). Display/hide their locations on the map
Parks in zip code 49769 include: Pioneer Park (1), Pellston Park (2), Pioneer Park (3), Spelling Park (4), Pioneer Picnic Park Historical Marker (5). Display/hide their locations on the map
Size of family households: 226 2-persons, 113 3-persons, 77 4-persons, 44 5-persons, 14 6-persons, 8 7-or-more-persons
Size of nonfamily households: 166 1-person, 37 2-persons, 17 3-persons
249 married couples with children.
93 single-parent households (20 men, 73 women).
96.9% of residents of 49769 zip code speak English at home.
0.6% of residents speak Spanish at home (67% very well, 11% well, 22% not well).
1.6% of residents speak other Indo-European language at home (100% very well).
0.1% of residents speak Asian or Pacific Island language at home (100% very well).
0.3% of residents speak other language at home (100% very well).
Foreign born population: 1 (0.1%) (0.0% of them are naturalized citizens)
:
0.1%
Whole state:
6.9%
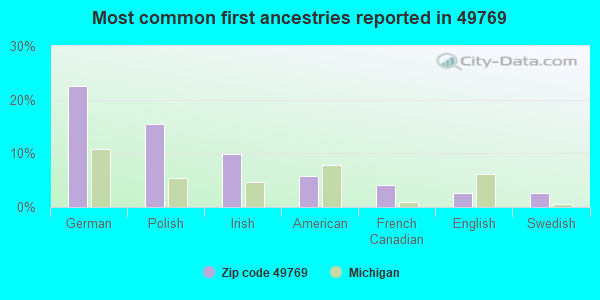
23%German
15%Polish
10%Irish
6%American
4%French Canadian
3%English
3%Swedish
Year of entry for the foreign-born population
162010 or later
02000 to 2009
01990 to 1999
3Before 1990
Facilities with environmental interests located in this zip code:
MI DEPT/CORRECTIONS (1500 ROBINSON RD in PELLSTON, MI)
(Resource Conservation and Recovery Act (tracking hazardous waste)) Alternative names: CAMP PELLSTON
Housing units lacking complete plumbing facilities: 1.6% Housing units lacking complete kitchen facilities: 1.9%
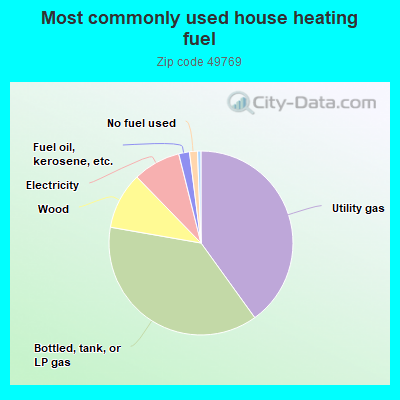
40.2%Utility gas
37.8%Bottled, tank, or LP gas
10.0%Wood
8.4%Electricity
1.9%Fuel oil, kerosene, etc.
1.4%No fuel used
0.6%Other fuel
Population in 1990: 1,360. Population change in the 1990s: +155 (+11.4%).
Place of birth for U.S.-born residents:
This state: 1,483
Northeast: 10
Midwest: 78
South: 79
West: 33
58% of the 49769 zip code residents lived in the same house 5 years ago. Out of people who lived in different houses, 60% lived in this county. Out of people who lived in different counties, 50% lived in Michigan.
93% of the 49769 zip code residents lived in the same house 1 year ago. Out of people who lived in different houses, 52% moved from this county. Out of people who lived in different houses, 36% moved from different county within same state. Out of people who lived in different houses, 12% moved from different state.
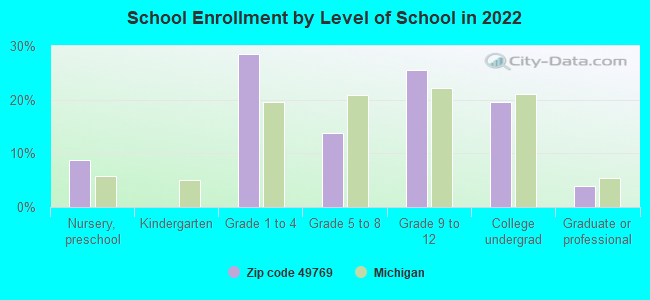
Private vs. public school enrollment:
Students in private schools in grades 1 to 8 (elementary and middle school): 25
Here:
13.9%
Michigan:
12.4%
Students in private schools in grades 9 to 12 (high school): 3
Here:
2.8%
Michigan:
9.8%
Students in private undergraduate colleges: 2
Here:
3.0%
Michigan:
14.9%
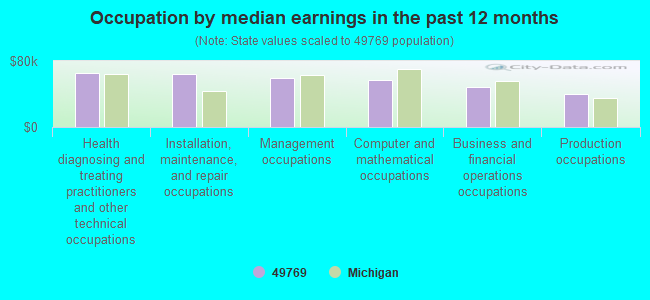
Occupation by median earnings in the past 12 months ($)
65,319Health diagnosing and treating practitioners and other technical occupations
64,058Installation, maintenance, and repair occupations
59,218Management occupations
56,500Computer and mathematical occupations
48,394Business and financial operations occupations
40,122Production occupations
Companies with federal contracts located in this zip code:
COUNTY OF EMMET (US 31 HWY N in PELLSTON, MI) 6 employees, $280000 revenue: $7,334 in 8 contractsfrom 2002 to 2003
Contracts for Lease or Rental of Facilities -- Office Buildings by Public Buildings Service Signed by year:2000: $0; 2001: $0; 2002: $2; 2003: $7,332; 2004: $0; 2005: $0; 2006: $0.
Biggest contracts:
$2,749 with Public Buildings Service for Lease or Rental of Facilities -- Office Buildings. Signed on 2003-09-15. Completion date: 2003-09-15.
$2,749, same as above.Signed on 2003-06-15. Completion date: 2003-06-15.
$916, same as above.Signed on 2003-10-01. Completion date: 2003-11-30.
$916, same as above.Signed on 2003-10-01. Completion date: 2003-11-30.
Top industries in this zip code by the number of employees in 2005:
Construction: New Housing Operative Builders (5-9: 1, 1-4: 1)
Real Estate and Rental and Leasing: Passenger Car Rental (5-9: 1, 1-4: 1)
People in group quarters in 2000:
12 people in college dormitories (includes college quarters off campus)
10 people in other group homes
Fatal accident statistics in 2013:
Fatal accident count: 1
Vehicles involved in fatal accidents: 2
Fatal accidents caused by drunken drivers: 0
Fatalities: 1
Persons involved in fatal accidents: 2
Pedestrians involved in fatal accidents: 0
2002 - 2018 National Fire Incident Reporting System (NFIRS) incidents
According to the data from the years 2002 - 2018 the average number of fires per year is 9. The highest number of reported fires - 14 took place in 2006, and the least - 3 in 2007. The data has a decreasing trend.
When looking into fire subcategories, the most incidents belonged to: Structure Fires (41.7%), and Outside Fires (39.7%).
Fire incident types reported to NFIRS in Zip Code 49769
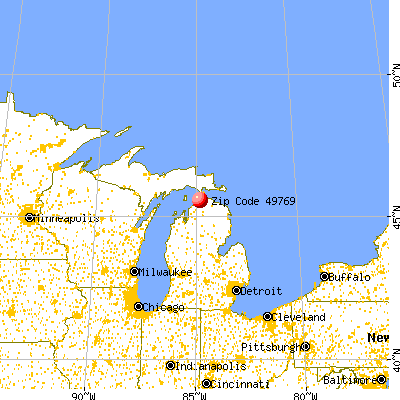


 Nearest zip codes: 49755, 49716, 49722, 49764, 49740, 49706.
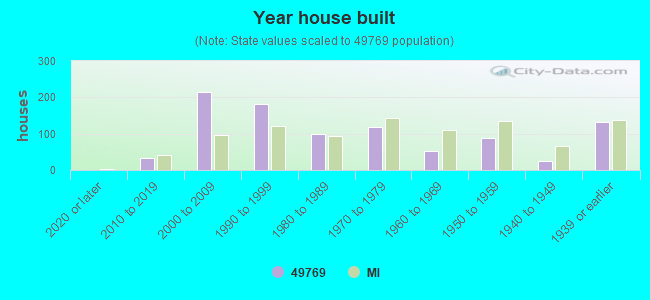


 According to the data from the years 2002 - 2018 the average number of fires per year is 9. The highest number of reported fires - 14 took place in 2006, and the least - 3 in 2007. The data has a decreasing trend.
 When looking into fire subcategories, the most incidents belonged to: Structure Fires (41.7%), and Outside Fires (39.7%).