Estimated zip code population in 2022: 2,023 Zip code population in 2010: 2,047 Zip code population in 2000: 2,024
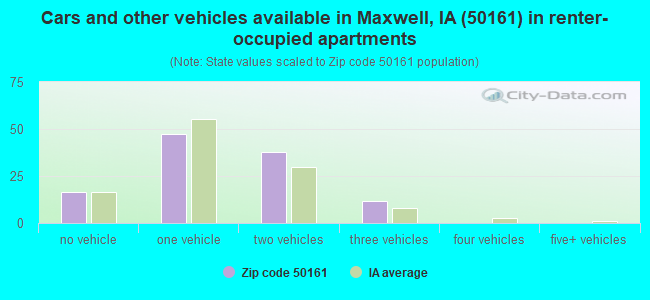
Houses and condos: 907 Renter-occupied apartments: 113
% of renters here:
14%
State:
28%
March 2022 cost of living index in zip code 50161: 83.0 (low, U.S. average is 100)
Land area: 81.4 sq. mi. Water area: 0.3 sq. mi.
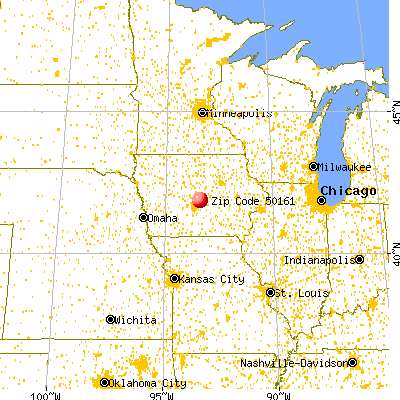
Population density: 25 people per square mile
(very low).
OSM Map
General Map
Google Map
MSN Map
OSM Map
General Map
Google Map
MSN Map
OSM Map
General Map
Google Map
MSN Map
OSM Map
General Map
Google Map
MSN Map
Please wait while loading the map...
Real estate property taxes paid for housing units in 2022:
This zip code:
1.3% ($2,742)
Iowa:
1.4% ($2,724)
Median real estate property taxes paid for housing units with mortgages in 2022: $3,064 (1.4%) Median real estate property taxes paid for housing units with no mortgage in 2022: $2,115 (1.2%)
Business Search- 14 Million verified businesses
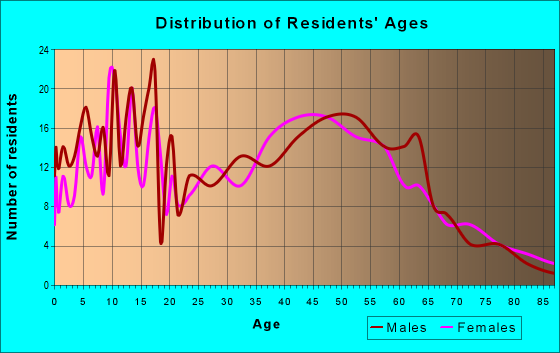
Males: 970
(48.0%)
Females: 1,052
(52.0%)
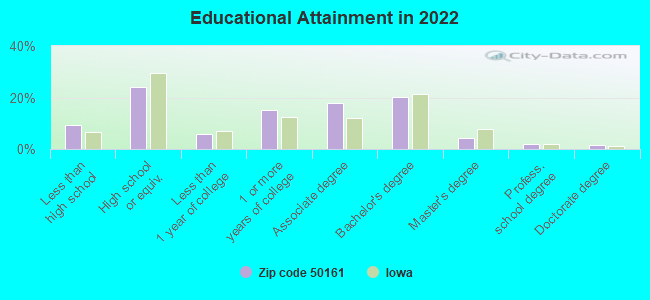
For population 25 years and over in 50161:
High school or higher: 90.8%
Bachelor's degree or higher: 28.0%
Graduate or professional degree: 7.9%
Unemployed: 2.2%
Mean travel time to work (commute): 27.9 minutes
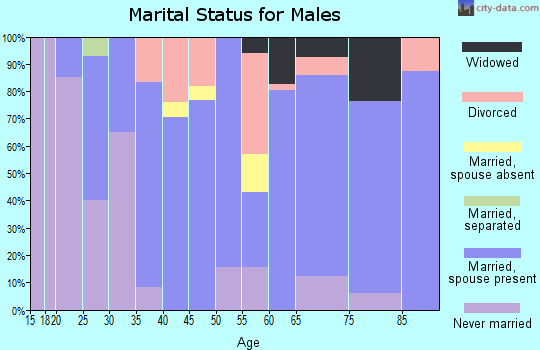
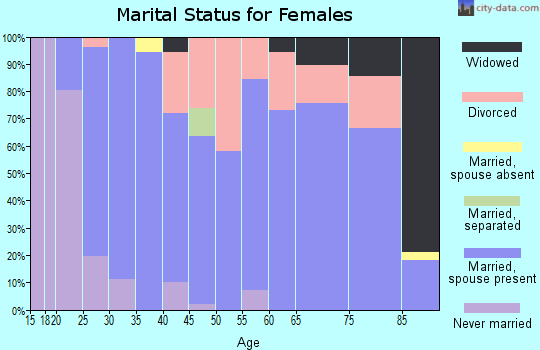
For population 15 years and over in 50161:
Never married: 24.4%
Now married: 62.2%
Separated: 3.2%
Widowed: 3.9%
Divorced: 6.3%
Zip code 50161 compared to state average:
Black race population percentage significantly below state average.
Median age above state average.
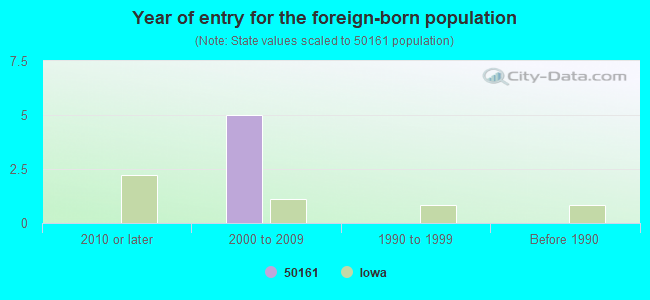
Foreign-born population percentage significantly below state average.
Renting percentage below state average.
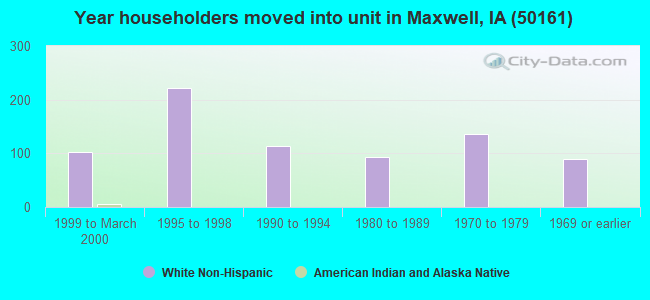
Length of stay since moving in significantly below state average.
Number of college students significantly below state average.
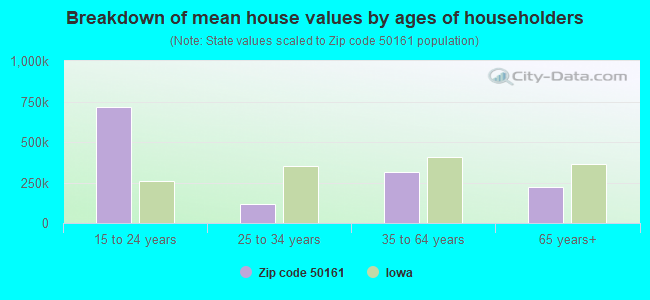
Estimated median house/condo value in 2022: $204,244
50161:
$204,244
Iowa:
$194,600
According to our research of Iowa and other state lists, there were 3 registered sex offenders living in 50161 zip code as of April 25, 2024. The ratio of all residents to sex offenders in zip code 50161 is 587 to 1. The ratio of registered sex offenders to all residents in this zip code is lower than the state average.
Median resident age:
This zip code:
43.1 years
Iowa median age:
38.9 years
Average household size:
This zip code:
2.4 people
Iowa:
2.3 people
Averages for the 2020 tax year for zip code 50161, filed in 2021:
Average Adjusted Gross Income (AGI) in 2020: $69,998 (Individual Income Tax Returns)
Here:
$69,998
State:
$71,087
Salary/wage: $63,025 (reported on 84.7% of returns)
Here:
$63,025
State:
$57,361
(% of AGI for various income ranges: 1047.5% for AGIs below $25k, 3965.6% for AGIs $25k-50k, 6125.8% for AGIs $50k-75k, 10892.9% for AGIs $75k-100k, 17528.5% for AGIs $100k-200k)
Taxable interest for individuals: $933 (reported on 36.7% of returns)
This zip code:
$933
Iowa:
$1,633
(% of AGI for various income ranges: 18.8% for AGIs below $25k, 24.4% for AGIs $25k-50k, 38.3% for AGIs $50k-75k, 101.4% for AGIs $75k-100k, 115.4% for AGIs $100k-200k)
Ordinary dividends: $2,022 (reported on 18.4% of returns)
Here:
$2,022
State:
$5,432
(% of AGI for various income ranges: 23.1% for AGIs below $25k, 75.6% for AGIs $25k-50k, 22.9% for AGIs $75k-100k, 146.2% for AGIs $100k-200k)
Net capital gain/loss in AGI: +$5,843 (reported on 14.3% of returns)
Here:
+$5,843
State:
+$15,243
(% of AGI for various income ranges: 8.1% for AGIs below $25k, 72.5% for AGIs $25k-50k, 82.9% for AGIs $75k-100k, 485.4% for AGIs $100k-200k)
Profit/loss from business: +$8,567 (reported on 15.3% of returns)
Here:
+$8,567
State:
+$11,763
(% of AGI for various income ranges: 107.5% for AGIs below $25k, 161.2% for AGIs $25k-50k, 185.0% for AGIs $50k-75k, 88.6% for AGIs $75k-100k, 439.2% for AGIs $100k-200k)
Taxable individual retirement arrangement distribution: $14,690 (reported on 10.2% of returns)
50161:
$14,690
Iowa:
$17,324
(% of AGI for various income ranges: 251.9% for AGIs below $25k, 419.2% for AGIs $50k-75k, 433.1% for AGIs $100k-200k)
Total itemized deductions: $27,717 (reported on 6.1% of returns)
Here:
$27,717
State:
$33,775
(% of AGI for various income ranges: 359.4% for AGIs $25k-50k, 836.9% for AGIs $100k-200k)
Charity contributions: $5,650 (reported on 4.1% of returns)
Here:
$5,650
State:
$13,075
(% of AGI for various income ranges: 173.8% for AGIs $100k-200k)
Taxes paid: $7,340 (reported on 5.1% of returns)
50161:
$7,340
State:
$7,704
(% of AGI for various income ranges: 68.8% for AGIs below $25k, 197.7% for AGIs $100k-200k)
Earned income credit: $1,756 (reported on 9.2% of returns)
Here:
$1,756
State:
$2,195
(% of AGI for various income ranges: 46.2% for AGIs below $25k, 52.5% for AGIs $25k-50k)
Percentage of individuals using paid preparers for their 2020 taxes: 95.9%
Here:
96%
State:
95%
(% for various income ranges: 91.7% for AGIs below $25k, 95.5% for AGIs $25k-50k, 100.0% for AGIs $50k-75k, 91.7% for AGIs $75k-100k, 100.0% for AGIs $100k-200k, 100.0% for AGIs over 200k)
Averages for the 2012 tax year for zip code 50161, filed in 2013:
Average Adjusted Gross Income (AGI) in 2012: $60,970 (Individual Income Tax Returns)
Here:
$60,970
State:
$58,860
Salary/wage: $51,517 (reported on 84.4% of returns)
Here:
$51,517
State:
$46,659
(% of AGI for various income ranges: 71.4% for AGIs below $25k, 78.0% for AGIs $25k-50k, 78.3% for AGIs $50k-75k, 75.8% for AGIs $75k-100k, 74.2% for AGIs $100k-200k, 46.4% for AGIs over 200k)
Taxable interest for individuals: $997 (reported on 41.1% of returns)
This zip code:
$997
Iowa:
$1,537
(% of AGI for various income ranges: 0.7% for AGIs below $25k, 1.1% for AGIs $25k-50k, 1.0% for AGIs $50k-75k, 0.7% for AGIs $75k-100k, 0.6% for AGIs $100k-200k)
Ordinary dividends: $1,712 (reported on 18.9% of returns)
Here:
$1,712
State:
$4,542
(% of AGI for various income ranges: 1.3% for AGIs $25k-50k, 0.6% for AGIs $50k-75k, 0.4% for AGIs $75k-100k, 0.6% for AGIs $100k-200k)
Net capital gain/loss in AGI: +$19,136 (reported on 15.6% of returns)
Here:
+$19,136
State:
+$11,802
(% of AGI for various income ranges: 0.4% for AGIs $50k-75k, 0.7% for AGIs $75k-100k, 17.0% for AGIs $100k-200k)
Profit/loss from business: +$8,875 (reported on 17.8% of returns)
Here:
+$8,875
State:
+$10,509
(% of AGI for various income ranges: 6.1% for AGIs below $25k, 3.3% for AGIs $25k-50k, 2.8% for AGIs $50k-75k, 1.2% for AGIs $75k-100k, 3.9% for AGIs $100k-200k)
Taxable individual retirement arrangement distribution: $6,425 (reported on 8.9% of returns)
50161:
$6,425
Iowa:
$11,773
Total itemized deductions: $19,523 (19% of AGI, reported on 34.4% of returns)
Here:
$19,523
State:
$21,278
Here:
18.9% of AGI
State:
18.9% of AGI
(% of AGI for various income ranges: 11.8% for AGIs $25k-50k, 9.4% for AGIs $50k-75k, 11.6% for AGIs $75k-100k, 14.4% for AGIs $100k-200k, 9.3% for AGIs over 200k)
Charity contributions: $3,648 (reported on 27.8% of returns)
Here:
$3,648
State:
$4,044
(% of AGI for various income ranges: 1.1% for AGIs $25k-50k, 1.3% for AGIs $50k-75k, 2.2% for AGIs $75k-100k, 3.0% for AGIs $100k-200k)
Taxes paid: $8,094 (reported on 34.4% of returns)
50161:
$8,094
State:
$8,846
(% of AGI for various income ranges: 2.6% for AGIs $25k-50k, 3.6% for AGIs $50k-75k, 4.3% for AGIs $75k-100k, 6.7% for AGIs $100k-200k, 5.8% for AGIs over 200k)
Earned income credit: $1,882 (reported on 12.2% of returns)
Here:
$1,882
State:
$2,098
(% of AGI for various income ranges: 4.8% for AGIs below $25k, 0.8% for AGIs $25k-50k)
Percentage of individuals using paid preparers for their 2012 taxes: 63.3%
Here:
63%
State:
65%
(% for various income ranges: 56.0% for AGIs below $25k, 63.6% for AGIs $25k-50k, 60.0% for AGIs $50k-75k, 69.2% for AGIs $75k-100k, 75.0% for AGIs $100k-200k, 66.7% for AGIs over 200k)
Averages for the 2004 tax year for zip code 50161, filed in 2005:
Average Adjusted Gross Income (AGI) in 2004: $43,869 (Individual Income Tax Returns)
Here:
$43,869
State:
$43,875
Salary/wage: $42,654 (reported on 84.4% of returns)
Here:
$42,654
State:
$38,265
(% of AGI for various income ranges: 92.8% for AGIs below $10k, 64.9% for AGIs $10k-25k, 81.7% for AGIs $25k-50k, 85.4% for AGIs $50k-75k, 87.4% for AGIs $75k-100k, 79.1% for AGIs over 100k)
Taxable interest for individuals: $966 (reported on 54.1% of returns)
This zip code:
$966
Iowa:
$1,768
(% of AGI for various income ranges: 9.8% for AGIs below $10k, 3.1% for AGIs $10k-25k, 1.5% for AGIs $25k-50k, 0.8% for AGIs $50k-75k, 0.5% for AGIs $75k-100k, 0.6% for AGIs over 100k)
Taxable dividends: $1,059 (reported on 25.4% of returns)
Here:
$1,059
State:
$2,510
(% of AGI for various income ranges: 2.4% for AGIs below $10k, 0.8% for AGIs $10k-25k, 1.0% for AGIs $25k-50k, 0.3% for AGIs $50k-75k, 0.2% for AGIs $75k-100k, 0.8% for AGIs over 100k)
Net capital gain/loss: +$2,375 (reported on 17.5% of returns)
Here:
+$2,375
State:
+$6,139
(% of AGI for various income ranges: -4.5% for AGIs below $10k, 0.8% for AGIs $10k-25k, 0.5% for AGIs $25k-50k, 0.2% for AGIs $50k-75k, 0.2% for AGIs $75k-100k, 3.6% for AGIs over 100k)
Profit/loss from business: +$4,111 (reported on 18.6% of returns)
Here:
+$4,111
State:
+$8,574
(% of AGI for various income ranges: 10.7% for AGIs below $10k, 5.7% for AGIs $10k-25k, -0.2% for AGIs $25k-50k, 2.1% for AGIs $50k-75k, 2.8% for AGIs $75k-100k, 0.0% for AGIs over 100k)
Profit/loss from farming: +$2,182 (reported on 11.4% of returns)
Here:
+$2,182
State:
-$74
(% of AGI for various income ranges: -14.7% for AGIs below $10k, -0.8% for AGIs $10k-25k, 1.1% for AGIs $25k-50k, 2.4% for AGIs $50k-75k, -0.6% for AGIs $75k-100k)
IRA payment deduction: $2,667 (reported on 3.4% of returns)
50161:
$2,667
Iowa:
$2,970
Total itemized deductions: $14,650 (21% of AGI, reported on 36.8% of returns)
Here:
$14,650
State:
$16,976
Here:
21.2% of AGI
State:
20.8% of AGI
(% of AGI for various income ranges: 9.8% for AGIs $10k-25k, 11.6% for AGIs $25k-50k, 11.4% for AGIs $50k-75k, 15.3% for AGIs $75k-100k, 13.6% for AGIs over 100k)
Charity contributions deductions: $2,218 (3% of AGI, reported on 30.6% of returns)
Here:
$2,218
State:
$3,089
Here:
3.0% of AGI
State:
3.6% of AGI
(% of AGI for various income ranges: 1.0% for AGIs $10k-25k, 1.0% for AGIs $25k-50k, 1.2% for AGIs $50k-75k, 2.6% for AGIs $75k-100k, 2.2% for AGIs over 100k)
Total tax: $4,948 (reported on 82.1% of returns)
50161:
$4,948
State:
$6,177
(% of AGI for various income ranges: 4.0% for AGIs below $10k, 5.4% for AGIs $10k-25k, 6.3% for AGIs $25k-50k, 8.0% for AGIs $50k-75k, 10.2% for AGIs $75k-100k, 15.6% for AGIs over 100k)
Earned income credit: $1,506 (reported on 10.0% of returns)
Here:
$1,506
State:
$1,540
Percentage of individuals using paid preparers for their 2004 taxes: 69.3%
Here:
69%
State:
70%
(% for various income ranges: 61.9% for AGIs below $10k, 69.1% for AGIs $10k-25k, 70.6% for AGIs $25k-50k, 74.5% for AGIs $50k-75k, 67.5% for AGIs $75k-100k, 68.5% for AGIs over 100k)
Household received Food Stamps/SNAP in the past 12 months: 97 Household did not receive Food Stamps/SNAP in the past 12 months: 734
Women who had a birth in the past 12 months: 29 (30 now married, 0 unmarried) Women who did not have a birth in the past 12 months: 385 (222 now married, 162 unmarried)
Housing units in zip code 50161 with a mortgage: 420 (53 second mortgage, 3 home equity loan, 46 both second mortgage and home equity loan) Houses without a mortgage: 3
Median monthly owner costs for units with a mortgage: $1,763 Median monthly owner costs for units without a mortgage: $556
Residents with income below the poverty level in 2022:
This zip code:
5.6%
Whole state:
11.0%
Residents with income below 50% of the poverty level in 2022:
This zip code:
2.7%
Whole state:
5.5%
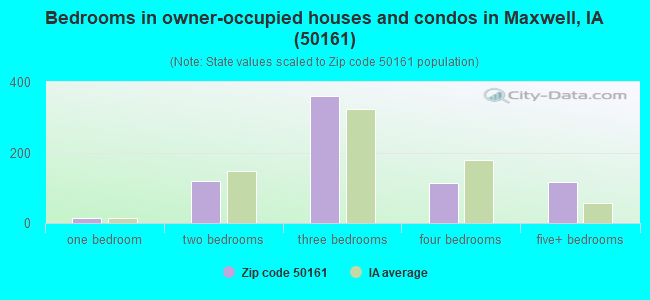
Median number of rooms in houses and condos:
Here:
6.7
State:
6.8
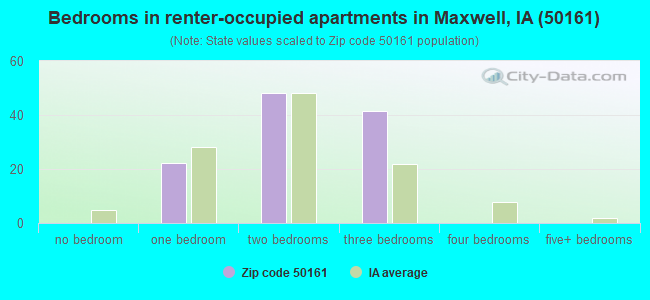
Median number of rooms in apartments:
Here:
4.4
State:
4.2
Notable locations in this zip code not listed on our city pages
Notable locations in zip code 50161: Elwell (A), Peoria City (B), Oldfield (C), Farmers Elevator Company Elevator (D), Community Historical Society Museum (E), Maxwell First Responders (F), Maxwell City Hall (G), Maxwell Public Library (H), Maxwell Volunteer Fire Department (I). Display/hide their locations on the map
Churches in zip code 50161 include: Brethren Church (A), Christian Church (B), First Presbyterian Church (C), United Methodist Church (D), Holy Cross Church (E), Peoria Church (F). Display/hide their locations on the map
Cemeteries: Peoria Cemetery (1), Woodland Cemetery (2), Mount Zion Cemetery (3), United Brethren Cemetery (4), Holy Cross Cemetery (5), Farrar Cemetery (6), Maxwell Cemetery (7). Display/hide their locations on the map
Creeks: Calamus Creek (A), Santiago Creek (B), Rupple Creek (C), Rock Creek (D), West Indian Creek (E), East Indian Creek (F). Display/hide their locations on the map
Size of family households: 367 2-persons, 103 3-persons, 81 4-persons, 77 5-persons, 6 6-persons, 3 7-or-more-persons
Size of nonfamily households: 135 1-person, 60 2-persons
407 married couples with children.
48 single-parent households (16 men, 32 women).
98.1% of residents of 50161 zip code speak English at home.
1.2% of residents speak Spanish at home (100% very well).
0.4% of residents speak other Indo-European language at home (12% very well, 88% well).
Foreign born population: 2 (0.1%) (50.9% of them are naturalized citizens)
This zip code:
0.1%
Whole state:
6.0%
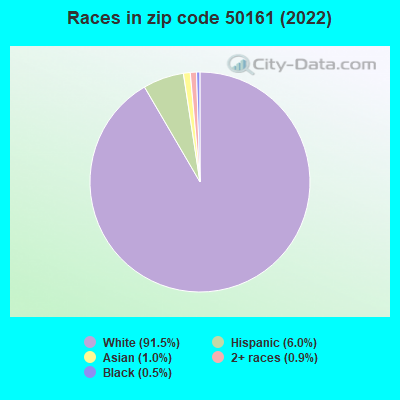
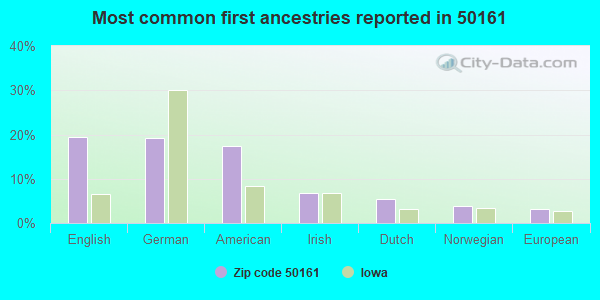
20%English
19%German
17%American
7%Irish
5%Dutch
4%Norwegian
3%European
Year of entry for the foreign-born population
02010 or later
52000 to 2009
01990 to 1999
0Before 1990
Facilities with environmental interests located in this zip code:
COLLINS-MAXWELL MIDDLE/HIGH SCHOOL (400 METCALF ST. in MAXWELL, IA)
(National Center for Education Statistics) - STATE ID-851350 109 Organizations: COLLINS-MAXWELL COMM SCHOOL DISTRICT (SCHOOL DISTRICT)
NORMAN CUMMINGS DBA DAVE-NORM'S AUTO (310 SHORT ST in MAXWELL, IA)
(Resource Conservation and Recovery Act (tracking hazardous waste)) Business NAICS classification: GENERAL AUTOMOTIVE REPAIR.
BONDURANT FARRAR SCHOOLS (NE 134 AVE. AT 112 S in FARRAR, IA)
AIR SYNTHETIC MINOR (AIRS/AFS) Business SIC classification: ELEMENTARY AND SECONDARY SCHOOLS Alternative names: CLOSED FACILITY - BONDURANT FARRAR SCHOOL
COLLINS-MAXWELL C S D (MAXWELL ST in MAXWELL, IA)
COMPLIANCE ACTIVITY (Tracking inspections of insecticide, fungicide, and rodenticide, and toxic substances)
Housing units lacking complete plumbing facilities: 5.7% Housing units lacking complete kitchen facilities: 1.5%
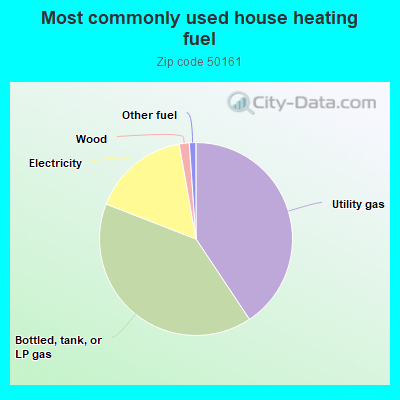
40.7%Utility gas
40.3%Bottled, tank, or LP gas
16.3%Electricity
1.7%Wood
1.1%Other fuel
Population in 1990: 1,268. Population change in the 1990s: +756 (+59.6%).
Place of birth for U.S.-born residents:
This state: 1,622
Northeast: 74
Midwest: 120
South: 50
West: 149
62% of the 50161 zip code residents lived in the same house 5 years ago. Out of people who lived in different houses, 50% lived in this county. Out of people who lived in different counties, 50% lived in Iowa.
94% of the 50161 zip code residents lived in the same house 1 year ago. Out of people who lived in different houses, 33% moved from this county. Out of people who lived in different houses, 63% moved from different county within same state. Out of people who lived in different houses, 4% moved from different state. Out of people who lived in different houses, 2% moved from abroad.
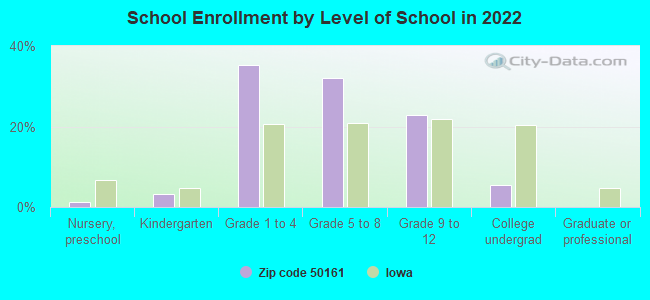
Private vs. public school enrollment:
Students in private schools in grades 1 to 8 (elementary and middle school): 6
Here:
2.1%
Iowa:
10.6%
Students in private schools in grades 9 to 12 (high school): 2
Here:
2.1%
Iowa:
7.9%
Students in private undergraduate colleges: 5
Here:
24.7%
Iowa:
23.9%
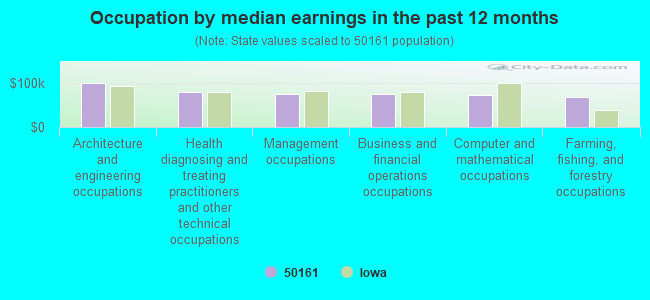
Occupation by median earnings in the past 12 months ($)
99,744Architecture and engineering occupations
78,824Health diagnosing and treating practitioners and other technical occupations
75,783Management occupations
74,291Business and financial operations occupations
72,448Computer and mathematical occupations
67,724Farming, fishing, and forestry occupations
Top industries in this zip code by the number of employees in 2005:
Health Care and Social Assistance: Child Day Care Services (10-19 employees: 1 establishment)
Wholesale Trade: Grain and Field Bean Merchant Wholesalers (10-19: 1)
Finance and Insurance: Commercial Banking (5-9: 1)
Real Estate and Rental and Leasing: Lessors of Residential Buildings and Dwellings (5-9: 1)
Construction: Poured Concrete Foundation and Structure Contractors (5-9: 1)
Other Services (except Public Administration): Other Social Advocacy Organizations (5-9: 1)
Construction: New Single-Family Housing Construction (except Operative Builders) (1-4: 2)
Other Services (except Public Administration): Religious Organizations (1-4: 2)
Home Mortgage Disclosure Act Aggregated Statistics For Year 2009 (Based on 4 partial tracts)
A) FHA, FSA/RHS & VA Home Purchase Loans
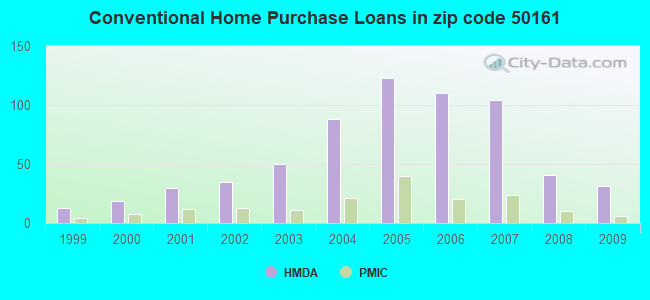
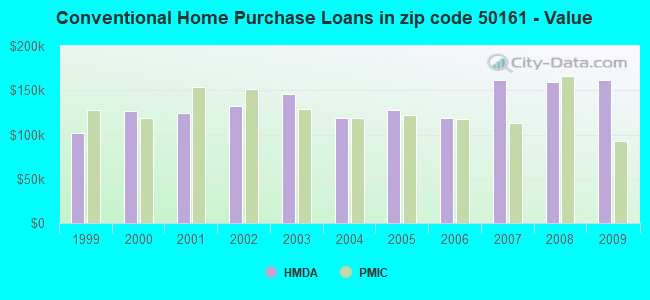
B) Conventional Home Purchase Loans
C) Refinancings
D) Home Improvement Loans
E) Loans on Dwellings For 5+ Families
F) Non-occupant Loans on < 5 Family Dwellings (A B C & D)
G) Loans On Manufactured Home Dwelling (A B C & D)
Number
Average Value
Number
Average Value
Number
Average Value
Number
Average Value
Number
Average Value
Number
Average Value
Number
Average Value
LOANS ORIGINATED
26
$122,940
31
$161,702
202
$176,763
10
$40,871
1
$145,890
6
$83,077
1
$106,040
APPLICATIONS APPROVED, NOT ACCEPTED
2
$113,700
4
$185,205
25
$183,568
0
$0
0
$0
1
$10,570
0
$0
APPLICATIONS DENIED
3
$175,430
6
$117,683
57
$183,274
4
$57,515
0
$0
1
$101,110
2
$64,215
APPLICATIONS WITHDRAWN
2
$153,860
3
$124,473
44
$188,678
3
$29,283
0
$0
1
$18,060
1
$39,120
FILES CLOSED FOR INCOMPLETENESS
1
$104,000
0
$0
5
$180,266
1
$15,170
0
$0
0
$0
0
$0
Aggregated Statistics For Year 2008 (Based on 4 partial tracts)
A) FHA, FSA/RHS & VA Home Purchase Loans
B) Conventional Home Purchase Loans
C) Refinancings
D) Home Improvement Loans
F) Non-occupant Loans on < 5 Family Dwellings (A B C & D)
G) Loans On Manufactured Home Dwelling (A B C & D)
Number
Average Value
Number
Average Value
Number
Average Value
Number
Average Value
Number
Average Value
Number
Average Value
LOANS ORIGINATED
14
$122,712
41
$159,109
89
$159,614
21
$62,584
5
$46,532
2
$30,590
APPLICATIONS APPROVED, NOT ACCEPTED
0
$0
6
$119,397
10
$87,537
3
$72,127
1
$85,220
1
$27,490
APPLICATIONS DENIED
3
$85,687
14
$164,281
50
$154,231
8
$112,772
1
$90,820
4
$15,505
APPLICATIONS WITHDRAWN
1
$78,000
11
$164,054
23
$156,056
3
$164,903
1
$88,280
0
$0
FILES CLOSED FOR INCOMPLETENESS
0
$0
2
$370,490
9
$243,461
0
$0
0
$0
1
$36,110
Aggregated Statistics For Year 2007 (Based on 4 partial tracts)
A) FHA, FSA/RHS & VA Home Purchase Loans
B) Conventional Home Purchase Loans
C) Refinancings
D) Home Improvement Loans
F) Non-occupant Loans on < 5 Family Dwellings (A B C & D)
G) Loans On Manufactured Home Dwelling (A B C & D)
Number
Average Value
Number
Average Value
Number
Average Value
Number
Average Value
Number
Average Value
Number
Average Value
LOANS ORIGINATED
4
$122,900
104
$161,329
109
$144,215
23
$46,474
12
$113,564
5
$68,000
APPLICATIONS APPROVED, NOT ACCEPTED
0
$0
7
$147,620
16
$134,600
4
$39,098
1
$40,440
1
$47,050
APPLICATIONS DENIED
1
$121,670
16
$118,162
68
$145,891
21
$69,137
1
$74,000
5
$57,054
APPLICATIONS WITHDRAWN
0
$0
5
$140,252
20
$136,944
2
$41,225
0
$0
1
$6,340
FILES CLOSED FOR INCOMPLETENESS
0
$0
4
$122,290
14
$133,241
2
$86,665
0
$0
0
$0
Aggregated Statistics For Year 2006 (Based on 4 partial tracts)
A) FHA, FSA/RHS & VA Home Purchase Loans
B) Conventional Home Purchase Loans
C) Refinancings
D) Home Improvement Loans
F) Non-occupant Loans on < 5 Family Dwellings (A B C & D)
G) Loans On Manufactured Home Dwelling (A B C & D)
Number
Average Value
Number
Average Value
Number
Average Value
Number
Average Value
Number
Average Value
Number
Average Value
LOANS ORIGINATED
6
$108,162
110
$118,702
108
$138,874
20
$53,003
8
$93,652
4
$63,108
APPLICATIONS APPROVED, NOT ACCEPTED
1
$82,690
12
$117,697
16
$95,972
3
$122,190
0
$0
1
$90,620
APPLICATIONS DENIED
2
$92,495
25
$163,366
67
$114,918
17
$69,862
3
$95,507
4
$45,998
APPLICATIONS WITHDRAWN
0
$0
11
$112,707
37
$136,751
2
$147,505
2
$92,225
1
$45,460
FILES CLOSED FOR INCOMPLETENESS
0
$0
6
$147,993
21
$147,430
1
$63,550
0
$0
0
$0
Aggregated Statistics For Year 2005 (Based on 4 partial tracts)
A) FHA, FSA/RHS & VA Home Purchase Loans
B) Conventional Home Purchase Loans
C) Refinancings
D) Home Improvement Loans
F) Non-occupant Loans on < 5 Family Dwellings (A B C & D)
G) Loans On Manufactured Home Dwelling (A B C & D)
Number
Average Value
Number
Average Value
Number
Average Value
Number
Average Value
Number
Average Value
Number
Average Value
LOANS ORIGINATED
4
$138,000
123
$127,668
131
$119,824
23
$34,563
17
$82,985
2
$47,310
APPLICATIONS APPROVED, NOT ACCEPTED
0
$0
10
$189,018
24
$164,657
4
$45,205
0
$0
1
$72,940
APPLICATIONS DENIED
0
$0
22
$86,021
72
$136,112
20
$46,944
3
$47,580
8
$77,345
APPLICATIONS WITHDRAWN
1
$53,390
19
$140,891
35
$122,663
4
$138,198
1
$75,570
1
$66,290
FILES CLOSED FOR INCOMPLETENESS
1
$16,920
7
$89,254
21
$154,678
3
$120,340
1
$31,720
1
$86,660
Aggregated Statistics For Year 2004 (Based on 4 partial tracts)
A) FHA, FSA/RHS & VA Home Purchase Loans
B) Conventional Home Purchase Loans
C) Refinancings
D) Home Improvement Loans
E) Loans on Dwellings For 5+ Families
F) Non-occupant Loans on < 5 Family Dwellings (A B C & D)
G) Loans On Manufactured Home Dwelling (A B C & D)
Number
Average Value
Number
Average Value
Number
Average Value
Number
Average Value
Number
Average Value
Number
Average Value
Number
Average Value
LOANS ORIGINATED
2
$133,775
88
$118,479
148
$110,674
36
$38,762
1
$125,810
9
$57,576
7
$100,094
APPLICATIONS APPROVED, NOT ACCEPTED
0
$0
12
$178,015
22
$136,693
1
$25,350
0
$0
1
$53,440
1
$6,870
APPLICATIONS DENIED
3
$79,133
20
$97,080
65
$106,295
10
$36,815
0
$0
1
$43,120
4
$59,292
APPLICATIONS WITHDRAWN
0
$0
8
$109,198
34
$126,553
3
$41,067
0
$0
1
$48,630
1
$97,670
FILES CLOSED FOR INCOMPLETENESS
1
$31,780
3
$122,287
21
$134,900
1
$23,080
0
$0
0
$0
0
$0
Aggregated Statistics For Year 2003 (Based on 2 partial tracts)
A) FHA, FSA/RHS & VA Home Purchase Loans
B) Conventional Home Purchase Loans
C) Refinancings
D) Home Improvement Loans
F) Non-occupant Loans on < 5 Family Dwellings (A B C & D)
Number
Average Value
Number
Average Value
Number
Average Value
Number
Average Value
Number
Average Value
LOANS ORIGINATED
7
$114,314
50
$145,812
173
$132,100
14
$24,606
4
$63,915
APPLICATIONS APPROVED, NOT ACCEPTED
0
$0
2
$144,080
26
$142,329
1
$7,940
0
$0
APPLICATIONS DENIED
1
$142,270
5
$127,830
38
$154,551
4
$20,402
0
$0
APPLICATIONS WITHDRAWN
0
$0
6
$151,180
26
$134,023
0
$0
1
$59,940
FILES CLOSED FOR INCOMPLETENESS
0
$0
3
$88,590
9
$127,027
1
$18,060
0
$0
Aggregated Statistics For Year 2002 (Based on 2 partial tracts)
A) FHA, FSA/RHS & VA Home Purchase Loans
B) Conventional Home Purchase Loans
C) Refinancings
D) Home Improvement Loans
F) Non-occupant Loans on < 5 Family Dwellings (A B C & D)
Number
Average Value
Number
Average Value
Number
Average Value
Number
Average Value
Number
Average Value
LOANS ORIGINATED
1
$46,220
35
$131,667
84
$130,950
14
$27,392
4
$111,400
APPLICATIONS APPROVED, NOT ACCEPTED
1
$52,720
5
$132,740
13
$128,885
1
$54,890
0
$0
APPLICATIONS DENIED
1
$148,050
12
$115,191
24
$115,281
2
$21,305
1
$36,110
APPLICATIONS WITHDRAWN
1
$33,220
6
$93,163
14
$143,305
0
$0
0
$0
FILES CLOSED FOR INCOMPLETENESS
0
$0
1
$78,720
9
$104,559
0
$0
0
$0
Aggregated Statistics For Year 2001 (Based on 2 partial tracts)
A) FHA, FSA/RHS & VA Home Purchase Loans
B) Conventional Home Purchase Loans
C) Refinancings
D) Home Improvement Loans
F) Non-occupant Loans on < 5 Family Dwellings (A B C & D)
Number
Average Value
Number
Average Value
Number
Average Value
Number
Average Value
Number
Average Value
LOANS ORIGINATED
4
$92,802
30
$124,724
80
$119,172
12
$20,342
4
$81,428
APPLICATIONS APPROVED, NOT ACCEPTED
1
$161,050
6
$96,655
12
$111,580
2
$12,640
1
$99,660
APPLICATIONS DENIED
1
$67,890
10
$105,658
27
$111,780
1
$1,440
1
$1,440
APPLICATIONS WITHDRAWN
0
$0
4
$133,788
21
$105,544
0
$0
0
$0
FILES CLOSED FOR INCOMPLETENESS
0
$0
1
$17,330
2
$129,275
0
$0
0
$0
Aggregated Statistics For Year 2000 (Based on 2 partial tracts)
A) FHA, FSA/RHS & VA Home Purchase Loans
B) Conventional Home Purchase Loans
C) Refinancings
D) Home Improvement Loans
F) Non-occupant Loans on < 5 Family Dwellings (A B C & D)
Number
Average Value
Number
Average Value
Number
Average Value
Number
Average Value
Number
Average Value
LOANS ORIGINATED
3
$82,090
19
$127,107
23
$123,527
9
$20,783
1
$48,390
APPLICATIONS APPROVED, NOT ACCEPTED
0
$0
1
$122,050
3
$64,277
0
$0
0
$0
APPLICATIONS DENIED
1
$63,550
11
$76,554
9
$101,509
2
$24,195
0
$0
APPLICATIONS WITHDRAWN
0
$0
4
$113,928
5
$98,796
0
$0
0
$0
FILES CLOSED FOR INCOMPLETENESS
0
$0
1
$225,330
2
$173,690
0
$0
0
$0
Aggregated Statistics For Year 1999 (Based on 1 partial tract)
A) FHA, FSA/RHS & VA Home Purchase Loans
B) Conventional Home Purchase Loans
C) Refinancings
D) Home Improvement Loans
F) Non-occupant Loans on < 5 Family Dwellings (A B C & D)
Detailed PMIC statistics for the following Tracts:0101.01
, 0102.00
2002 - 2018 National Fire Incident Reporting System (NFIRS) incidents
Based on the data from the years 2002 - 2018 the average number of fires per year is 11. The highest number of fire incidents - 30 took place in 2012, and the least - 1 in 2004. The data has a constant trend.
When looking into fire subcategories, the most reports belonged to: Outside Fires (53.5%), and Structure Fires (36.2%).
Fire incident types reported to NFIRS in Zip Code 50161


+$2,182
-$74
(% of AGI for various income ranges: -14.7% for AGIs below $10k, -0.8% for AGIs $10k-25k, 1.1% for AGIs $25k-50k, 2.4% for AGIs $50k-75k, -0.6% for AGIs $75k-100k) Nearest zip codes: 50055, 50046, 50073, 50035, 50168, 50201.


 Based on the data from the years 2002 - 2018 the average number of fires per year is 11. The highest number of fire incidents - 30 took place in 2012, and the least - 1 in 2004. The data has a constant trend.
 When looking into fire subcategories, the most reports belonged to: Outside Fires (53.5%), and Structure Fires (36.2%).