Estimated zip code population in 2022: 1,397 Zip code population in 2010: 932 Zip code population in 2000: 898
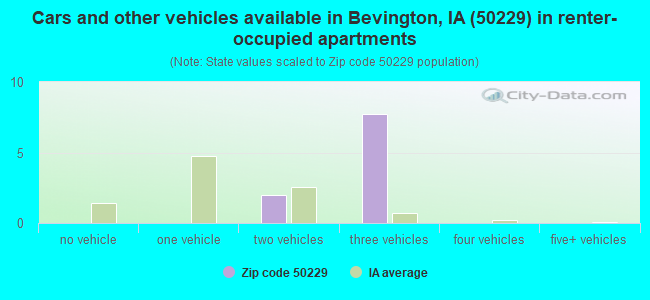
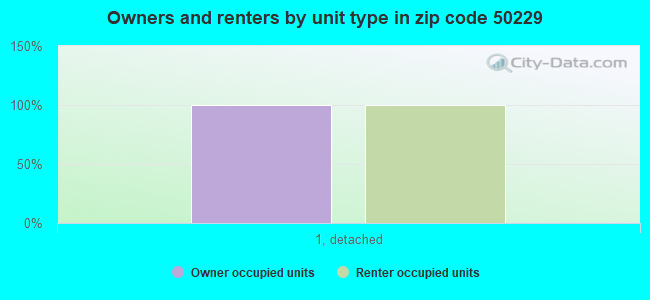
Houses and condos: 570 Renter-occupied apartments: 10
% of renters here:
2%
State:
28%
March 2022 cost of living index in zip code 50229: 81.5 (low, U.S. average is 100)
Land area: 40.7 sq. mi. Water area: 0.1 sq. mi.
Population density: 34 people per square mile
(very low).
OSM Map
General Map
Google Map
MSN Map
OSM Map
General Map
Google Map
MSN Map
OSM Map
General Map
Google Map
MSN Map
OSM Map
General Map
Google Map
MSN Map
Please wait while loading the map...
Real estate property taxes paid for housing units in 2022:
This zip code:
1.1% ($4,478)
Iowa:
1.4% ($2,724)
Median real estate property taxes paid for housing units with mortgages in 2022: $5,056 (1.0%) Median real estate property taxes paid for housing units with no mortgage in 2022: $3,056 (1.0%)
Business Search- 14 Million verified businesses
Males: 669
(47.9%)
Females: 727
(52.1%)
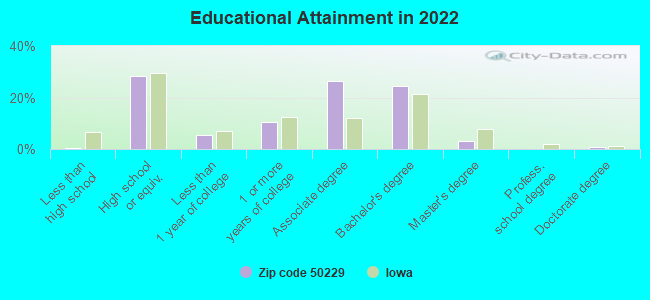
For population 25 years and over in 50229:
High school or higher: 99.5%
Bachelor's degree or higher: 29.0%
Graduate or professional degree: 4.4%
Unemployed: 0.8%
Mean travel time to work (commute): 28.6 minutes
For population 15 years and over in 50229:
Never married: 12.9%
Now married: 65.7%
Separated: 0.0%
Widowed: 5.1%
Divorced: 16.3%
Zip code 50229 compared to state average:
Median household income above state average.
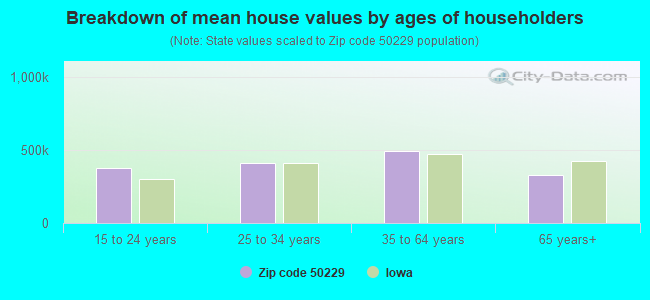
Median house value above state average.
Unemployed percentage significantly below state average.
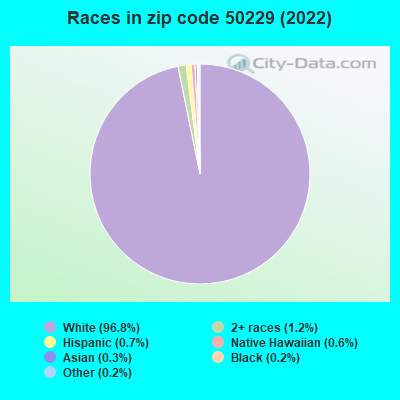
Black race population percentage significantly below state average.
Hispanic race population percentage significantly below state average.
Foreign-born population percentage significantly below state average.
Renting percentage significantly below state average.
Length of stay since moving in significantly below state average.
Number of rooms per house above state average.
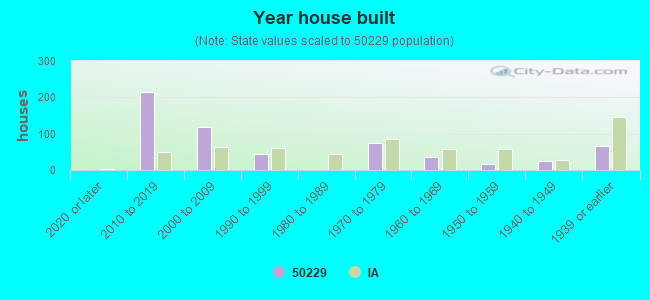
House age below state average.
Number of college students significantly below state average.
Estimated median house/condo value in 2022: $415,990
50229:
$415,990
Iowa:
$194,600
Median resident age:
This zip code:
39.3 years
Iowa median age:
38.9 years
Average household size:
This zip code:
2.8 people
Iowa:
2.3 people
Averages for the 2020 tax year for zip code 50229, filed in 2021:
Average Adjusted Gross Income (AGI) in 2020: $110,398 (Individual Income Tax Returns)
Here:
$110,398
State:
$71,087
Salary/wage: $86,524 (reported on 82.1% of returns)
Here:
$86,524
State:
$57,361
(% of AGI for various income ranges: 1183.3% for AGIs below $25k, 4073.3% for AGIs $25k-50k, 6300.0% for AGIs $50k-75k, 9612.5% for AGIs $75k-100k, 17007.0% for AGIs $100k-200k)
Taxable interest for individuals: $1,232 (reported on 44.6% of returns)
This zip code:
$1,232
Iowa:
$1,633
(% of AGI for various income ranges: 16.7% for AGIs below $25k, 28.3% for AGIs $25k-50k, 12.5% for AGIs $50k-75k, 32.5% for AGIs $75k-100k, 139.0% for AGIs $100k-200k)
Ordinary dividends: $4,044 (reported on 28.6% of returns)
Here:
$4,044
State:
$5,432
(% of AGI for various income ranges: 153.3% for AGIs $25k-50k, 345.0% for AGIs $75k-100k, 313.0% for AGIs $100k-200k)
Net capital gain/loss in AGI: +$13,347 (reported on 26.8% of returns)
Here:
+$13,347
State:
+$15,243
(% of AGI for various income ranges: 275.0% for AGIs $25k-50k, 147.5% for AGIs $75k-100k, 765.0% for AGIs $100k-200k)
Profit/loss from business: +$22,208 (reported on 21.4% of returns)
Here:
+$22,208
State:
+$11,763
(% of AGI for various income ranges: 833.3% for AGIs $25k-50k, 1232.5% for AGIs $75k-100k, 1672.0% for AGIs $100k-200k)
Taxable individual retirement arrangement distribution: $17,938 (reported on 14.3% of returns)
50229:
$17,938
Iowa:
$17,324
(% of AGI for various income ranges: 333.3% for AGIs below $25k, 1212.5% for AGIs $50k-75k, 650.0% for AGIs $100k-200k)
Total itemized deductions: $32,186 (reported on 12.5% of returns)
Here:
$32,186
State:
$33,775
(% of AGI for various income ranges: 900.0% for AGIs $25k-50k, 811.0% for AGIs $100k-200k)
Charity contributions: $5,700 (reported on 8.9% of returns)
Here:
$5,700
State:
$13,075
(% of AGI for various income ranges: 285.0% for AGIs $100k-200k)
Taxes paid: $8,557 (reported on 12.5% of returns)
50229:
$8,557
State:
$7,704
(% of AGI for various income ranges: 258.3% for AGIs $25k-50k, 244.0% for AGIs $100k-200k)
Earned income credit: $2,067 (reported on 5.4% of returns)
Here:
$2,067
State:
$2,195
(% of AGI for various income ranges: 68.9% for AGIs below $25k)
Percentage of individuals using paid preparers for their 2020 taxes: 98.2%
Here:
98%
State:
95%
(% for various income ranges: 92.9% for AGIs below $25k, 100.0% for AGIs $25k-50k, 100.0% for AGIs $50k-75k, 100.0% for AGIs $75k-100k, 100.0% for AGIs $100k-200k, 100.0% for AGIs over 200k)
Averages for the 2012 tax year for zip code 50229, filed in 2013:
Average Adjusted Gross Income (AGI) in 2012: $75,174 (Individual Income Tax Returns)
Here:
$75,174
State:
$58,860
Salary/wage: $61,774 (reported on 84.0% of returns)
Here:
$61,774
State:
$46,659
(% of AGI for various income ranges: 70.7% for AGIs below $25k, 73.1% for AGIs $25k-50k, 72.1% for AGIs $50k-75k, 75.6% for AGIs $75k-100k, 66.4% for AGIs $100k-200k)
Taxable interest for individuals: $1,020 (reported on 40.0% of returns)
This zip code:
$1,020
Iowa:
$1,537
(% of AGI for various income ranges: 1.1% for AGIs below $25k, 0.6% for AGIs $25k-50k, 0.8% for AGIs $50k-75k, 0.4% for AGIs $75k-100k, 0.5% for AGIs $100k-200k)
Ordinary dividends: $3,000 (reported on 28.0% of returns)
Here:
$3,000
State:
$4,542
(% of AGI for various income ranges: 1.1% for AGIs below $25k, 2.5% for AGIs $50k-75k, 1.2% for AGIs $75k-100k, 0.9% for AGIs $100k-200k)
Net capital gain/loss in AGI: +$3,950 (reported on 24.0% of returns)
Here:
+$3,950
State:
+$11,802
(% of AGI for various income ranges: 0.4% for AGIs below $25k, 1.4% for AGIs $50k-75k, 1.7% for AGIs $100k-200k)
Profit/loss from business: +$12,430 (reported on 20.0% of returns)
Here:
+$12,430
State:
+$10,509
(% of AGI for various income ranges: 14.2% for AGIs below $25k, 4.2% for AGIs $50k-75k, 3.2% for AGIs $100k-200k)
Taxable individual retirement arrangement distribution: $10,833 (reported on 12.0% of returns)
50229:
$10,833
Iowa:
$11,773
Total itemized deductions: $22,622 (18% of AGI, reported on 46.0% of returns)
Here:
$22,622
State:
$21,278
Here:
18.4% of AGI
State:
18.9% of AGI
(% of AGI for various income ranges: 25.2% for AGIs below $25k, 15.2% for AGIs $50k-75k, 16.0% for AGIs $75k-100k, 13.5% for AGIs $100k-200k)
Charity contributions: $2,716 (reported on 38.0% of returns)
Here:
$2,716
State:
$4,044
(% of AGI for various income ranges: 0.9% for AGIs below $25k, 1.5% for AGIs $50k-75k, 1.4% for AGIs $75k-100k, 1.5% for AGIs $100k-200k)
Taxes paid: $10,613 (reported on 46.0% of returns)
50229:
$10,613
State:
$8,846
(% of AGI for various income ranges: 6.5% for AGIs below $25k, 5.1% for AGIs $50k-75k, 6.0% for AGIs $75k-100k, 7.6% for AGIs $100k-200k)
Earned income credit: $1,600 (reported on 6.0% of returns)
Here:
$1,600
State:
$2,098
(% of AGI for various income ranges: 2.5% for AGIs below $25k)
Percentage of individuals using paid preparers for their 2012 taxes: 70.0%
Here:
70%
State:
65%
(% for various income ranges: 64.7% for AGIs below $25k, 66.7% for AGIs $25k-50k, 77.8% for AGIs $50k-75k, 66.7% for AGIs $75k-100k, 75.0% for AGIs $100k-200k)
Averages for the 2004 tax year for zip code 50229, filed in 2005:
Average Adjusted Gross Income (AGI) in 2004: $54,578 (Individual Income Tax Returns)
Here:
$54,578
State:
$43,875
Salary/wage: $53,258 (reported on 82.2% of returns)
Here:
$53,258
State:
$38,265
(% of AGI for various income ranges: 131.0% for AGIs below $10k, 63.9% for AGIs $10k-25k, 85.3% for AGIs $25k-50k, 78.4% for AGIs $50k-75k, 85.4% for AGIs $75k-100k, 77.2% for AGIs over 100k)
Taxable interest for individuals: $905 (reported on 58.1% of returns)
This zip code:
$905
Iowa:
$1,768
(% of AGI for various income ranges: 11.5% for AGIs below $10k, 3.0% for AGIs $10k-25k, 0.5% for AGIs $25k-50k, 0.6% for AGIs $50k-75k, 0.6% for AGIs $75k-100k, 1.0% for AGIs over 100k)
Taxable dividends: $1,128 (reported on 35.7% of returns)
Here:
$1,128
State:
$2,510
(% of AGI for various income ranges: 10.2% for AGIs below $10k, 1.7% for AGIs $10k-25k, 0.5% for AGIs $25k-50k, 0.5% for AGIs $50k-75k, 0.7% for AGIs $75k-100k, 0.5% for AGIs over 100k)
Net capital gain/loss: +$3,405 (reported on 28.0% of returns)
Here:
+$3,405
State:
+$6,139
(% of AGI for various income ranges: -8.0% for AGIs below $10k, 1.0% for AGIs $10k-25k, 3.9% for AGIs $25k-50k, 0.9% for AGIs $50k-75k, 0.4% for AGIs $75k-100k, 2.8% for AGIs over 100k)
Profit/loss from business: +$5,526 (reported on 22.9% of returns)
Here:
+$5,526
State:
+$8,574
(% of AGI for various income ranges: 8.6% for AGIs $10k-25k, 5.6% for AGIs $25k-50k, 3.8% for AGIs $50k-75k, -0.1% for AGIs $75k-100k, 0.9% for AGIs over 100k)
IRA payment deduction: $3,429 (reported on 3.4% of returns)
50229:
$3,429
Iowa:
$2,970
Total itemized deductions: $16,659 (21% of AGI, reported on 49.4% of returns)
Here:
$16,659
State:
$16,976
Here:
20.6% of AGI
State:
20.8% of AGI
(% of AGI for various income ranges: 20.4% for AGIs $10k-25k, 14.4% for AGIs $25k-50k, 15.6% for AGIs $50k-75k, 16.3% for AGIs $75k-100k, 13.6% for AGIs over 100k)
Charity contributions deductions: $2,099 (3% of AGI, reported on 43.9% of returns)
Here:
$2,099
State:
$3,089
Here:
2.5% of AGI
State:
3.6% of AGI
(% of AGI for various income ranges: 1.2% for AGIs $10k-25k, 1.9% for AGIs $25k-50k, 1.4% for AGIs $50k-75k, 1.7% for AGIs $75k-100k, 1.9% for AGIs over 100k)
Total tax: $7,121 (reported on 83.4% of returns)
50229:
$7,121
State:
$6,177
(% of AGI for various income ranges: 5.8% for AGIs below $10k, 5.6% for AGIs $10k-25k, 6.5% for AGIs $25k-50k, 8.1% for AGIs $50k-75k, 9.9% for AGIs $75k-100k, 15.6% for AGIs over 100k)
Earned income credit: $1,179 (reported on 6.7% of returns)
Here:
$1,179
State:
$1,540
Percentage of individuals using paid preparers for their 2004 taxes: 74.0%
Here:
74%
State:
70%
(% for various income ranges: 70.0% for AGIs below $10k, 78.0% for AGIs $10k-25k, 65.8% for AGIs $25k-50k, 75.4% for AGIs $50k-75k, 83.1% for AGIs $75k-100k, 71.7% for AGIs over 100k)
Household received Food Stamps/SNAP in the past 12 months: 6 Household did not receive Food Stamps/SNAP in the past 12 months: 498
Women who had a birth in the past 12 months: 9 (9 now married, 0 unmarried) Women who did not have a birth in the past 12 months: 292 (156 now married, 136 unmarried)
Housing units in zip code 50229 with a mortgage: 304 (23 second mortgage, 4 home equity loan, 14 both second mortgage and home equity loan) Median monthly owner costs for units with a mortgage: $2,246 Median monthly owner costs for units without a mortgage: $743
Residents with income below the poverty level in 2022:
This zip code:
3.2%
Whole state:
11.0%
Residents with income below 50% of the poverty level in 2022:
This zip code:
0.6%
Whole state:
5.5%
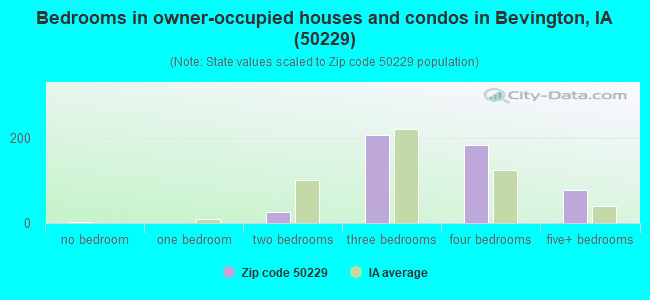
Median number of rooms in houses and condos:
Here:
7.7
State:
6.8
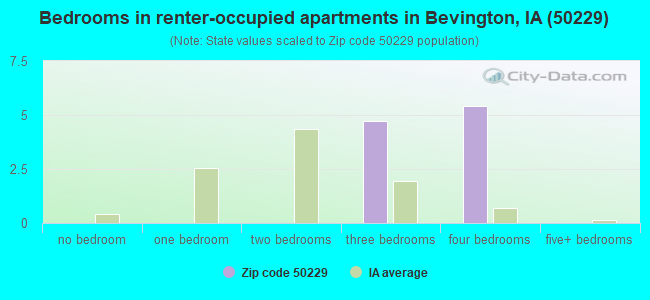
Median number of rooms in apartments:
Here:
6.2
State:
4.2
Notable locations in this zip code not listed on our city pages
Size of family households: 164 2-persons, 92 3-persons, 61 4-persons, 30 5-persons
Size of nonfamily households: 55 1-person, 11 2-persons, 72 3-persons
274 married couples with children.
0 single-parent households ().
98.7% of residents of 50229 zip code speak English at home.
0.9% of residents speak Spanish at home (100% very well).
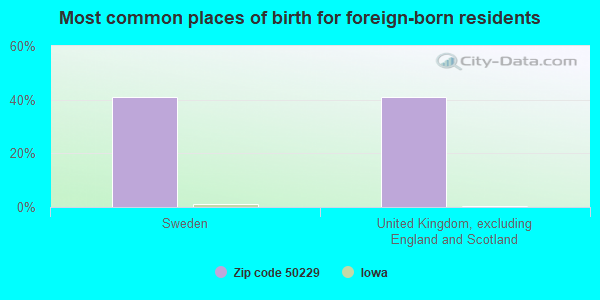
Foreign born population: 17 (1.3%) (0.0% of them are naturalized citizens)
:
1.3%
Whole state:
6.0%
41%Sweden
41%United Kingdom, excluding England and Scotland
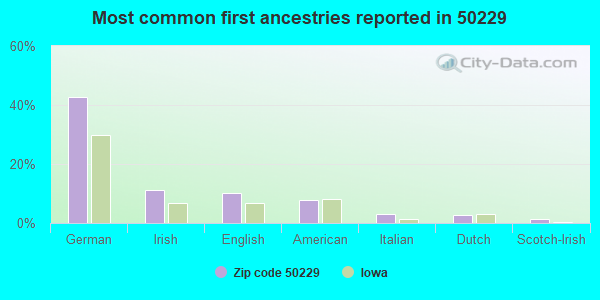
43%German
11%Irish
10%English
8%American
3%Italian
3%Dutch
2%Scotch-Irish
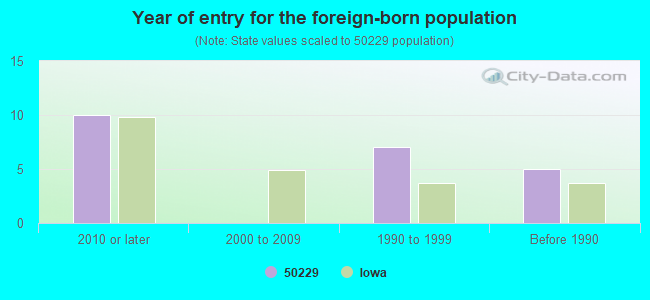
Year of entry for the foreign-born population
102010 or later
02000 to 2009
71990 to 1999
5Before 1990
Facilities with environmental interests located in this zip code:
SEYMOUR FERTILIZER (9 WARREN STREET in PROLE, IA)
COMPLIANCE ACTIVITY (Tracking inspections of insecticide, fungicide, and rodenticide, and toxic substances) (Resource Conservation and Recovery Act (tracking hazardous waste)) - ICIS-, ENFORCEMENT/COMPLIANCE ACTIVITY Business NAICS classification: FERTILIZER (MIXING ONLY) MANUFACTURING. Organizations: TROY WENCK (CONTACT/OPERATOR)
, ROY SEYMOUR (CONTACT/OWNER)
HOWARD HAWBAKER SITE (541 LISBON STREET in PROLE, IA)
(Resource Conservation and Recovery Act (tracking hazardous waste))
Housing units lacking complete plumbing facilities: 8.0% Housing units lacking complete kitchen facilities: 7.9%
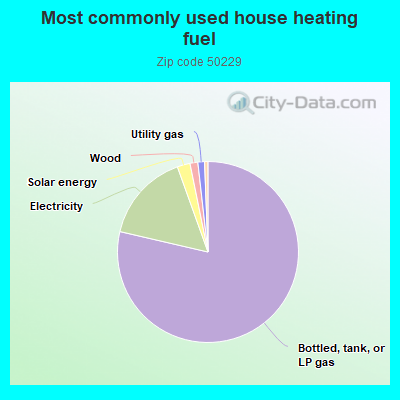
78.8%Bottled, tank, or LP gas
15.9%Electricity
2.3%Solar energy
1.4%Wood
1.2%Utility gas
0.6%No fuel used
Population in 1990: 1,488.
Place of birth for U.S.-born residents:
This state: 1,171
Northeast: 8
Midwest: 101
South: 29
West: 62
60% of the 50229 zip code residents lived in the same house 5 years ago. Out of people who lived in different houses, 26% lived in this county. Out of people who lived in different counties, 50% lived in Iowa.
94% of the 50229 zip code residents lived in the same house 1 year ago. Out of people who lived in different houses, 12% moved from this county. Out of people who lived in different houses, 95% moved from different county within same state.
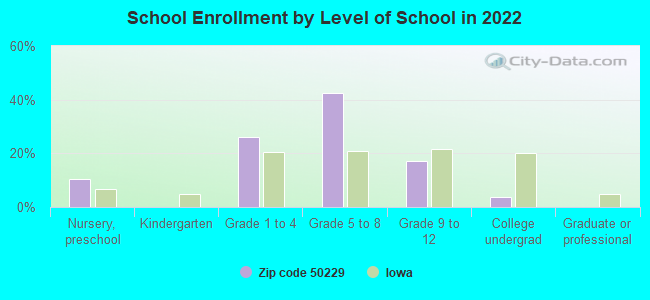
Private vs. public school enrollment:
Students in private schools in grades 1 to 8 (elementary and middle school):
Here:
0.0%
Iowa:
10.6%
Students in private schools in grades 9 to 12 (high school): 9
Here:
19.2%
Iowa:
7.9%
Students in private undergraduate colleges:
Here:
0.0%
Iowa:
23.9%
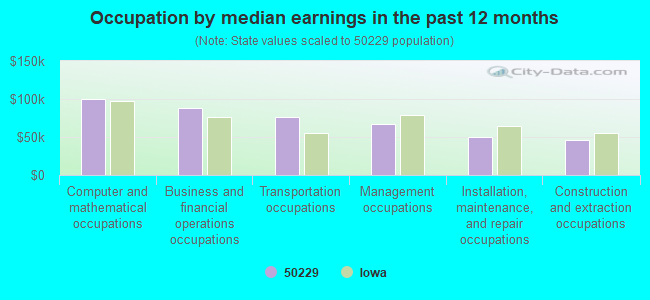
Occupation by median earnings in the past 12 months ($)
100,256Computer and mathematical occupations
87,651Business and financial operations occupations
76,874Transportation occupations
66,856Management occupations
49,574Installation, maintenance, and repair occupations
46,493Construction and extraction occupations
Top industries in this zip code by the number of employees in 2005:
Construction: New Single-Family Housing Construction (except Operative Builders) (10-19 employees: 1 establishment, 1-4 employees: 1 establishment)
Construction: Drywall and Insulation Contractors (5-9: 1)
Construction: Electrical Contractors (5-9: 1)
Construction: All Other Specialty Trade Contractors (5-9: 1)
Wholesale Trade: Industrial Machinery and Equipment Merchant Wholesalers (5-9: 1)
Professional, Scientific, and Technical Services: Computer Systems Design Services (1-4: 2)
Other Services (except Public Administration): Religious Organizations (1-4: 1)
Construction: Framing Contractors (1-4: 1)
Home Mortgage Disclosure Act Aggregated Statistics For Year 2009 (Based on 2 partial tracts)
A) FHA, FSA/RHS & VA Home Purchase Loans
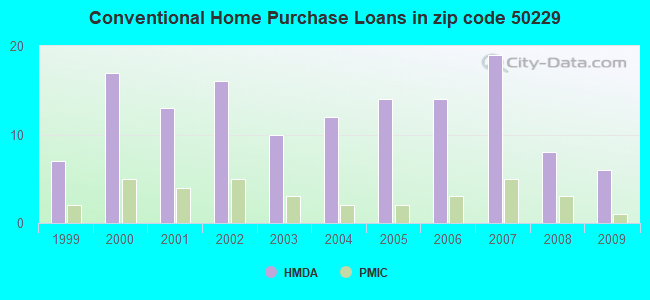
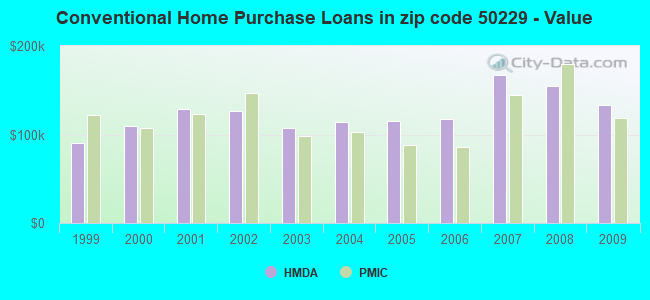
B) Conventional Home Purchase Loans
C) Refinancings
D) Home Improvement Loans
F) Non-occupant Loans on < 5 Family Dwellings (A B C & D)
Number
Average Value
Number
Average Value
Number
Average Value
Number
Average Value
Number
Average Value
LOANS ORIGINATED
5
$154,436
6
$133,270
40
$171,890
3
$84,837
3
$81,223
APPLICATIONS APPROVED, NOT ACCEPTED
0
$0
1
$195,300
5
$136,746
0
$0
0
$0
APPLICATIONS DENIED
1
$123,100
0
$0
10
$167,107
1
$38,270
0
$0
APPLICATIONS WITHDRAWN
0
$0
1
$129,960
6
$160,825
0
$0
0
$0
FILES CLOSED FOR INCOMPLETENESS
0
$0
0
$0
2
$142,235
0
$0
0
$0
Aggregated Statistics For Year 2008 (Based on 2 partial tracts)
A) FHA, FSA/RHS & VA Home Purchase Loans
B) Conventional Home Purchase Loans
C) Refinancings
D) Home Improvement Loans
F) Non-occupant Loans on < 5 Family Dwellings (A B C & D)
G) Loans On Manufactured Home Dwelling (A B C & D)
Number
Average Value
Number
Average Value
Number
Average Value
Number
Average Value
Number
Average Value
Number
Average Value
LOANS ORIGINATED
2
$136,640
8
$154,328
23
$138,420
5
$46,496
4
$72,110
1
$70,760
APPLICATIONS APPROVED, NOT ACCEPTED
0
$0
1
$118,410
3
$256,190
1
$27,800
0
$0
0
$0
APPLICATIONS DENIED
1
$33,930
1
$182,310
13
$140,429
4
$64,530
0
$0
1
$178,690
APPLICATIONS WITHDRAWN
0
$0
3
$195,180
5
$158,768
0
$0
0
$0
0
$0
FILES CLOSED FOR INCOMPLETENESS
0
$0
1
$93,500
3
$165,820
0
$0
0
$0
0
$0
Aggregated Statistics For Year 2007 (Based on 2 partial tracts)
A) FHA, FSA/RHS & VA Home Purchase Loans
B) Conventional Home Purchase Loans
C) Refinancings
D) Home Improvement Loans
F) Non-occupant Loans on < 5 Family Dwellings (A B C & D)
G) Loans On Manufactured Home Dwelling (A B C & D)
Number
Average Value
Number
Average Value
Number
Average Value
Number
Average Value
Number
Average Value
Number
Average Value
LOANS ORIGINATED
1
$109,740
19
$167,295
25
$135,837
6
$61,068
3
$119,730
2
$84,115
APPLICATIONS APPROVED, NOT ACCEPTED
0
$0
2
$403,415
8
$128,651
1
$20,220
0
$0
0
$0
APPLICATIONS DENIED
0
$0
3
$99,637
14
$204,120
2
$29,965
0
$0
0
$0
APPLICATIONS WITHDRAWN
0
$0
2
$118,410
5
$159,634
1
$129,600
0
$0
0
$0
FILES CLOSED FOR INCOMPLETENESS
0
$0
1
$148,370
3
$164,617
0
$0
0
$0
0
$0
Aggregated Statistics For Year 2006 (Based on 2 partial tracts)
B) Conventional Home Purchase Loans
C) Refinancings
D) Home Improvement Loans
E) Loans on Dwellings For 5+ Families
F) Non-occupant Loans on < 5 Family Dwellings (A B C & D)
G) Loans On Manufactured Home Dwelling (A B C & D)
Number
Average Value
Number
Average Value
Number
Average Value
Number
Average Value
Number
Average Value
Number
Average Value
LOANS ORIGINATED
14
$117,738
29
$110,802
6
$31,588
1
$2,890
3
$102,283
2
$63,715
APPLICATIONS APPROVED, NOT ACCEPTED
4
$120,755
6
$142,233
0
$0
0
$0
0
$0
0
$0
APPLICATIONS DENIED
3
$93,137
16
$143,520
2
$43,140
0
$0
1
$127,070
1
$82,310
APPLICATIONS WITHDRAWN
3
$89,647
7
$116,861
1
$36,100
0
$0
0
$0
0
$0
FILES CLOSED FOR INCOMPLETENESS
1
$54,150
4
$106,855
0
$0
0
$0
0
$0
0
$0
Aggregated Statistics For Year 2005 (Based on 2 partial tracts)
A) FHA, FSA/RHS & VA Home Purchase Loans
B) Conventional Home Purchase Loans
C) Refinancings
D) Home Improvement Loans
E) Loans on Dwellings For 5+ Families
F) Non-occupant Loans on < 5 Family Dwellings (A B C & D)
G) Loans On Manufactured Home Dwelling (A B C & D)
Number
Average Value
Number
Average Value
Number
Average Value
Number
Average Value
Number
Average Value
Number
Average Value
Number
Average Value
LOANS ORIGINATED
1
$91,690
14
$114,979
33
$115,181
7
$26,199
1
$37,540
4
$69,582
0
$0
APPLICATIONS APPROVED, NOT ACCEPTED
0
$0
2
$126,890
9
$117,686
0
$0
0
$0
0
$0
0
$0
APPLICATIONS DENIED
0
$0
3
$126,830
24
$122,063
2
$37,725
0
$0
1
$43,680
1
$56,680
APPLICATIONS WITHDRAWN
0
$0
1
$150,540
9
$131,363
0
$0
0
$0
0
$0
1
$155,950
FILES CLOSED FOR INCOMPLETENESS
0
$0
1
$228,870
6
$145,723
0
$0
0
$0
0
$0
0
$0
Aggregated Statistics For Year 2004 (Based on 2 partial tracts)
A) FHA, FSA/RHS & VA Home Purchase Loans
B) Conventional Home Purchase Loans
C) Refinancings
D) Home Improvement Loans
F) Non-occupant Loans on < 5 Family Dwellings (A B C & D)
G) Loans On Manufactured Home Dwelling (A B C & D)
Number
Average Value
Number
Average Value
Number
Average Value
Number
Average Value
Number
Average Value
Number
Average Value
LOANS ORIGINATED
1
$94,580
12
$114,618
32
$100,933
5
$42,742
3
$94,460
1
$65,340
APPLICATIONS APPROVED, NOT ACCEPTED
0
$0
3
$79,660
4
$74,185
0
$0
0
$0
0
$0
APPLICATIONS DENIED
0
$0
4
$80,322
15
$99,083
3
$29,120
0
$0
1
$25,270
APPLICATIONS WITHDRAWN
0
$0
4
$64,257
9
$111,870
0
$0
1
$121,660
0
$0
FILES CLOSED FOR INCOMPLETENESS
0
$0
1
$103,970
3
$109,383
0
$0
0
$0
0
$0
Aggregated Statistics For Year 2003 (Based on 2 partial tracts)
A) FHA, FSA/RHS & VA Home Purchase Loans
B) Conventional Home Purchase Loans
C) Refinancings
D) Home Improvement Loans
E) Loans on Dwellings For 5+ Families
F) Non-occupant Loans on < 5 Family Dwellings (A B C & D)
Number
Average Value
Number
Average Value
Number
Average Value
Number
Average Value
Number
Average Value
Number
Average Value
LOANS ORIGINATED
1
$104,330
10
$107,289
57
$110,928
8
$21,886
0
$0
2
$78,335
APPLICATIONS APPROVED, NOT ACCEPTED
0
$0
3
$73,883
6
$112,873
1
$32,490
0
$0
0
$0
APPLICATIONS DENIED
0
$0
3
$69,070
25
$119,664
4
$26,082
1
$122,740
1
$48,010
APPLICATIONS WITHDRAWN
0
$0
3
$60,167
10
$115,484
0
$0
0
$0
0
$0
FILES CLOSED FOR INCOMPLETENESS
0
$0
1
$133,930
5
$102,740
0
$0
0
$0
0
$0
Aggregated Statistics For Year 2002 (Based on 2 partial tracts)
A) FHA, FSA/RHS & VA Home Purchase Loans
B) Conventional Home Purchase Loans
C) Refinancings
D) Home Improvement Loans
F) Non-occupant Loans on < 5 Family Dwellings (A B C & D)
Number
Average Value
Number
Average Value
Number
Average Value
Number
Average Value
Number
Average Value
LOANS ORIGINATED
3
$90,853
16
$126,440
53
$112,230
5
$28,086
2
$78,155
APPLICATIONS APPROVED, NOT ACCEPTED
0
$0
3
$92,177
11
$92,875
1
$12,270
0
$0
APPLICATIONS DENIED
0
$0
4
$95,212
13
$122,046
1
$20,220
0
$0
APPLICATIONS WITHDRAWN
0
$0
2
$127,975
10
$95,304
0
$0
0
$0
FILES CLOSED FOR INCOMPLETENESS
0
$0
1
$140,430
4
$157,758
0
$0
0
$0
Aggregated Statistics For Year 2001 (Based on 2 partial tracts)
A) FHA, FSA/RHS & VA Home Purchase Loans
B) Conventional Home Purchase Loans
C) Refinancings
D) Home Improvement Loans
F) Non-occupant Loans on < 5 Family Dwellings (A B C & D)
Number
Average Value
Number
Average Value
Number
Average Value
Number
Average Value
Number
Average Value
LOANS ORIGINATED
3
$93,257
13
$128,572
40
$96,378
4
$24,458
1
$34,660
APPLICATIONS APPROVED, NOT ACCEPTED
0
$0
2
$122,380
6
$100,298
0
$0
0
$0
APPLICATIONS DENIED
1
$103,250
4
$96,748
17
$92,395
3
$14,920
0
$0
APPLICATIONS WITHDRAWN
0
$0
1
$96,750
8
$69,899
0
$0
0
$0
FILES CLOSED FOR INCOMPLETENESS
0
$0
0
$0
1
$244,400
0
$0
0
$0
Aggregated Statistics For Year 2000 (Based on 2 partial tracts)
A) FHA, FSA/RHS & VA Home Purchase Loans
B) Conventional Home Purchase Loans
C) Refinancings
D) Home Improvement Loans
F) Non-occupant Loans on < 5 Family Dwellings (A B C & D)
Number
Average Value
Number
Average Value
Number
Average Value
Number
Average Value
Number
Average Value
LOANS ORIGINATED
2
$78,155
17
$109,234
20
$72,128
8
$19,945
1
$176,530
APPLICATIONS APPROVED, NOT ACCEPTED
0
$0
2
$78,880
5
$64,836
1
$13,720
0
$0
APPLICATIONS DENIED
0
$0
6
$62,393
10
$69,131
4
$27,075
1
$52,710
APPLICATIONS WITHDRAWN
0
$0
2
$71,480
2
$118,225
1
$25,270
0
$0
FILES CLOSED FOR INCOMPLETENESS
0
$0
0
$0
3
$133,570
0
$0
0
$0
Aggregated Statistics For Year 1999 (Based on 1 partial tract)
A) FHA, FSA/RHS & VA Home Purchase Loans
B) Conventional Home Purchase Loans
C) Refinancings
D) Home Improvement Loans
F) Non-occupant Loans on < 5 Family Dwellings (A B C & D)

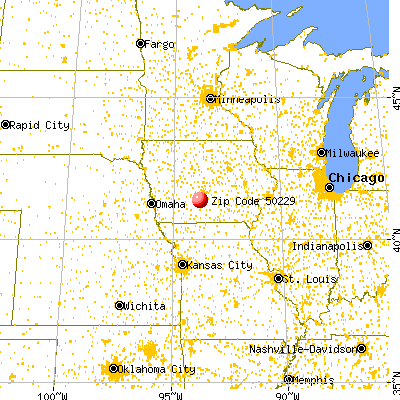


 Nearest zip codes: 50033, 50160, 50240, 50211, 50061, 50218.