Estimated zip code population in 2022: 694 Zip code population in 2010: 774 Zip code population in 2000: 857
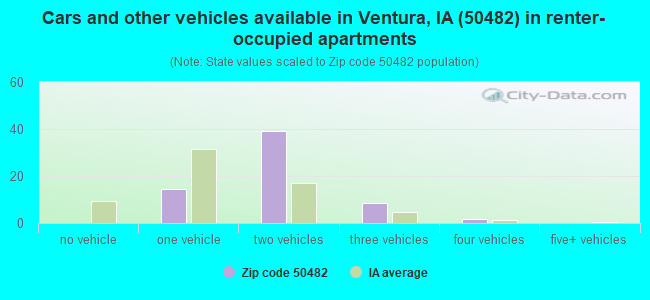
Houses and condos: 458 Renter-occupied apartments: 64
% of renters here:
21%
State:
28%
March 2022 cost of living index in zip code 50482: 78.8 (low, U.S. average is 100)
Land area: 28.8 sq. mi. Water area: 2.6 sq. mi.
Population density: 24 people per square mile
(very low).
OSM Map
General Map
Google Map
MSN Map
OSM Map
General Map
Google Map
MSN Map
OSM Map
General Map
Google Map
MSN Map
OSM Map
General Map
Google Map
MSN Map
Please wait while loading the map...
Real estate property taxes paid for housing units in 2022:
This zip code:
1.2% ($2,809)
Iowa:
1.4% ($2,724)
Median real estate property taxes paid for housing units with mortgages in 2022: $2,805 (1.1%) Median real estate property taxes paid for housing units with no mortgage in 2022: $2,831 (1.3%)
Business Search- 14 Million verified businesses
Males: 356
(51.3%)
Females: 338
(48.7%)
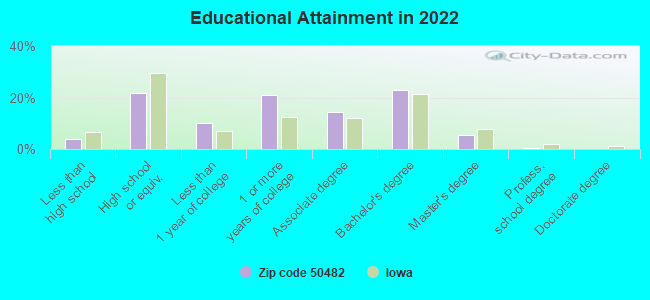
For population 25 years and over in 50482:
High school or higher: 96.8%
Bachelor's degree or higher: 29.0%
Graduate or professional degree: 6.0%
Unemployed: 0.7%
Mean travel time to work (commute): 19.8 minutes
For population 15 years and over in 50482:
Never married: 15.5%
Now married: 71.7%
Separated: 0.2%
Widowed: 5.3%
Divorced: 7.3%
Zip code 50482 compared to state average:
Unemployed percentage significantly below state average.
Black race population percentage significantly below state average.
Hispanic race population percentage below state average.
Median age significantly above state average.
Foreign-born population percentage significantly below state average.
Length of stay since moving in significantly above state average.
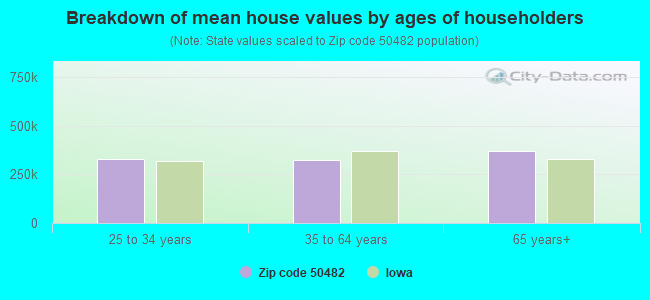
Estimated median house/condo value in 2022: $230,498
50482:
$230,498
Iowa:
$194,600
Median resident age:
This zip code:
53.9 years
Iowa median age:
38.9 years
Average household size:
This zip code:
2.2 people
Iowa:
2.3 people
Averages for the 2020 tax year for zip code 50482, filed in 2021:
Average Adjusted Gross Income (AGI) in 2020: $77,002 (Individual Income Tax Returns)
Here:
$77,002
State:
$71,087
Salary/wage: $64,382 (reported on 81.0% of returns)
Here:
$64,382
State:
$57,361
(% of AGI for various income ranges: 1318.0% for AGIs below $25k, 3735.0% for AGIs $25k-50k, 6792.0% for AGIs $50k-75k, 10283.3% for AGIs $75k-100k, 25018.0% for AGIs $100k-200k)
Taxable interest for individuals: $1,186 (reported on 50.0% of returns)
This zip code:
$1,186
Iowa:
$1,633
(% of AGI for various income ranges: 12.0% for AGIs below $25k, 55.0% for AGIs $25k-50k, 70.0% for AGIs $50k-75k, 20.0% for AGIs $75k-100k, 338.0% for AGIs $100k-200k)
Ordinary dividends: $1,862 (reported on 31.0% of returns)
Here:
$1,862
State:
$5,432
(% of AGI for various income ranges: 86.7% for AGIs $25k-50k, 178.0% for AGIs $50k-75k, 202.0% for AGIs $100k-200k)
Net capital gain/loss in AGI: +$5,755 (reported on 26.2% of returns)
Here:
+$5,755
State:
+$15,243
(% of AGI for various income ranges: 88.0% for AGIs below $25k, 104.0% for AGIs $50k-75k, 1074.0% for AGIs $100k-200k)
Profit/loss from business: +$3,288 (reported on 19.0% of returns)
Here:
+$3,288
State:
+$11,763
(% of AGI for various income ranges: 186.0% for AGIs below $25k, 86.0% for AGIs $50k-75k, 254.0% for AGIs $100k-200k)
Taxable individual retirement arrangement distribution: $16,600 (reported on 16.7% of returns)
50482:
$16,600
Iowa:
$17,324
(% of AGI for various income ranges: 396.0% for AGIs below $25k, 676.0% for AGIs $50k-75k, 1252.0% for AGIs $100k-200k)
Total itemized deductions: $24,667 (reported on 7.1% of returns)
Here:
$24,667
State:
$33,775
(% of AGI for various income ranges: 2466.7% for AGIs $75k-100k)
Charity contributions: $5,800 (reported on 4.8% of returns)
Here:
$5,800
State:
$13,075
(% of AGI for various income ranges: 232.0% for AGIs $50k-75k)
Taxes paid: $7,067 (reported on 7.1% of returns)
50482:
$7,067
State:
$7,704
(% of AGI for various income ranges: 706.7% for AGIs $75k-100k)
Earned income credit: $1,200 (reported on 7.1% of returns)
Here:
$1,200
State:
$2,195
(% of AGI for various income ranges: 72.0% for AGIs below $25k)
Percentage of individuals using paid preparers for their 2020 taxes: 92.9%
Here:
93%
State:
95%
(% for various income ranges: 88.9% for AGIs below $25k, 100.0% for AGIs $25k-50k, 87.5% for AGIs $50k-75k, 100.0% for AGIs $75k-100k, 90.0% for AGIs $100k-200k, 100.0% for AGIs over 200k)
Averages for the 2012 tax year for zip code 50482, filed in 2013:
Average Adjusted Gross Income (AGI) in 2012: $56,698 (Individual Income Tax Returns)
Here:
$56,698
State:
$58,860
Salary/wage: $44,176 (reported on 80.4% of returns)
Here:
$44,176
State:
$46,659
(% of AGI for various income ranges: 67.8% for AGIs below $25k, 64.6% for AGIs $25k-50k, 79.0% for AGIs $50k-75k, 79.0% for AGIs $75k-100k, 48.0% for AGIs $100k-200k)
Taxable interest for individuals: $1,023 (reported on 47.8% of returns)
This zip code:
$1,023
Iowa:
$1,537
(% of AGI for various income ranges: 2.3% for AGIs below $25k, 2.5% for AGIs $25k-50k, 0.5% for AGIs $50k-75k, 0.3% for AGIs $75k-100k, 0.5% for AGIs $100k-200k)
Ordinary dividends: $1,733 (reported on 32.6% of returns)
Here:
$1,733
State:
$4,542
(% of AGI for various income ranges: 1.8% for AGIs below $25k, 1.8% for AGIs $25k-50k, 0.9% for AGIs $75k-100k, 1.1% for AGIs $100k-200k)
Net capital gain/loss in AGI: +$9,609 (reported on 23.9% of returns)
Here:
+$9,609
State:
+$11,802
(% of AGI for various income ranges: 0.7% for AGIs $50k-75k, 9.0% for AGIs $100k-200k)
Profit/loss from business: +$7,150 (reported on 13.0% of returns)
Here:
+$7,150
State:
+$10,509
Taxable individual retirement arrangement distribution: $13,900 (reported on 8.7% of returns)
50482:
$13,900
Iowa:
$11,773
Total itemized deductions: $20,288 (22% of AGI, reported on 34.8% of returns)
Here:
$20,288
State:
$21,278
Here:
21.5% of AGI
State:
18.9% of AGI
(% of AGI for various income ranges: 21.3% for AGIs $25k-50k, 12.1% for AGIs $50k-75k, 12.1% for AGIs $75k-100k, 11.8% for AGIs $100k-200k)
Charity contributions: $2,900 (reported on 32.6% of returns)
Here:
$2,900
State:
$4,044
(% of AGI for various income ranges: 2.8% for AGIs $25k-50k, 1.4% for AGIs $50k-75k, 1.3% for AGIs $75k-100k, 1.8% for AGIs $100k-200k)
Taxes paid: $7,575 (reported on 34.8% of returns)
50482:
$7,575
State:
$8,846
(% of AGI for various income ranges: 5.5% for AGIs $25k-50k, 3.3% for AGIs $50k-75k, 4.7% for AGIs $75k-100k, 5.7% for AGIs $100k-200k)
Earned income credit: $2,040 (reported on 10.9% of returns)
Here:
$2,040
State:
$2,098
(% of AGI for various income ranges: 3.4% for AGIs below $25k, 1.1% for AGIs $25k-50k)
Percentage of individuals using paid preparers for their 2012 taxes: 71.7%
Here:
72%
State:
65%
(% for various income ranges: 62.5% for AGIs below $25k, 70.0% for AGIs $25k-50k, 75.0% for AGIs $50k-75k, 80.0% for AGIs $75k-100k, 85.7% for AGIs $100k-200k)
Averages for the 2004 tax year for zip code 50482, filed in 2005:
Average Adjusted Gross Income (AGI) in 2004: $41,300 (Individual Income Tax Returns)
Here:
$41,300
State:
$43,875
Salary/wage: $37,882 (reported on 81.3% of returns)
Here:
$37,882
State:
$38,265
(% of AGI for various income ranges: 102.8% for AGIs below $10k, 64.3% for AGIs $10k-25k, 74.7% for AGIs $25k-50k, 82.4% for AGIs $50k-75k, 76.7% for AGIs $75k-100k, 65.8% for AGIs over 100k)
Taxable interest for individuals: $1,777 (reported on 55.2% of returns)
This zip code:
$1,777
Iowa:
$1,768
(% of AGI for various income ranges: 9.3% for AGIs below $10k, 7.1% for AGIs $10k-25k, 3.1% for AGIs $25k-50k, 1.1% for AGIs $50k-75k, 1.7% for AGIs $75k-100k, 0.9% for AGIs over 100k)
Taxable dividends: $766 (reported on 34.7% of returns)
Here:
$766
State:
$2,510
(% of AGI for various income ranges: 0.9% for AGIs below $10k, 0.9% for AGIs $10k-25k, 0.9% for AGIs $25k-50k, 0.5% for AGIs $50k-75k, 0.7% for AGIs $75k-100k, 0.4% for AGIs over 100k)
Profit/loss from business: +$1,411 (reported on 13.8% of returns)
Here:
+$1,411
State:
+$8,574
Profit/loss from farming: +$2,406 (reported on 7.9% of returns)
Here:
+$2,406
State:
-$74
IRA payment deduction: $3,000 (reported on 3.7% of returns)
50482:
$3,000
Iowa:
$2,970
Total itemized deductions: $15,172 (22% of AGI, reported on 31.5% of returns)
Here:
$15,172
State:
$16,976
Here:
21.8% of AGI
State:
20.8% of AGI
(% of AGI for various income ranges: 10.3% for AGIs $10k-25k, 11.1% for AGIs $25k-50k, 11.7% for AGIs $50k-75k, 11.9% for AGIs $75k-100k, 13.3% for AGIs over 100k)
Charity contributions deductions: $2,239 (3% of AGI, reported on 27.8% of returns)
Here:
$2,239
State:
$3,089
Here:
3.3% of AGI
State:
3.6% of AGI
(% of AGI for various income ranges: 0.8% for AGIs $10k-25k, 1.9% for AGIs $25k-50k, 1.4% for AGIs $50k-75k, 1.5% for AGIs $75k-100k, 1.6% for AGIs over 100k)
Total tax: $5,235 (reported on 79.6% of returns)
50482:
$5,235
State:
$6,177
(% of AGI for various income ranges: 2.8% for AGIs below $10k, 4.9% for AGIs $10k-25k, 6.5% for AGIs $25k-50k, 8.6% for AGIs $50k-75k, 10.5% for AGIs $75k-100k, 18.5% for AGIs over 100k)
Earned income credit: $1,450 (reported on 9.9% of returns)
Here:
$1,450
State:
$1,540
Percentage of individuals using paid preparers for their 2004 taxes: 79.3%
Here:
79%
State:
70%
(% for various income ranges: 69.6% for AGIs below $10k, 76.6% for AGIs $10k-25k, 82.5% for AGIs $25k-50k, 82.9% for AGIs $50k-75k, 83.3% for AGIs $75k-100k, 87.0% for AGIs over 100k)
Likely homosexual households (counted as self-reported same-sex unmarried-partner households)
Lesbian couples: 0.5% of all households
Gay men: 0.0% of all households
Household received Food Stamps/SNAP in the past 12 months: 7 Household did not receive Food Stamps/SNAP in the past 12 months: 310
Women who had a birth in the past 12 months: 13 (10 now married, 2 unmarried) Women who did not have a birth in the past 12 months: 99 (63 now married, 36 unmarried)
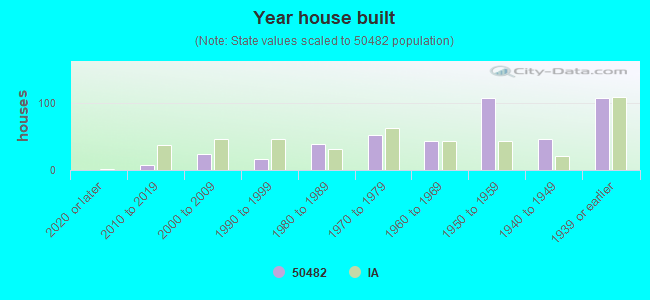
Housing units in zip code 50482 with a mortgage: 118 (19 second mortgage, 14 both second mortgage and home equity loan) Houses without a mortgage: 5
Median monthly owner costs for units with a mortgage: $1,393 Median monthly owner costs for units without a mortgage: $633
Residents with income below the poverty level in 2022:
This zip code:
5.2%
Whole state:
11.0%
Residents with income below 50% of the poverty level in 2022:
This zip code:
4.0%
Whole state:
5.5%
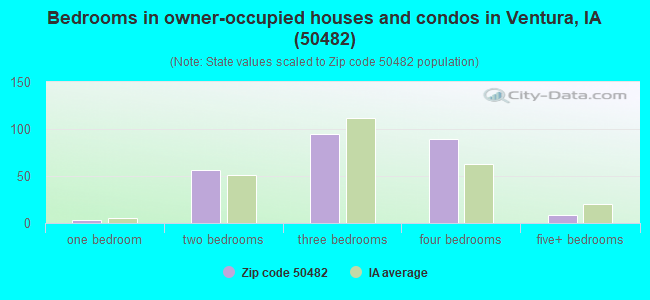
Median number of rooms in houses and condos:
Here:
6.7
State:
6.8
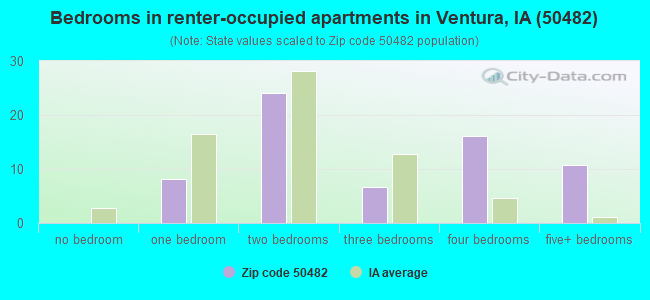
Median number of rooms in apartments:
Here:
5.1
State:
4.2
Notable locations in this zip code not listed on our city pages
Notable locations in zip code 50482: Cerro Gordo Wind Farm (A), Ventura (B), Ventura Fire Department (C), Ventura Public Library (D), Ventura Police Department (E). Display/hide their locations on the map
Size of family households: 166 2-persons, 33 3-persons, 17 4-persons, 13 6-persons, 2 7-or-more-persons
Size of nonfamily households: 75 1-person, 7 2-persons, 1 4-persons
53 married couples with children.
45 single-parent households (45 women).
96.7% of residents of 50482 zip code speak English at home.
2.4% of residents speak Spanish at home (38% very well, 62% not well).
0.8% of residents speak other Indo-European language at home (100% very well).
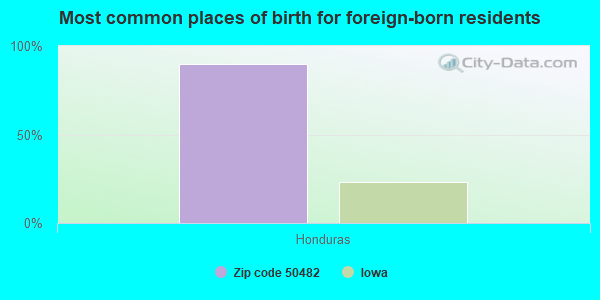
Foreign born population: 10 (1.5%) (0.0% of them are naturalized citizens)
:
1.5%
Whole state:
6.0%
90%Honduras
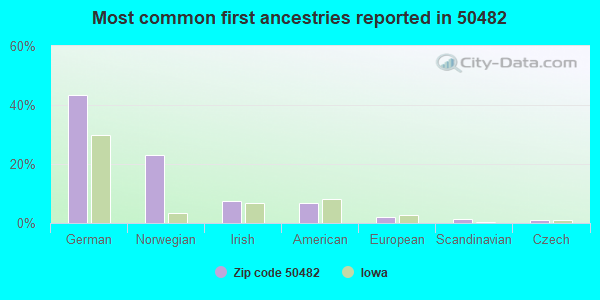
43%German
23%Norwegian
8%Irish
7%American
2%European
1%Scandinavian
1%Czech
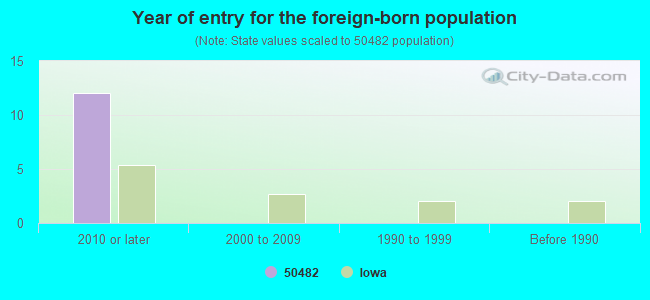
Year of entry for the foreign-born population
122010 or later
02000 to 2009
01990 to 1999
0Before 1990
Facilities with environmental interests located in this zip code:
VENTURA ELEMENTARY SCHOOL (300 S. MAIN STREET in VENTURA, IA)
(Geographic Names Information System) (National Center for Education Statistics) - STATE ID-176633 409 Organizations: VENTURA COMM SCHOOL DISTRICT (SCHOOL DISTRICT)
VENTURA JR-SR HIGH SCHOOL (110 S. MAIN STREET in VENTURA, IA)
(National Center for Education Statistics) - STATE ID-176633 172 Organizations: VENTURA COMM SCHOOL DISTRICT (SCHOOL DISTRICT)
FIVE STAR COOP - VENTURA (111 NORTH WEIMER STREET in VENTURA, IA)
AIR MINOR (AIRS/AFS) COMPLIANCE ACTIVITY (Tracking inspections of insecticide, fungicide, and rodenticide, and toxic substances) Business SIC classification: GRAIN AND FIELD BEANS Alternative names: FARMERS COOPERATIVE COMPANY, FARMERS COOP CO-VENTURA, TOP OF IOWA, TOP OF IOWA COOP
VENTURA COMMUNITY SCHOOL DISTRICT (110 SOUTH MAIN STREET in VENTURA, IA)
COMPLIANCE ACTIVITY (Tracking inspections of insecticide, fungicide, and rodenticide, and toxic substances) Alternative names: VENTURA C.S.D., VENTURA CSD
VENTURA MART (1 N WEIMER in VENTURA, IA)
(Resource Conservation and Recovery Act (tracking hazardous waste)) Business NAICS classification: ALL OTHER SPECIALTY FOOD STORES.; LIQUEFIED PETROLEUM GAS (BOTTLED GAS) DEALERS.
Housing units lacking complete plumbing facilities: 0.9% Housing units lacking complete kitchen facilities: 0.9%
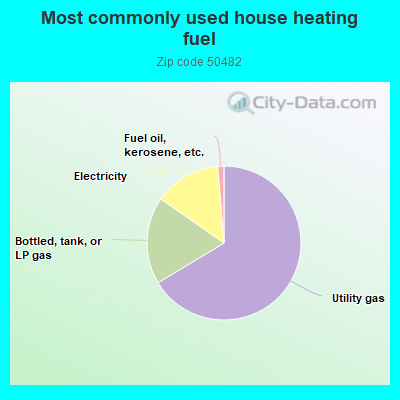
66.7%Utility gas
18.4%Bottled, tank, or LP gas
14.1%Electricity
1.3%Fuel oil, kerosene, etc.
Population in 1990: 816. Population change in the 1990s: +41 (+5.0%).
Place of birth for U.S.-born residents:
This state: 610
Northeast: 9
Midwest: 45
South: 14
West: 5
68% of the 50482 zip code residents lived in the same house 5 years ago. Out of people who lived in different houses, 48% lived in this county. Out of people who lived in different counties, 50% lived in Iowa.
96% of the 50482 zip code residents lived in the same house 1 year ago. Out of people who lived in different houses, 83% moved from this county. Out of people who lived in different houses, 17% moved from different county within same state.
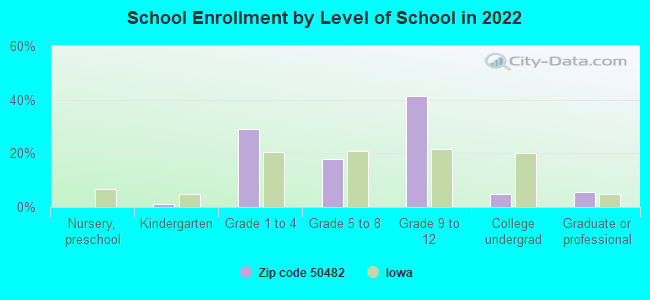
Private vs. public school enrollment:
Students in private schools in grades 1 to 8 (elementary and middle school): 15
Here:
29.3%
Iowa:
10.6%
Students in private schools in grades 9 to 12 (high school):
Here:
0.0%
Iowa:
7.9%
Students in private undergraduate colleges:
Here:
0.0%
Iowa:
23.9%
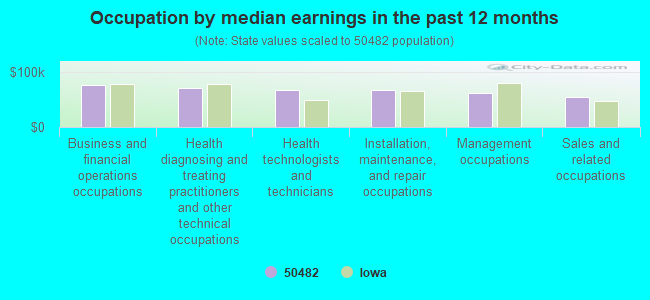
Occupation by median earnings in the past 12 months ($)
77,125Business and financial operations occupations
71,859Health diagnosing and treating practitioners and other technical occupations
66,887Health technologists and technicians
66,607Installation, maintenance, and repair occupations
61,127Management occupations
54,698Sales and related occupations
Top industries in this zip code by the number of employees in 2005:


+$2,406
-$74
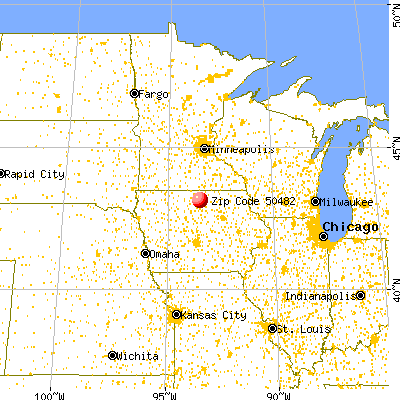
 Nearest zip codes: 50428, 50438, 50449, 50434, 50479, 50457.