Estimated zip code population in 2022: 773 Zip code population in 2010: 1,047 Zip code population in 2000: 1,112
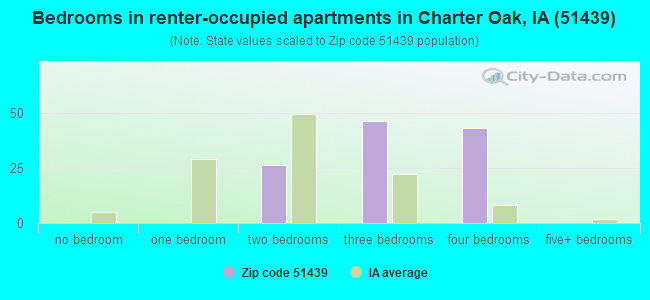
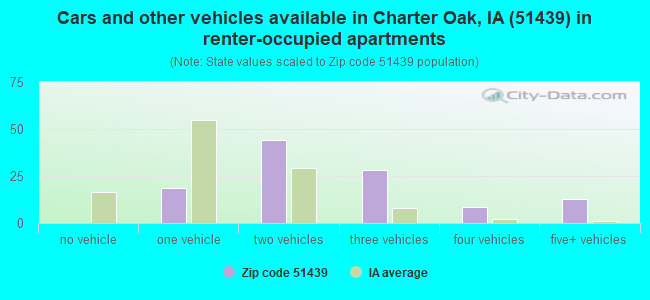
Houses and condos: 439 Renter-occupied apartments: 115
% of renters here:
32%
State:
28%
March 2022 cost of living index in zip code 51439: 81.5 (low, U.S. average is 100)
Land area: 86.1 sq. mi. Water area: 0.2 sq. mi.
Population density: 9 people per square mile
(very low).
OSM Map
General Map
Google Map
MSN Map
OSM Map
General Map
Google Map
MSN Map
OSM Map
General Map
Google Map
MSN Map
OSM Map
General Map
Google Map
MSN Map
Please wait while loading the map...
Real estate property taxes paid for housing units in 2022:
This zip code:
1.1% ($995)
Iowa:
1.4% ($2,724)
Median real estate property taxes paid for housing units with mortgages in 2022: $1,186 (1.1%) Median real estate property taxes paid for housing units with no mortgage in 2022: $929 (1.1%)
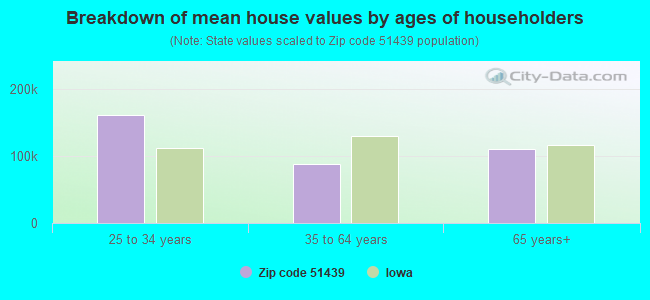
Estimated median house/condo value in 2022: $90,763
51439:
$90,763
Iowa:
$194,600
According to our research of Iowa and other state lists, there was 1 registered sex offender living in 51439 zip code as of April 24, 2024. The ratio of all residents to sex offenders in zip code 51439 is 1,110 to 1. The ratio of registered sex offenders to all residents in this zip code is lower than the state average.
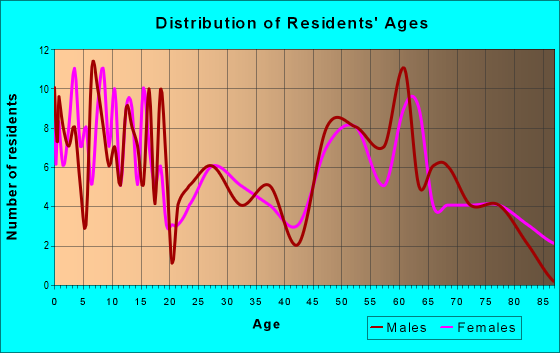
Median resident age:
This zip code:
57.1 years
Iowa median age:
38.9 years
Average household size:
This zip code:
2.1 people
Iowa:
2.3 people
Averages for the 2020 tax year for zip code 51439, filed in 2021:
Average Adjusted Gross Income (AGI) in 2020: $60,067 (Individual Income Tax Returns)
Here:
$60,067
State:
$71,087
Salary/wage: $39,606 (reported on 79.5% of returns)
Here:
$39,606
State:
$57,361
(% of AGI for various income ranges: 1298.8% for AGIs below $25k, 3692.5% for AGIs $25k-50k, 7947.5% for AGIs $50k-75k, 7005.0% for AGIs $75k-100k)
Taxable interest for individuals: $2,300 (reported on 33.3% of returns)
This zip code:
$2,300
Iowa:
$1,633
(% of AGI for various income ranges: 46.2% for AGIs $25k-50k, 170.0% for AGIs $50k-75k)
Ordinary dividends: $3,400 (reported on 17.9% of returns)
Here:
$3,400
State:
$5,432
(% of AGI for various income ranges: 43.8% for AGIs below $25k, 75.0% for AGIs $50k-75k)
Net capital gain/loss in AGI: +$7,414 (reported on 17.9% of returns)
Here:
+$7,414
State:
+$15,243
(% of AGI for various income ranges: 335.0% for AGIs $50k-75k)
Profit/loss from business: +$6,360 (reported on 12.8% of returns)
Here:
+$6,360
State:
+$11,763
(% of AGI for various income ranges: 795.0% for AGIs $50k-75k)
Taxable individual retirement arrangement distribution: $3,925 (reported on 10.3% of returns)
51439:
$3,925
Iowa:
$17,324
(% of AGI for various income ranges: 392.5% for AGIs $75k-100k)
Earned income credit: $2,940 (reported on 12.8% of returns)
Here:
$2,940
State:
$2,195
(% of AGI for various income ranges: 107.5% for AGIs below $25k, 76.2% for AGIs $25k-50k)
Percentage of individuals using paid preparers for their 2020 taxes: 94.9%
Here:
95%
State:
95%
(% for various income ranges: 90.9% for AGIs below $25k, 90.9% for AGIs $25k-50k, 100.0% for AGIs $50k-75k, 100.0% for AGIs $75k-100k, 100.0% for AGIs $100k-200k)
Averages for the 2012 tax year for zip code 51439, filed in 2013:
Average Adjusted Gross Income (AGI) in 2012: $56,361 (Individual Income Tax Returns)
Here:
$56,361
State:
$58,860
Salary/wage: $29,920 (reported on 85.4% of returns)
Here:
$29,920
State:
$46,659
(% of AGI for various income ranges: 72.9% for AGIs below $25k, 79.9% for AGIs $25k-50k, 64.1% for AGIs $50k-75k, 49.6% for AGIs $75k-100k, 16.2% for AGIs $100k-200k)
Taxable interest for individuals: $2,118 (reported on 41.5% of returns)
This zip code:
$2,118
Iowa:
$1,537
(% of AGI for various income ranges: 1.4% for AGIs below $25k, 0.5% for AGIs $25k-50k, 0.5% for AGIs $50k-75k, 2.9% for AGIs $75k-100k, 2.0% for AGIs $100k-200k)
Ordinary dividends: $1,430 (reported on 24.4% of returns)
Here:
$1,430
State:
$4,542
(% of AGI for various income ranges: 0.2% for AGIs $25k-50k, 1.3% for AGIs $50k-75k, 0.9% for AGIs $100k-200k)
Net capital gain/loss in AGI: +$8,867 (reported on 22.0% of returns)
Here:
+$8,867
State:
+$11,802
(% of AGI for various income ranges: 0.4% for AGIs $25k-50k, 2.1% for AGIs $50k-75k, 7.1% for AGIs $100k-200k)
Profit/loss from business: +$4,200 (reported on 17.1% of returns)
Here:
+$4,200
State:
+$10,509
Taxable individual retirement arrangement distribution: $3,725 (reported on 9.8% of returns)
51439:
$3,725
Iowa:
$11,773
Total itemized deductions: $20,950 (18% of AGI, reported on 19.5% of returns)
Here:
$20,950
State:
$21,278
Here:
18.5% of AGI
State:
18.9% of AGI
(% of AGI for various income ranges: 12.4% for AGIs $25k-50k, 15.1% for AGIs $50k-75k, 5.6% for AGIs $100k-200k)
Charity contributions: $2,686 (reported on 17.1% of returns)
Here:
$2,686
State:
$4,044
(% of AGI for various income ranges: 1.9% for AGIs below $25k, 1.8% for AGIs $50k-75k, 0.8% for AGIs $100k-200k)
Taxes paid: $6,311 (reported on 22.0% of returns)
51439:
$6,311
State:
$8,846
(% of AGI for various income ranges: 1.7% for AGIs $25k-50k, 4.4% for AGIs $50k-75k, 3.3% for AGIs $100k-200k)
Earned income credit: $2,229 (reported on 17.1% of returns)
Here:
$2,229
State:
$2,098
(% of AGI for various income ranges: 6.2% for AGIs below $25k, 1.0% for AGIs $25k-50k)
Percentage of individuals using paid preparers for their 2012 taxes: 78.0%
Here:
78%
State:
65%
(% for various income ranges: 64.3% for AGIs below $25k, 81.8% for AGIs $25k-50k, 85.7% for AGIs $50k-75k, 75.0% for AGIs $75k-100k, 100.0% for AGIs $100k-200k)
Averages for the 2004 tax year for zip code 51439, filed in 2005:
Average Adjusted Gross Income (AGI) in 2004: $33,859 (Individual Income Tax Returns)
Here:
$33,859
State:
$43,875
Salary/wage: $26,877 (reported on 77.9% of returns)
Here:
$26,877
State:
$38,265
(% of AGI for various income ranges: 106.4% for AGIs below $10k, 62.4% for AGIs $10k-25k, 75.4% for AGIs $25k-50k, 68.1% for AGIs $50k-75k, 54.5% for AGIs $75k-100k, 19.6% for AGIs over 100k)
Taxable interest for individuals: $1,868 (reported on 54.9% of returns)
This zip code:
$1,868
Iowa:
$1,768
(% of AGI for various income ranges: 10.8% for AGIs below $10k, 5.1% for AGIs $10k-25k, 1.9% for AGIs $25k-50k, 4.2% for AGIs $50k-75k, 2.2% for AGIs $75k-100k, 1.0% for AGIs over 100k)
Taxable dividends: $990 (reported on 23.0% of returns)
Here:
$990
State:
$2,510
(% of AGI for various income ranges: 2.3% for AGIs below $10k, 0.3% for AGIs $10k-25k, 0.3% for AGIs $25k-50k, 1.5% for AGIs $50k-75k, 1.2% for AGIs $75k-100k)
Net capital gain/loss: +$2,473 (reported on 25.8% of returns)
Here:
+$2,473
State:
+$6,139
(% of AGI for various income ranges: 1.5% for AGIs below $10k, 2.9% for AGIs $10k-25k, 0.3% for AGIs $25k-50k, 0.4% for AGIs $50k-75k, 7.9% for AGIs over 100k)
Profit/loss from business: +$3,192 (reported on 18.3% of returns)
Here:
+$3,192
State:
+$8,574
(% of AGI for various income ranges: 9.3% for AGIs below $10k, 7.5% for AGIs $10k-25k, 1.2% for AGIs $25k-50k, -0.1% for AGIs $50k-75k)
IRA payment deduction: $3,474 (reported on 4.5% of returns)
51439:
$3,474
Iowa:
$2,970
Total itemized deductions: $14,239 (30% of AGI, reported on 20.7% of returns)
Here:
$14,239
State:
$16,976
Here:
29.8% of AGI
State:
20.8% of AGI
(% of AGI for various income ranges: 45.5% for AGIs below $10k, 13.8% for AGIs $10k-25k, 6.3% for AGIs $25k-50k, 5.5% for AGIs $50k-75k, 22.7% for AGIs $75k-100k)
Charity contributions deductions: $1,676 (4% of AGI, reported on 17.4% of returns)
Here:
$1,676
State:
$3,089
Here:
4.1% of AGI
State:
3.6% of AGI
(% of AGI for various income ranges: 2.5% for AGIs $10k-25k, 0.5% for AGIs $25k-50k, 0.7% for AGIs $50k-75k, 1.9% for AGIs $75k-100k)
Total tax: $3,549 (reported on 76.1% of returns)
51439:
$3,549
State:
$6,177
(% of AGI for various income ranges: 3.8% for AGIs below $10k, 4.7% for AGIs $10k-25k, 6.5% for AGIs $25k-50k, 8.6% for AGIs $50k-75k, 11.2% for AGIs $75k-100k, 12.1% for AGIs over 100k)
Earned income credit: $1,831 (reported on 13.8% of returns)
Here:
$1,831
State:
$1,540
Percentage of individuals using paid preparers for their 2004 taxes: 83.6%
Here:
84%
State:
70%
(% for various income ranges: 73.5% for AGIs below $10k, 85.0% for AGIs $10k-25k, 86.1% for AGIs $25k-50k, 84.2% for AGIs $50k-75k, 87.5% for AGIs $75k-100k, 100.0% for AGIs over 100k)
Likely homosexual households (counted as self-reported same-sex unmarried-partner households)
Lesbian couples: 0.0% of all households
Gay men: 1.2% of all households
Household received Food Stamps/SNAP in the past 12 months: 36 Household did not receive Food Stamps/SNAP in the past 12 months: 323
Women who had a birth in the past 12 months: 8 (8 now married, 0 unmarried) Women who did not have a birth in the past 12 months: 102 (52 now married, 50 unmarried)
Housing units in zip code 51439 with a mortgage: 79 (2 second mortgage, 2 both second mortgage and home equity loan) Median monthly owner costs for units with a mortgage: $928 Median monthly owner costs for units without a mortgage: $379
Residents with income below the poverty level in 2022:
This zip code:
15.8%
Whole state:
11.0%
Residents with income below 50% of the poverty level in 2022:
This zip code:
8.5%
Whole state:
5.5%
Median number of rooms in houses and condos:
Here:
6.9
State:
6.8
Median number of rooms in apartments:
Here:
6.8
State:
4.2
Notable locations in this zip code not listed on our city pages
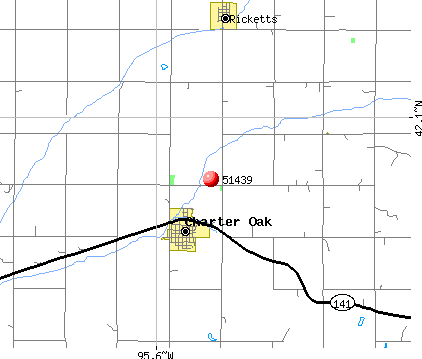
Notable locations in zip code 51439: Ricketts Volunteer Fire Department (A), Charter Oak Fire Department (B), Ricketts City Hall (C), Charter Oak Public Library (D). Display/hide their locations on the map
Churches in zip code 51439 include: United Methodist Church (A), Saint Johns Lutheran Church (B), Saint Lukes Lutheran Church (C), Immanuel Evangelical Lutheran Church (D), Immanuel Church (E), Saint Paul Church (F). Display/hide their locations on the map
Cemeteries: Saint Boniface Cemetery (1), Saint John Cemetery (2), Saint Paul Cemetery (3), Charter Oak Cemetery (4), Bockelmann Family Cemetery (5). Display/hide their locations on the map
Size of family households: 133 2-persons, 20 3-persons, 19 4-persons, 9 5-persons, 9 6-persons
Size of nonfamily households: 130 1-person, 37 2-persons, 3 3-persons
76 married couples with children.
32 single-parent households (13 men, 19 women).
99.6% of residents of 51439 zip code speak English at home.
0.1% of residents speak Spanish at home (100% very well).
0.8% of residents speak Asian or Pacific Island language at home (100% very well).
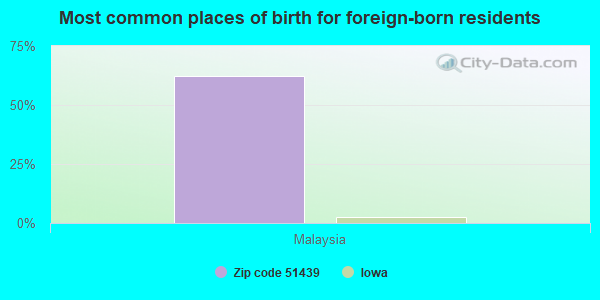
Foreign born population: 8 (1.1%) (0.0% of them are naturalized citizens)
:
1.1%
Whole state:
6.0%
62%Malaysia
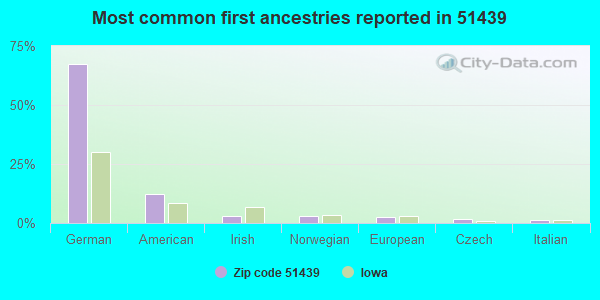
68%German
12%American
3%Irish
3%Norwegian
3%European
2%Czech
1%Italian
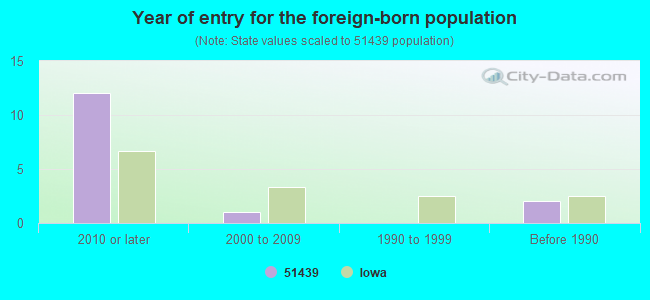
Year of entry for the foreign-born population
122010 or later
12000 to 2009
01990 to 1999
2Before 1990
Facilities with environmental interests located in this zip code:
CHARTER OAK-UTE HIGH SCHOOL (321 MAIN in CHARTER OAK, IA)
(National Center for Education Statistics) - STATE ID-241134 109 Conditionally Exempt Small Quantity Generators, less than 100 kg/month of hazardous waste (Resource Conservation and Recovery Act (tracking hazardous waste)) Organizations: CHARTER OAK-UTE COMMUNITY SCHOOL DIST (CONTACT/OPERATOR)
, CHARTER OAK-UTE COMM SCHOOL DISTRICT (SCHOOL DISTRICT)
CHARTER OAK-UTE JUNIOR HIGH SCHOOL (321 MAIN ST in CHARTER OAK, IA)
(National Center for Education Statistics) - STATE ID-241134 209 Organizations: CHARTER OAK-UTE COMM SCHOOL DISTRICT (SCHOOL DISTRICT)
CHARTER OAK AG SUPPLY (465 RAILROAD STREET in CHARTER OAK, IA)
COMPLIANCE ACTIVITY (Tracking inspections of insecticide, fungicide, and rodenticide, and toxic substances) Alternative names: CHARTER OAK AG SUPPLY CHARTER OAK
CHARTER OAK CITY OF STP (CITY HALL in CHARTER OAK, IA)
National Pollutant Discharge Elimination System NON-MAJOR (Tracking pollutant discharge elimination systems) - permit Business SIC classification: SEWERAGE SYSTEMS
PRIVATE RESIDENCE OF MRS BUSHMANN (662 SPRUCE ST in CHARTER OAK, IA)
(Resource Conservation and Recovery Act (tracking hazardous waste)) Business NAICS classification: OTHER COMMERCIAL AND SERVICE INDUSTRY MACHINERY MANUFACTURING.
BUENZ & SON HARDWARE (94 MAIN ST in CHARTER OAK, IA)
COMPLIANCE ACTIVITY (Tracking inspections of insecticide, fungicide, and rodenticide, and toxic substances)
CHARTER OAK-UTE JR-SR HIGH SCHOOL (321 MAIN ST in CHARTER OAK, IA)
COMPLIANCE ACTIVITY (Tracking inspections of insecticide, fungicide, and rodenticide, and toxic substances)
R & L REPAIR (18 CEDAR ST in CHARTER OAK, IA)
Conditionally Exempt Small Quantity Generators, less than 100 kg/month of hazardous waste (Resource Conservation and Recovery Act (tracking hazardous waste)) Business NAICS classification: GENERAL AUTOMOTIVE REPAIR.
Housing units lacking complete plumbing facilities: 3.1% Housing units lacking complete kitchen facilities: 2.7%
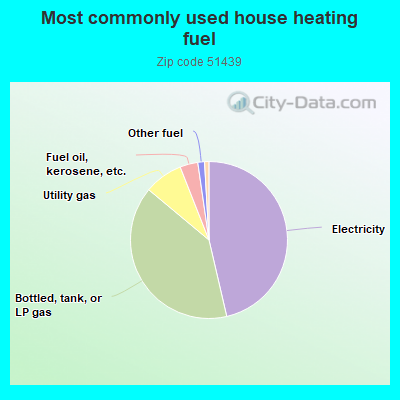
46.6%Electricity
39.9%Bottled, tank, or LP gas
8.0%Utility gas
3.7%Fuel oil, kerosene, etc.
1.4%Other fuel
0.9%Wood
Population in 1990: 797. Population change in the 1990s: +315 (+39.5%).
Place of birth for U.S.-born residents:
This state: 622
Midwest: 69
West: 66
71% of the 51439 zip code residents lived in the same house 5 years ago. Out of people who lived in different houses, 60% lived in this county. Out of people who lived in different counties, 50% lived in Iowa.
96% of the 51439 zip code residents lived in the same house 1 year ago. Out of people who lived in different houses, 43% moved from this county. Out of people who lived in different houses, 65% moved from different county within same state.
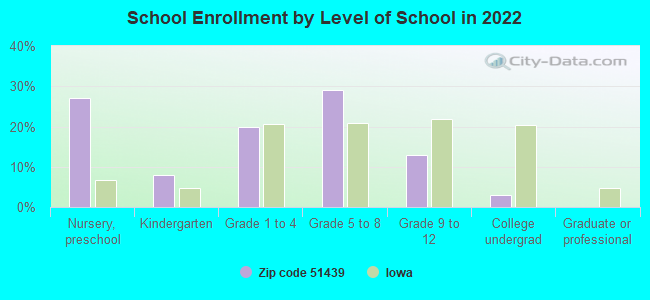
Private vs. public school enrollment:
Students in private schools in grades 1 to 8 (elementary and middle school):
Here:
0.0%
Iowa:
10.6%
Students in private schools in grades 9 to 12 (high school): 2
Here:
15.5%
Iowa:
7.9%
Students in private undergraduate colleges:
Here:
0.0%
Iowa:
23.9%
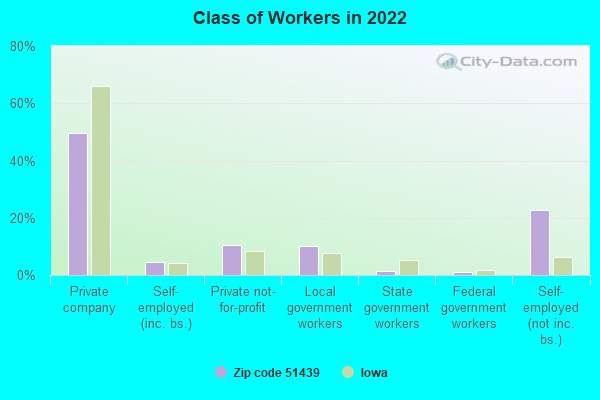
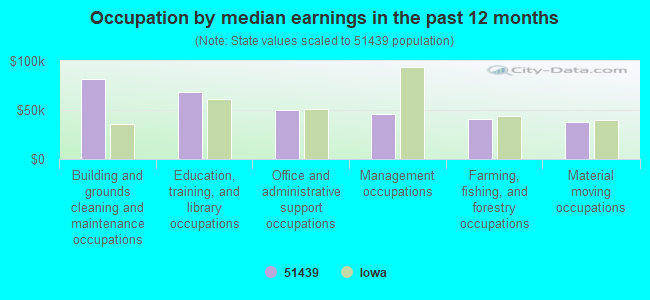
Occupation by median earnings in the past 12 months ($)
81,504Building and grounds cleaning and maintenance occupations
68,356Education, training, and library occupations
50,411Office and administrative support occupations
46,268Management occupations
41,247Farming, fishing, and forestry occupations
37,870Material moving occupations
Top industries in this zip code by the number of employees in 2005:
Accommodation and Food Services: Caterers (10-19: 1)
Educational Services: Elementary and Secondary Schools (5-9: 1)
Other Services (except Public Administration): Religious Organizations (5-9: 1)
Other Services (except Public Administration): Automotive Body, Paint, and Interior Repair and Maintenance (1-4: 1)
Finance and Insurance: Commercial Banking (1-4: 1)
Fatal accident statistics in 2012:
Fatal accident count: 1
Vehicles involved in fatal accidents: 2
Fatal accidents caused by drunken drivers: 0
Fatalities: 1
Persons involved in fatal accidents: 2
Pedestrians involved in fatal accidents: 0
2002 - 2017 National Fire Incident Reporting System (NFIRS) incidents
Based on the data from the years 2002 - 2017 the average number of fire incidents per year is 9. The highest number of fire incidents - 16 took place in 2008, and the least - 1 in 2007. The data has a constant trend.
When looking into fire subcategories, the most incidents belonged to: Outside Fires (46.0%), and Structure Fires (36.0%).
Fire incident types reported to NFIRS in Zip Code 51439
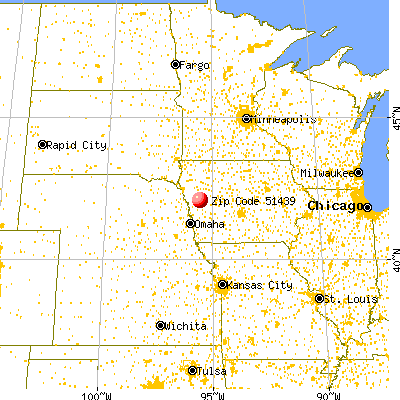


 Nearest zip codes: 51060, 51461, 51520, 51528, 51034, 51572.
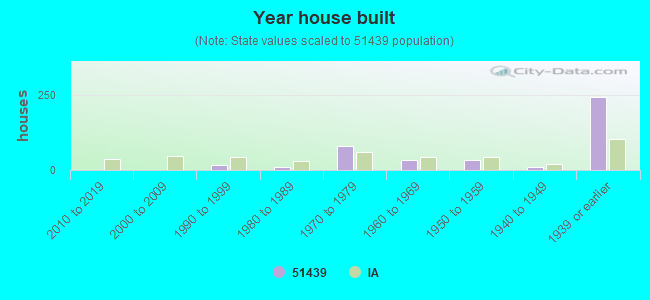


 Based on the data from the years 2002 - 2017 the average number of fire incidents per year is 9. The highest number of fire incidents - 16 took place in 2008, and the least - 1 in 2007. The data has a constant trend.
 When looking into fire subcategories, the most incidents belonged to: Outside Fires (46.0%), and Structure Fires (36.0%).