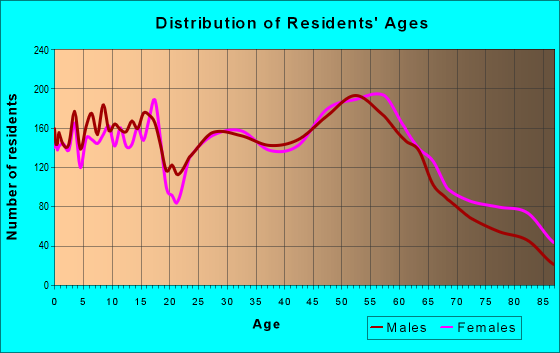
Estimated zip code population in 2022: 24,279 Zip code population in 2010: 23,673 Zip code population in 2000: 24,776
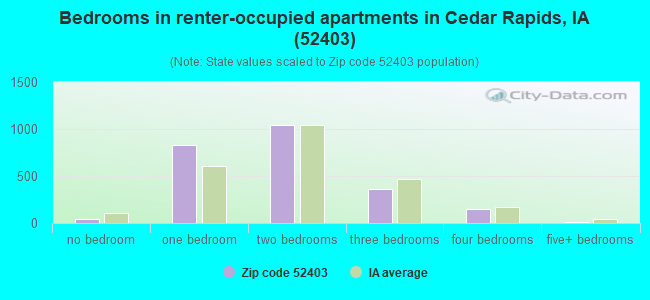
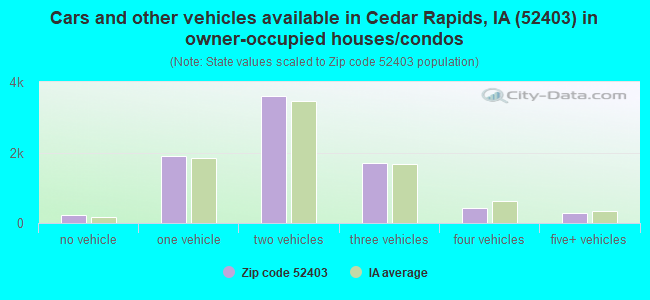
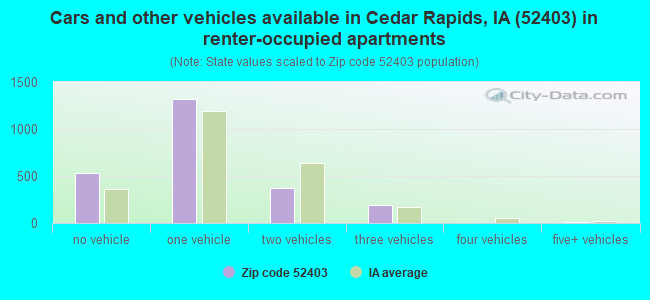
Houses and condos: 11,030 Renter-occupied apartments: 2,428
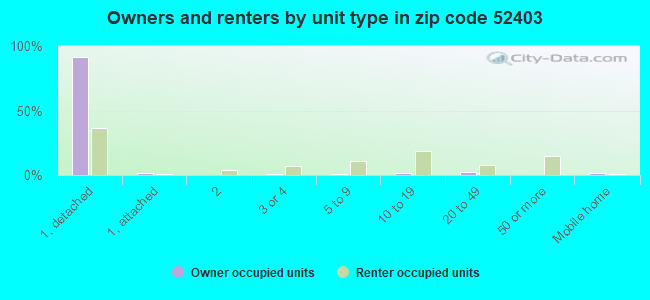
% of renters here:
23%
State:
28%
March 2022 cost of living index in zip code 52403: 86.2 (less than average, U.S. average is 100)
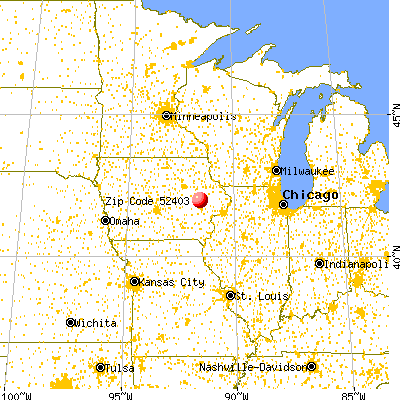
Land area: 26.3 sq. mi. Water area: 0.6 sq. mi.
Population density: 925 people per square mile
(low).
OSM Map
General Map
Google Map
MSN Map
OSM Map
General Map
Google Map
MSN Map
OSM Map
General Map
Google Map
MSN Map
OSM Map
General Map
Google Map
MSN Map
Please wait while loading the map...
Real estate property taxes paid for housing units in 2022:
This zip code:
1.6% ($2,996)
Iowa:
1.4% ($2,724)
Median real estate property taxes paid for housing units with mortgages in 2022: $2,859 (1.6%) Median real estate property taxes paid for housing units with no mortgage in 2022: $3,281 (1.7%)
Averages for the 2020 tax year for zip code 52403, filed in 2021:
Average Adjusted Gross Income (AGI) in 2020: $91,703 (Individual Income Tax Returns)
Here:
$91,703
State:
$71,087
Salary/wage: $64,860 (reported on 81.4% of returns)
Here:
$64,860
State:
$57,361
(% of AGI for various income ranges: 1171.3% for AGIs below $25k, 3528.9% for AGIs $25k-50k, 6200.2% for AGIs $50k-75k, 9301.8% for AGIs $75k-100k, 17136.5% for AGIs $100k-200k, 76831.9% for AGIs over 200k)
Taxable interest for individuals: $3,291 (reported on 40.9% of returns)
This zip code:
$3,291
Iowa:
$1,633
(% of AGI for various income ranges: 20.1% for AGIs below $25k, 37.3% for AGIs $25k-50k, 85.1% for AGIs $50k-75k, 88.0% for AGIs $75k-100k, 264.8% for AGIs $100k-200k, 3844.2% for AGIs over 200k)
Ordinary dividends: $11,211 (reported on 26.5% of returns)
Here:
$11,211
State:
$5,432
(% of AGI for various income ranges: 31.0% for AGIs below $25k, 47.3% for AGIs $25k-50k, 162.3% for AGIs $50k-75k, 277.3% for AGIs $75k-100k, 751.0% for AGIs $100k-200k, 8236.9% for AGIs over 200k)
Net capital gain/loss in AGI: +$29,395 (reported on 23.5% of returns)
Here:
+$29,395
State:
+$15,243
(% of AGI for various income ranges: 12.3% for AGIs below $25k, 39.6% for AGIs $25k-50k, 108.1% for AGIs $50k-75k, 276.9% for AGIs $75k-100k, 799.1% for AGIs $100k-200k, 25768.8% for AGIs over 200k)
Profit/loss from business: +$17,700 (reported on 13.6% of returns)
Here:
+$17,700
State:
+$11,763
(% of AGI for various income ranges: 79.3% for AGIs below $25k, 112.0% for AGIs $25k-50k, 248.1% for AGIs $50k-75k, 406.1% for AGIs $75k-100k, 662.8% for AGIs $100k-200k, 4271.9% for AGIs over 200k)
Taxable individual retirement arrangement distribution: $25,057 (reported on 12.6% of returns)
52403:
$25,057
Iowa:
$17,324
(% of AGI for various income ranges: 58.5% for AGIs below $25k, 103.3% for AGIs $25k-50k, 304.3% for AGIs $50k-75k, 545.5% for AGIs $75k-100k, 1471.2% for AGIs $100k-200k, 4470.8% for AGIs over 200k)
Self-employed (Keogh) retirement plans: $27,177 (reported on 1.1% of returns)
52403:
$27,177
Iowa:
$22,144
(% of AGI for various income ranges: 87.4% for AGIs $100k-200k, 1063.1% for AGIs over 200k)
Total itemized deductions: $37,816 (reported on 16.0% of returns)
Here:
$37,816
State:
$33,775
(% of AGI for various income ranges: 114.4% for AGIs below $25k, 212.7% for AGIs $25k-50k, 532.8% for AGIs $50k-75k, 931.1% for AGIs $75k-100k, 2024.4% for AGIs $100k-200k, 11704.2% for AGIs over 200k)
Charity contributions: $19,959 (reported on 7.9% of returns)
Here:
$19,959
State:
$13,075
(% of AGI for various income ranges: 5.5% for AGIs below $25k, 10.2% for AGIs $25k-50k, 43.5% for AGIs $50k-75k, 78.7% for AGIs $75k-100k, 274.0% for AGIs $100k-200k, 5428.1% for AGIs over 200k)
Taxes paid: $8,054 (reported on 9.6% of returns)
52403:
$8,054
State:
$7,704
(% of AGI for various income ranges: 8.9% for AGIs below $25k, 18.5% for AGIs $25k-50k, 73.1% for AGIs $50k-75k, 139.9% for AGIs $75k-100k, 307.4% for AGIs $100k-200k, 1375.8% for AGIs over 200k)
Earned income credit: $2,118 (reported on 14.3% of returns)
Here:
$2,118
State:
$2,195
(% of AGI for various income ranges: 88.9% for AGIs below $25k, 55.6% for AGIs $25k-50k, 0.9% for AGIs $50k-75k)
Percentage of individuals using paid preparers for their 2020 taxes: 94.1%
Here:
94%
State:
95%
(% for various income ranges: 92.9% for AGIs below $25k, 94.2% for AGIs $25k-50k, 95.2% for AGIs $50k-75k, 95.5% for AGIs $75k-100k, 94.6% for AGIs $100k-200k, 93.5% for AGIs over 200k)
Averages for the 2012 tax year for zip code 52403, filed in 2013:
Average Adjusted Gross Income (AGI) in 2012: $81,593 (Individual Income Tax Returns)
Here:
$81,593
State:
$58,860
Salary/wage: $57,664 (reported on 83.9% of returns)
Here:
$57,664
State:
$46,659
(% of AGI for various income ranges: 75.0% for AGIs below $25k, 78.6% for AGIs $25k-50k, 75.5% for AGIs $50k-75k, 74.3% for AGIs $75k-100k, 69.8% for AGIs $100k-200k, 40.8% for AGIs over 200k)
Taxable interest for individuals: $2,815 (reported on 44.2% of returns)
This zip code:
$2,815
Iowa:
$1,537
(% of AGI for various income ranges: 1.9% for AGIs below $25k, 1.1% for AGIs $25k-50k, 1.2% for AGIs $50k-75k, 1.3% for AGIs $75k-100k, 1.1% for AGIs $100k-200k, 1.9% for AGIs over 200k)
Ordinary dividends: $14,192 (reported on 28.4% of returns)
Here:
$14,192
State:
$4,542
(% of AGI for various income ranges: 2.1% for AGIs below $25k, 1.4% for AGIs $25k-50k, 1.7% for AGIs $50k-75k, 2.3% for AGIs $75k-100k, 2.7% for AGIs $100k-200k, 8.6% for AGIs over 200k)
Net capital gain/loss in AGI: +$23,203 (reported on 22.3% of returns)
Here:
+$23,203
State:
+$11,802
(% of AGI for various income ranges: 0.3% for AGIs $25k-50k, 0.8% for AGIs $50k-75k, 0.6% for AGIs $75k-100k, 1.7% for AGIs $100k-200k, 13.3% for AGIs over 200k)
Profit/loss from business: +$18,016 (reported on 14.9% of returns)
Here:
+$18,016
State:
+$10,509
(% of AGI for various income ranges: 5.2% for AGIs below $25k, 2.9% for AGIs $25k-50k, 2.9% for AGIs $50k-75k, 2.2% for AGIs $75k-100k, 3.7% for AGIs $100k-200k, 3.3% for AGIs over 200k)
Taxable individual retirement arrangement distribution: $19,546 (reported on 13.6% of returns)
52403:
$19,546
Iowa:
$11,773
(% of AGI for various income ranges: 3.5% for AGIs below $25k, 2.6% for AGIs $25k-50k, 2.9% for AGIs $50k-75k, 3.7% for AGIs $75k-100k, 4.0% for AGIs $100k-200k, 3.0% for AGIs over 200k)
Self-employment retirement plans: $25,031 (reported on 1.4% of returns)
52403:
$25,031
Iowa:
$18,614
(% of AGI for various income ranges: 0.3% for AGIs below $25k, 0.6% for AGIs $100k-200k, 0.7% for AGIs over 200k)
Total itemized deductions: $26,950 (17% of AGI, reported on 39.5% of returns)
Here:
$26,950
State:
$21,278
Here:
17.0% of AGI
State:
18.9% of AGI
(% of AGI for various income ranges: 11.0% for AGIs below $25k, 10.7% for AGIs $25k-50k, 12.3% for AGIs $50k-75k, 13.3% for AGIs $75k-100k, 15.2% for AGIs $100k-200k, 13.0% for AGIs over 200k)
Charity contributions: $6,268 (reported on 32.9% of returns)
Here:
$6,268
State:
$4,044
(% of AGI for various income ranges: 0.9% for AGIs below $25k, 1.2% for AGIs $25k-50k, 1.5% for AGIs $50k-75k, 1.8% for AGIs $75k-100k, 2.9% for AGIs $100k-200k, 3.3% for AGIs over 200k)
Taxes paid: $12,466 (reported on 39.5% of returns)
52403:
$12,466
State:
$8,846
(% of AGI for various income ranges: 2.3% for AGIs below $25k, 3.2% for AGIs $25k-50k, 4.3% for AGIs $50k-75k, 5.6% for AGIs $75k-100k, 7.3% for AGIs $100k-200k, 7.1% for AGIs over 200k)
Earned income credit: $2,007 (reported on 15.0% of returns)
Here:
$2,007
State:
$2,098
(% of AGI for various income ranges: 5.4% for AGIs below $25k, 0.8% for AGIs $25k-50k)
Percentage of individuals using paid preparers for their 2012 taxes: 52.7%
Here:
53%
State:
65%
(% for various income ranges: 44.4% for AGIs below $25k, 50.2% for AGIs $25k-50k, 55.1% for AGIs $50k-75k, 57.5% for AGIs $75k-100k, 61.5% for AGIs $100k-200k, 82.5% for AGIs over 200k)
Averages for the 2004 tax year for zip code 52403, filed in 2005:
Average Adjusted Gross Income (AGI) in 2004: $65,823 (Individual Income Tax Returns)
Here:
$65,823
State:
$43,875
Salary/wage: $50,579 (reported on 82.7% of returns)
Here:
$50,579
State:
$38,265
(% of AGI for various income ranges: 103.1% for AGIs below $10k, 71.0% for AGIs $10k-25k, 78.2% for AGIs $25k-50k, 75.3% for AGIs $50k-75k, 77.2% for AGIs $75k-100k, 53.0% for AGIs over 100k)
Taxable interest for individuals: $2,884 (reported on 54.5% of returns)
This zip code:
$2,884
Iowa:
$1,768
(% of AGI for various income ranges: 7.7% for AGIs below $10k, 3.8% for AGIs $10k-25k, 2.1% for AGIs $25k-50k, 2.1% for AGIs $50k-75k, 1.6% for AGIs $75k-100k, 2.4% for AGIs over 100k)
Taxable dividends: $6,621 (reported on 36.6% of returns)
Here:
$6,621
State:
$2,510
(% of AGI for various income ranges: 7.1% for AGIs below $10k, 2.3% for AGIs $10k-25k, 1.5% for AGIs $25k-50k, 2.3% for AGIs $50k-75k, 2.3% for AGIs $75k-100k, 4.9% for AGIs over 100k)
Net capital gain/loss: +$8,761 (reported on 30.0% of returns)
Here:
+$8,761
State:
+$6,139
(% of AGI for various income ranges: 3.4% for AGIs below $10k, 0.3% for AGIs $10k-25k, 0.4% for AGIs $25k-50k, 1.2% for AGIs $50k-75k, 1.9% for AGIs $75k-100k, 6.3% for AGIs over 100k)
Profit/loss from business: +$17,476 (reported on 14.6% of returns)
Here:
+$17,476
State:
+$8,574
(% of AGI for various income ranges: 1.0% for AGIs below $10k, 4.2% for AGIs $10k-25k, 2.8% for AGIs $25k-50k, 4.0% for AGIs $50k-75k, 2.9% for AGIs $75k-100k, 4.3% for AGIs over 100k)
IRA payment deduction: $3,020 (reported on 2.8% of returns)
52403:
$3,020
Iowa:
$2,970
(% of AGI for various income ranges: 0.3% for AGIs $10k-25k, 0.3% for AGIs $25k-50k, 0.2% for AGIs $50k-75k, 0.1% for AGIs $75k-100k, 0.1% for AGIs over 100k)
Self-employed pension: $17,892 (reported on 2.1% of returns)
Here:
$17,892
Iowa:
$11,928
(% of AGI for various income ranges: 0.1% for AGIs $25k-50k, 0.1% for AGIs $50k-75k, 0.2% for AGIs $75k-100k, 0.9% for AGIs over 100k)
Total itemized deductions: $20,991 (18% of AGI, reported on 43.8% of returns)
Here:
$20,991
State:
$16,976
Here:
17.6% of AGI
State:
20.8% of AGI
(% of AGI for various income ranges: 18.7% for AGIs below $10k, 14.2% for AGIs $10k-25k, 13.5% for AGIs $25k-50k, 15.1% for AGIs $50k-75k, 16.5% for AGIs $75k-100k, 13.2% for AGIs over 100k)
Charity contributions deductions: $4,517 (4% of AGI, reported on 38.9% of returns)
Here:
$4,517
State:
$3,089
Here:
3.5% of AGI
State:
3.6% of AGI
(% of AGI for various income ranges: 1.3% for AGIs below $10k, 1.3% for AGIs $10k-25k, 1.6% for AGIs $25k-50k, 2.3% for AGIs $50k-75k, 2.4% for AGIs $75k-100k, 3.2% for AGIs over 100k)
Total tax: $13,242 (reported on 78.5% of returns)
52403:
$13,242
State:
$6,177
(% of AGI for various income ranges: 2.5% for AGIs below $10k, 4.4% for AGIs $10k-25k, 7.4% for AGIs $25k-50k, 9.2% for AGIs $50k-75k, 10.4% for AGIs $75k-100k, 21.8% for AGIs over 100k)
Earned income credit: $1,555 (reported on 11.5% of returns)
Here:
$1,555
State:
$1,540
Percentage of individuals using paid preparers for their 2004 taxes: 59.8%
Here:
60%
State:
70%
(% for various income ranges: 50.9% for AGIs below $10k, 61.4% for AGIs $10k-25k, 58.3% for AGIs $25k-50k, 61.2% for AGIs $50k-75k, 61.1% for AGIs $75k-100k, 69.8% for AGIs over 100k)
Likely homosexual households (counted as self-reported same-sex unmarried-partner households)
Lesbian couples: 0.3% of all households
Gay men: 0.0% of all households
Household received Food Stamps/SNAP in the past 12 months: 778 Household did not receive Food Stamps/SNAP in the past 12 months: 9,771
Women who had a birth in the past 12 months: 327 (265 now married, 64 unmarried) Women who did not have a birth in the past 12 months: 4,537 (1,725 now married, 2,813 unmarried)
Housing units in zip code 52403 with a mortgage: 5,182 (1,065 second mortgage, 23 home equity loan, 729 both second mortgage and home equity loan) Houses without a mortgage: 47
Median monthly owner costs for units with a mortgage: $1,407 Median monthly owner costs for units without a mortgage: $711
Residents with income below the poverty level in 2022:
This zip code:
7.8%
Whole state:
11.0%
Residents with income below 50% of the poverty level in 2022:
This zip code:
4.7%
Whole state:
5.5%
Median number of rooms in houses and condos:
Here:
7.3
State:
6.8
Median number of rooms in apartments:
Here:
4.1
State:
4.2
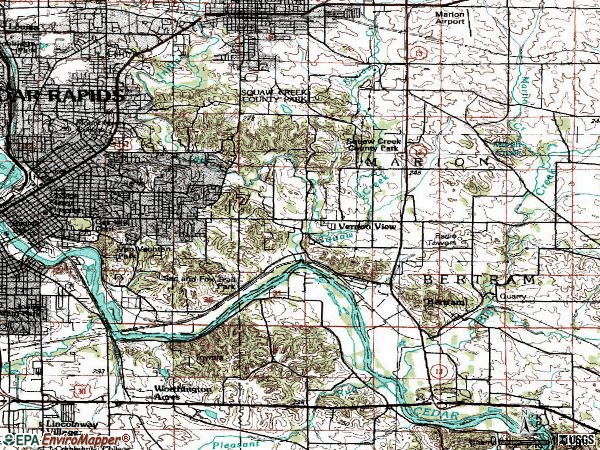
Notable locations in this zip code not listed on our city pages
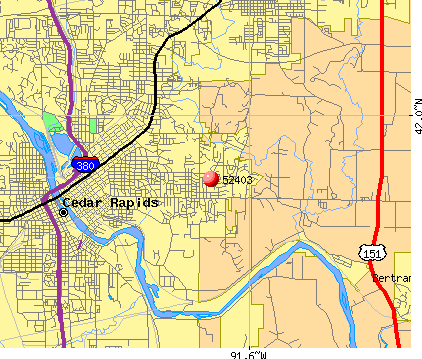
Notable locations in zip code 52403: Brucemore (A), Indian Creek Nature Center (B), Bertram (C), Cedar Rapids Country Club (D), Bever Zoo (E), Area Ambulance Service (F), West Bertram Fire Department (G), Cedar Rapids Fire Department Station 6 (H). Display/hide their locations on the map
Churches in zip code 52403 include: Fellowship Missionary Baptist Church (A), All Saints Catholic Church (B), Faith United Methodist Church (C), First Christian Church (D), Westminster Presbyterian Church (E), Saint Pauls United Methodist Church (F), Iowa Church of God in Christ (G), Living Water United Methodist Church (H), Valley View Baptist Church (I). Display/hide their locations on the map
Cemeteries: Oak Hill Cemetery (1), Campbell Cemetery (2), Syrian Cemetery (3), Saint George Cemetery (4), Mount Calvary Cemetery (5). Display/hide their locations on the map
Parks in zip code 52403 include: Redmond Park (1), Anderson Park (2), Arrowhead Park (3), Beaver Park (4), Bever Park (5), Hitters Park (6), Indian Creek Park (7), Cedar Valley Park (8), Fairview Park (9). Display/hide their locations on the map
Tourist attractions (not listed on the city page) : Buzzards Glory Balloon CO (340 Rosedale Road) (1), Tri-State Travel (Tours & Charters; 144 32nd Street Drive Southeast) (2). Display/hide their approximate locations on the map
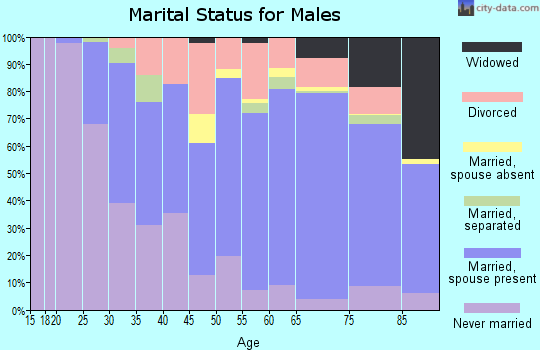
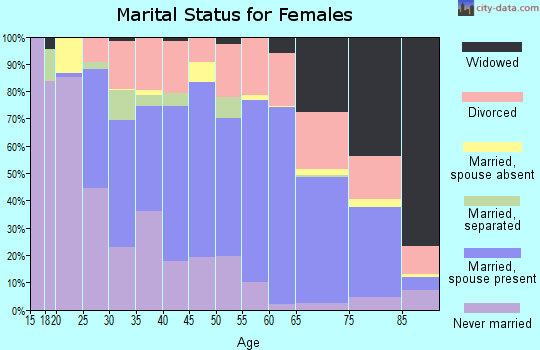
3,170 married couples with children.
1,549 single-parent households (355 men, 1,194 women).
95.3% of residents of 52403 zip code speak English at home.
2.7% of residents speak Spanish at home (78% very well, 12% well, 11% not well).
0.8% of residents speak other Indo-European language at home (87% very well, 13% well).
0.2% of residents speak Asian or Pacific Island language at home (100% very well).
1.3% of residents speak other language at home (12% very well, 39% well, 29% not well, 20% not at all).
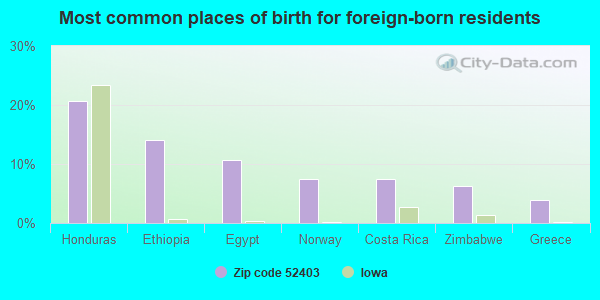
Foreign born population: 669 (2.8%) (60.2% of them are naturalized citizens)
Major facilities with environmental interests located in this zip code:
CEDAR RAPIDS WPCF (7525 BERTRAM RD SOUTHEAST in CEDAR RAPIDS, IA)
AIR MAJOR (AIRS/AFS) STATE MASTER (Iowa emission factors information) CRITERIA AND HAZARDOUS AIR POLLUTANT INVENTORY (Inventory of air pollution sources) National Pollutant Discharge Elimination System MAJOR (Tracking pollutant discharge elimination systems) - permit - ICIS-, ENFORCEMENT/COMPLIANCE ACTIVITY Conditionally Exempt Small Quantity Generators, less than 100 kg/month of hazardous waste (Resource Conservation and Recovery Act (tracking hazardous waste)) Business SIC classification: SEWERAGE SYSTEMS; REFUSE SYSTEMS Business NAICS classification: SEWAGE TREATMENT FACILITIES. Organizations: CITY OF CEDAR RAPIDS (CONTACT/OWNER)
Alternative names: C.R.WATER POLL.PLANT, CEDAR RAPIDS CITY OF STP, CITY OF CEDAR RAPIDS WATER POLLUTION CONTROL FACILITY, CITY OF CEDAR RAPIDS WPCF, WATER POLLUTION CONTROL FACILITY
CEDAR VALLEY CHRISTIAN SCHOOL (3636 COTTAGE GROVE AVE in CEDAR RAPIDS, IA)
(Integrated Compliance Information System) - ICIS-07-1986-0062, FORMAL ENFORCEMENT ACTION COMPLIANCE ACTIVITY (Tracking inspections of insecticide, fungicide, and rodenticide, and toxic substances)
USF HOLLAND INC (4601 1ST AVE SE in CEDAR RAPIDS, IA)
(Resource Conservation and Recovery Act (tracking hazardous waste)) Organizations: MENARDS (CONTACT/OPERATOR)
Alternative names: MENARDS
APAC CUSTOMER SERVICES, INC. (425 2ND STREET SE in CEDAR RAPIDS, IA)
AIR MINOR (AIRS/AFS) AIR SYNTHETIC MINOR (AIRS/AFS) Business SIC classification: NONCLASSIFIABLE ESTABLISHMENTS Alternative names: APAC TELESERVICES
CAMP BROTHERS BOOKS (2315 MT VERNON RD SE in CEDAR RAPIDS, IA)
(Resource Conservation and Recovery Act (tracking hazardous waste)) Organizations: STEVE CAMP (CONTACT/OWNER)
CARRIAGE CLEANERS (3102 MT VERNON RD SE in CEDAR RAPIDS, IA)
AIR MINOR (AIRS/AFS) Small Quantity Generators, between 100 kg and 1000 kg of hazardous waste/month (Resource Conservation and Recovery Act (tracking hazardous waste)) Business SIC classification: DRYCLEANING PLANTS, EXCEPT RUG CLEANING
RUSSELLS GUIDES INC (817 2ND AVE SE in CEDAR RAPIDS, IA)
(Resource Conservation and Recovery Act (tracking hazardous waste)) Business NAICS classification: COMMERCIAL LITHOGRAPHIC PRINTING.; ALL OTHER PUBLISHERS. Organizations: HARRY GILLESPIE (CONTACT/OWNER)
THE HOME DEPOT (4501 1ST AVE SE in CEDAR RAPIDS, IA)
COMPLIANCE ACTIVITY (Tracking inspections of insecticide, fungicide, and rodenticide, and toxic substances) Conditionally Exempt Small Quantity Generators, less than 100 kg/month of hazardous waste (Resource Conservation and Recovery Act (tracking hazardous waste)) Organizations: HOME DEPOT USA (CONTACT/OPERATOR)
Alternative names: HOME DEPOT HD2108, HOME DEPOT #2108
ALBERT AUTO SERVICE, INC. - EAST (3108 MT. VERNON ROAD SE in CEDAR RAPIDS, IA)
AIR MINOR (AIRS/AFS) Business SIC classification: GENERAL AUTOMOTIVE REPAIR SHOPS
AMERICAN LASERARTS (210 10TH. AVE. S.E. in CEDAR RAPIDS, IA)
AIR MINOR (AIRS/AFS) Business SIC classification: NONCLASSIFIABLE ESTABLISHMENTS Alternative names: CLOSED FACILITY -- AMERICAN LASERARTS
AUTO RADIATOR INCORPORATED (NO STREET ADDRESS in CEDAR RAPIDS, IA)
AIR MINOR (AIRS/AFS) Business SIC classification: NONCLASSIFIABLE ESTABLISHMENTS Alternative names: CLOSED FACILITY -- AUTO RADIATOR INCORPORATED
B J ENTERPRISES-DBA CHEMLAWN-FORMER SITE (3030 2ND AVE SE in CEDAR RAPIDS, IA)
(Resource Conservation and Recovery Act (tracking hazardous waste))
CEDAR VALLEY HUMANE SOCIETY (7411 MOUNT VERNON ROAD SOUTHEAST in CEDAR RAPIDS, IA)
AIR MINOR (AIRS/AFS) Business SIC classification: NONCLASSIFIABLE ESTABLISHMENTS
Housing units lacking complete plumbing facilities: 0.1% Housing units lacking complete kitchen facilities: 0.7%
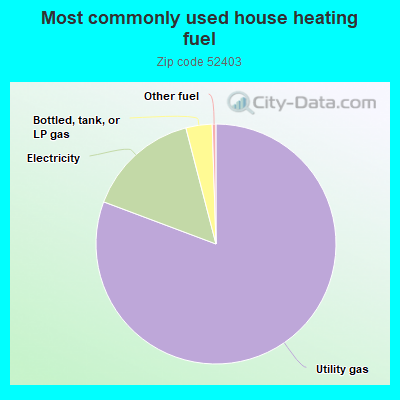
80.0%Utility gas
15.1%Electricity
3.5%Bottled, tank, or LP gas
0.5%Other fuel
Population in 1990: 25,064.
Place of birth for U.S.-born residents:
This state: 16,928
Northeast: 309
Midwest: 3,449
South: 1,443
West: 1,298
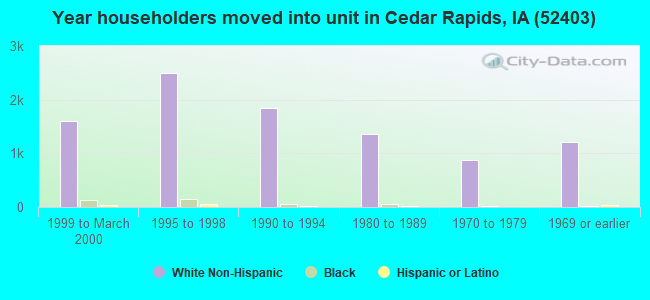
55% of the 52403 zip code residents lived in the same house 5 years ago. Out of people who lived in different houses, 68% lived in this county. Out of people who lived in different counties, 50% lived in Iowa.
92% of the 52403 zip code residents lived in the same house 1 year ago. Out of people who lived in different houses, 64% moved from this county. Out of people who lived in different houses, 23% moved from different county within same state. Out of people who lived in different houses, 11% moved from different state. Out of people who lived in different houses, 3% moved from abroad.
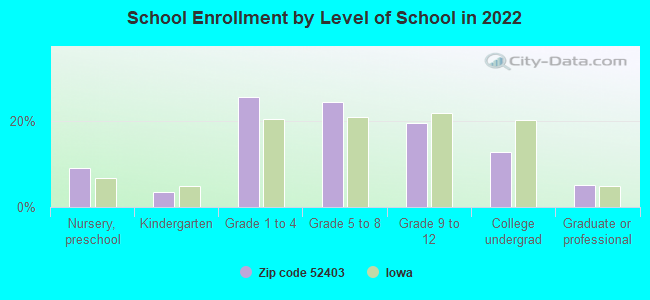
Private vs. public school enrollment:
Students in private schools in grades 1 to 8 (elementary and middle school): 357
Here:
13.5%
Iowa:
10.6%
Students in private schools in grades 9 to 12 (high school): 63
Here:
6.2%
Iowa:
7.9%
Students in private undergraduate colleges: 45
Here:
6.9%
Iowa:
23.9%
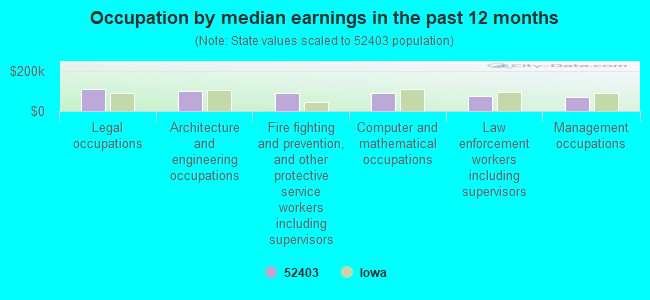
Occupation by median earnings in the past 12 months ($)
109,204Legal occupations
101,427Architecture and engineering occupations
92,242Fire fighting and prevention, and other protective service workers including supervisors
88,302Computer and mathematical occupations
74,279Law enforcement workers including supervisors
70,159Management occupations
Companies with federal contracts located in this zip code:
A + COMMERCIAL CLEANING (2738 DALEWOOD AVENUE SE in CEDAR RAPIDS, IA; small business) : $50,354 in 6 contractsfrom 2003 to 2006
Contracts for Custodial Janitorial Services by Army Signed by year:2000: $0; 2001: $0; 2002: $0; 2003: $11,681; 2004: $12,849; 2005: $12,524; 2006: $13,300.
Biggest contracts:
$13,300 with Army for Custodial Janitorial Services. Signed on 2006-04-14. Completion date: 2007-04-30.
$12,849, same as above.Signed on 2004-04-07. Completion date: 2005-03-31.
$12,524, same as above.Signed on 2005-04-28. Completion date: 2006-04-30.
$11,681, same as above.Signed on 2003-03-02. Completion date: 2004-03-31.
CONSTRUCTION EQUIPMENT INDICAT (1307 34TH ST SE in CEDAR RAPIDS, IA) : $18,000 in 3 contractsin 2005
$15,000 with Army for Cranes and Crane-Shovels. Signed on 2005-07-14. Completion date: 2005-07-11.
$1,500, same as above.Signed on 2005-08-04. Completion date: 2005-07-11.
$1,500 with U.S. Army Corps of Engineers - civil program financing only for Cranes and Crane-Shovels. Signed on 2005-08-04. Completion date: 2005-07-11.
MORTUARY LIFT COMPANY INC (127 COTTAGE GROVE AVE SE in CEDAR RAPIDS, IA; small business) : $13,667 in 2 contractsin 2005
$12,945 with Navy for Winches, Hoists, Cranes, and Derricks. Signed on 2005-09-30. Completion date: 2006-01-31.
$722, same as above.Signed on 2005-09-30. Completion date: 2006-01-31.
Top industries in this zip code by the number of employees in 2005:
Health Care and Social Assistance: General Medical and Surgical Hospitals (over 1000 employees: 1 establishment)
Health Care and Social Assistance: Offices of Physicians (except Mental Health Specialists) (50-99: 3, 20-49: 5, 10-19: 7, 5-9: 3, 1-4: 14)
Health Care and Social Assistance: Nursing Care Facilities (100-249: 2, 20-49: 1)
2002 - 2018 National Fire Incident Reporting System (NFIRS) incidents
According to the data from the years 2002 - 2018 the average number of fire incidents per year is 55. The highest number of reported fires - 101 took place in 2008, and the least - 0 in 2003. The data has a declining trend.
When looking into fire subcategories, the most incidents belonged to: Structure Fires (48.4%), and Outside Fires (34.0%).
Fire incident types reported to NFIRS in Zip Code 52403


 Nearest zip codes: 52227, 52401, 52302, 52402, 52314, 52404.


 According to the data from the years 2002 - 2018 the average number of fire incidents per year is 55. The highest number of reported fires - 101 took place in 2008, and the least - 0 in 2003. The data has a declining trend.
 When looking into fire subcategories, the most incidents belonged to: Structure Fires (48.4%), and Outside Fires (34.0%).