Estimated zip code population in 2022: 3,224 Zip code population in 2010: 3,268 Zip code population in 2000: 3,139
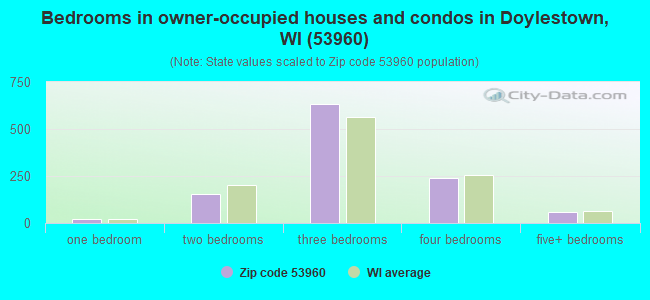
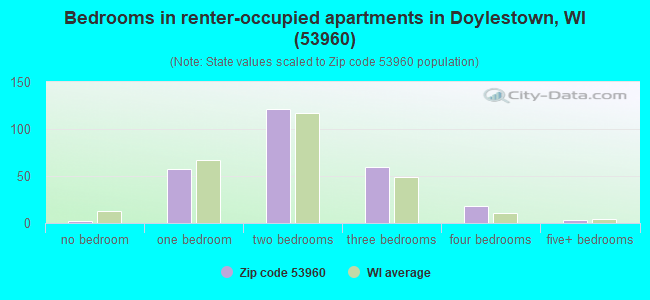
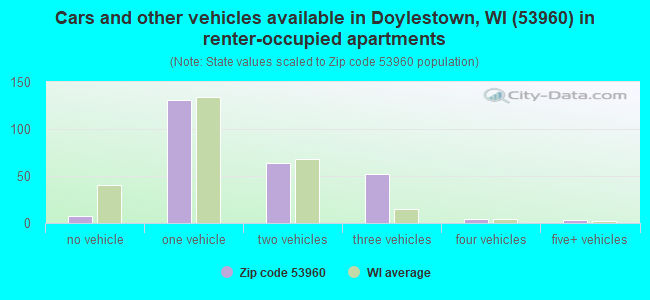
Houses and condos: 1,504 Renter-occupied apartments: 262
% of renters here:
19%
State:
32%
March 2022 cost of living index in zip code 53960: 86.8 (less than average, U.S. average is 100)
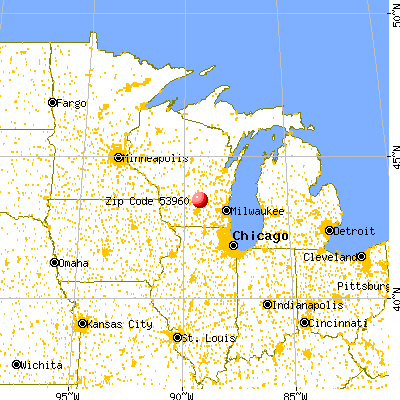
Land area: 90.4 sq. mi. Water area: 2.0 sq. mi.
Population density: 36 people per square mile
(very low).
OSM Map
General Map
Google Map
MSN Map
OSM Map
General Map
Google Map
MSN Map
OSM Map
General Map
Google Map
MSN Map
OSM Map
General Map
Google Map
MSN Map
Please wait while loading the map...
Real estate property taxes paid for housing units in 2022:
This zip code:
1.3% ($3,559)
Wisconsin:
1.4% ($3,497)
Median real estate property taxes paid for housing units with mortgages in 2022: $3,624 (1.3%) Median real estate property taxes paid for housing units with no mortgage in 2022: $3,385 (1.3%)
Business Search- 14 Million verified businesses
Males: 1,710
(53.0%)
Females: 1,514
(47.0%)
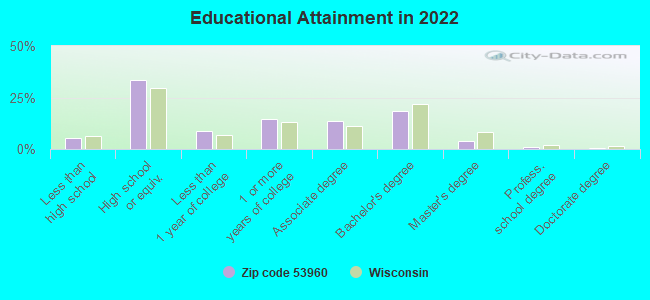
For population 25 years and over in 53960:
High school or higher: 93.9%
Bachelor's degree or higher: 23.8%
Graduate or professional degree: 5.4%
Unemployed: 2.3%
Mean travel time to work (commute): 30.2 minutes
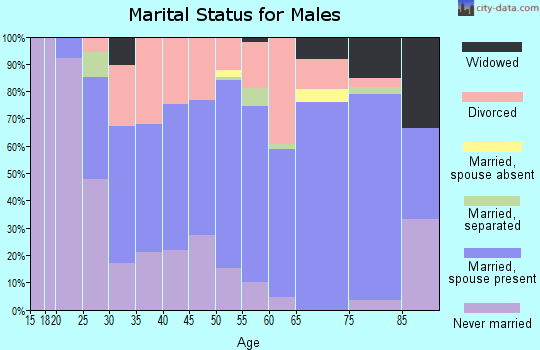
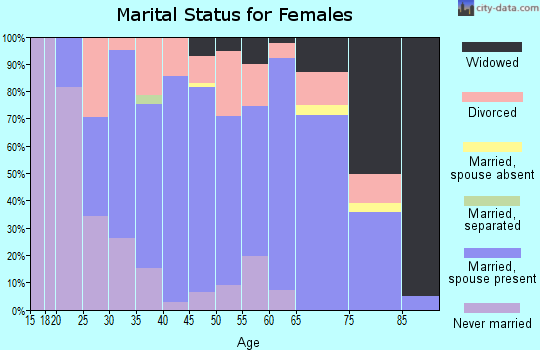
For population 15 years and over in 53960:
Never married: 30.9%
Now married: 50.1%
Separated: 0.5%
Widowed: 5.7%
Divorced: 12.9%
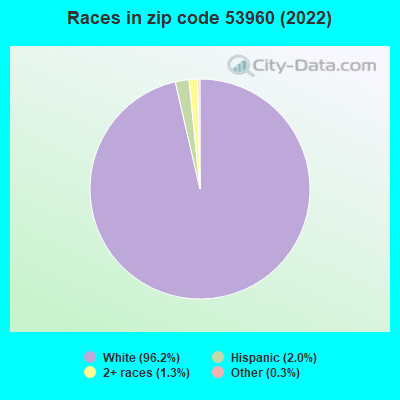
Zip code 53960 compared to state average:
Black race population percentage significantly below state average.
Hispanic race population percentage significantly below state average.
Foreign-born population percentage significantly below state average.
Renting percentage below state average.
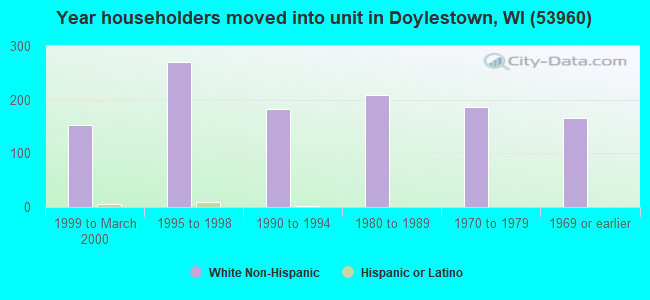
Length of stay since moving in significantly above state average.
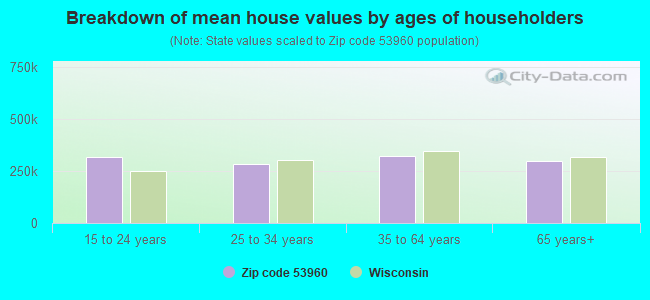
Estimated median house/condo value in 2022: $266,238
53960:
$266,238
Wisconsin:
$252,800
According to our research of Wisconsin and other state lists, there were 5 registered sex offenders living in 53960 zip code as of April 19, 2024. The ratio of all residents to sex offenders in zip code 53960 is 716 to 1. The ratio of registered sex offenders to all residents in this zip code is lower than the state average.
Median resident age:
This zip code:
43.2 years
Wisconsin median age:
40.4 years
Average household size:
This zip code:
2.4 people
Wisconsin:
2.3 people
Averages for the 2020 tax year for zip code 53960, filed in 2021:
Average Adjusted Gross Income (AGI) in 2020: $68,905 (Individual Income Tax Returns)
Here:
$68,905
State:
$72,319
Salary/wage: $56,666 (reported on 81.2% of returns)
Here:
$56,666
State:
$59,242
(% of AGI for various income ranges: 1276.0% for AGIs below $25k, 4005.0% for AGIs $25k-50k, 6180.9% for AGIs $50k-75k, 10482.9% for AGIs $75k-100k, 17855.3% for AGIs $100k-200k)
Taxable interest for individuals: $635 (reported on 43.8% of returns)
This zip code:
$635
Wisconsin:
$1,431
(% of AGI for various income ranges: 22.4% for AGIs below $25k, 23.0% for AGIs $25k-50k, 33.5% for AGIs $50k-75k, 52.1% for AGIs $75k-100k, 101.2% for AGIs $100k-200k)
Ordinary dividends: $3,458 (reported on 21.6% of returns)
Here:
$3,458
State:
$6,481
(% of AGI for various income ranges: 39.2% for AGIs below $25k, 49.3% for AGIs $25k-50k, 57.4% for AGIs $50k-75k, 80.7% for AGIs $75k-100k, 244.7% for AGIs $100k-200k)
Net capital gain/loss in AGI: +$9,924 (reported on 19.3% of returns)
Here:
+$9,924
State:
+$18,329
(% of AGI for various income ranges: 12.0% for AGIs below $25k, 38.3% for AGIs $25k-50k, 102.6% for AGIs $50k-75k, 188.6% for AGIs $75k-100k, 552.4% for AGIs $100k-200k)
Profit/loss from business: +$11,284 (reported on 14.2% of returns)
Here:
+$11,284
State:
+$14,562
(% of AGI for various income ranges: 153.2% for AGIs below $25k, 106.0% for AGIs $25k-50k, 105.2% for AGIs $50k-75k, 467.1% for AGIs $75k-100k, 720.0% for AGIs $100k-200k)
Taxable individual retirement arrangement distribution: $16,309 (reported on 12.5% of returns)
53960:
$16,309
Wisconsin:
$19,348
(% of AGI for various income ranges: 131.2% for AGIs below $25k, 174.7% for AGIs $25k-50k, 250.0% for AGIs $50k-75k, 363.6% for AGIs $75k-100k, 971.8% for AGIs $100k-200k)
Total itemized deductions: $23,717 (reported on 6.8% of returns)
Here:
$23,717
State:
$33,000
(% of AGI for various income ranges: 160.0% for AGIs $25k-50k, 282.2% for AGIs $50k-75k, 331.4% for AGIs $75k-100k, 737.1% for AGIs $100k-200k)
Charity contributions: $3,729 (reported on 4.0% of returns)
Here:
$3,729
State:
$12,044
(% of AGI for various income ranges: 19.1% for AGIs $50k-75k, 127.6% for AGIs $100k-200k)
Taxes paid: $7,542 (reported on 6.8% of returns)
53960:
$7,542
State:
$8,228
(% of AGI for various income ranges: 43.7% for AGIs $25k-50k, 87.4% for AGIs $50k-75k, 124.3% for AGIs $75k-100k, 234.7% for AGIs $100k-200k)
Earned income credit: $2,020 (reported on 8.5% of returns)
Here:
$2,020
State:
$2,155
(% of AGI for various income ranges: 66.0% for AGIs below $25k, 46.0% for AGIs $25k-50k)
Percentage of individuals using paid preparers for their 2020 taxes: 93.2%
Here:
93%
State:
94%
(% for various income ranges: 88.4% for AGIs below $25k, 95.2% for AGIs $25k-50k, 96.8% for AGIs $50k-75k, 95.7% for AGIs $75k-100k, 93.8% for AGIs $100k-200k, 80.0% for AGIs over 200k)
Averages for the 2012 tax year for zip code 53960, filed in 2013:
Average Adjusted Gross Income (AGI) in 2012: $53,988 (Individual Income Tax Returns)
Here:
$53,988
State:
$57,939
Salary/wage: $44,661 (reported on 85.9% of returns)
Here:
$44,661
State:
$48,248
(% of AGI for various income ranges: 68.4% for AGIs below $25k, 77.1% for AGIs $25k-50k, 78.3% for AGIs $50k-75k, 76.1% for AGIs $75k-100k, 75.9% for AGIs $100k-200k, 34.2% for AGIs over 200k)
Taxable interest for individuals: $733 (reported on 42.9% of returns)
This zip code:
$733
Wisconsin:
$1,224
(% of AGI for various income ranges: 2.6% for AGIs below $25k, 0.8% for AGIs $25k-50k, 0.5% for AGIs $50k-75k, 0.4% for AGIs $75k-100k, 0.2% for AGIs $100k-200k, 0.3% for AGIs over 200k)
Ordinary dividends: $2,762 (reported on 19.6% of returns)
Here:
$2,762
State:
$5,137
(% of AGI for various income ranges: 1.4% for AGIs below $25k, 0.7% for AGIs $25k-50k, 0.8% for AGIs $50k-75k, 0.5% for AGIs $75k-100k, 2.2% for AGIs $100k-200k)
Net capital gain/loss in AGI: +$10,304 (reported on 16.0% of returns)
Here:
+$10,304
State:
+$11,137
(% of AGI for various income ranges: 0.5% for AGIs $25k-50k, 1.0% for AGIs $50k-75k, 1.3% for AGIs $75k-100k, 10.4% for AGIs $100k-200k)
Profit/loss from business: +$7,200 (reported on 14.7% of returns)
Here:
+$7,200
State:
+$11,943
(% of AGI for various income ranges: 9.3% for AGIs below $25k, 1.8% for AGIs $25k-50k, 0.8% for AGIs $50k-75k, 1.4% for AGIs $75k-100k, 2.5% for AGIs $100k-200k)
Taxable individual retirement arrangement distribution: $12,300 (reported on 11.0% of returns)
53960:
$12,300
Wisconsin:
$14,087
(% of AGI for various income ranges: 6.2% for AGIs below $25k, 3.0% for AGIs $25k-50k, 3.4% for AGIs $50k-75k, 3.5% for AGIs $100k-200k)
Total itemized deductions: $17,983 (22% of AGI, reported on 42.3% of returns)
Here:
$17,983
State:
$22,257
Here:
21.7% of AGI
State:
20.1% of AGI
(% of AGI for various income ranges: 15.0% for AGIs below $25k, 11.8% for AGIs $25k-50k, 14.3% for AGIs $50k-75k, 14.8% for AGIs $75k-100k, 15.9% for AGIs $100k-200k, 12.0% for AGIs over 200k)
Charity contributions: $1,929 (reported on 30.1% of returns)
Here:
$1,929
State:
$3,370
(% of AGI for various income ranges: 0.9% for AGIs below $25k, 0.8% for AGIs $25k-50k, 0.8% for AGIs $50k-75k, 1.3% for AGIs $75k-100k, 1.2% for AGIs $100k-200k, 1.4% for AGIs over 200k)
Taxes paid: $7,703 (reported on 42.3% of returns)
53960:
$7,703
State:
$10,731
(% of AGI for various income ranges: 3.8% for AGIs below $25k, 4.0% for AGIs $25k-50k, 6.0% for AGIs $50k-75k, 6.7% for AGIs $75k-100k, 7.8% for AGIs $100k-200k, 5.7% for AGIs over 200k)
Earned income credit: $1,860 (reported on 12.3% of returns)
Here:
$1,860
State:
$2,094
(% of AGI for various income ranges: 4.5% for AGIs below $25k, 0.8% for AGIs $25k-50k)
Percentage of individuals using paid preparers for their 2012 taxes: 63.8%
Here:
64%
State:
54%
(% for various income ranges: 55.8% for AGIs below $25k, 66.7% for AGIs $25k-50k, 65.6% for AGIs $50k-75k, 64.7% for AGIs $75k-100k, 70.6% for AGIs $100k-200k, 100.0% for AGIs over 200k)
Averages for the 2004 tax year for zip code 53960, filed in 2005:
Average Adjusted Gross Income (AGI) in 2004: $42,480 (Individual Income Tax Returns)
Here:
$42,480
State:
$47,735
Salary/wage: $39,231 (reported on 86.7% of returns)
Here:
$39,231
State:
$41,540
(% of AGI for various income ranges: 141.4% for AGIs below $10k, 74.8% for AGIs $10k-25k, 79.9% for AGIs $25k-50k, 84.0% for AGIs $50k-75k, 83.9% for AGIs $75k-100k, 68.4% for AGIs over 100k)
Taxable interest for individuals: $956 (reported on 51.5% of returns)
This zip code:
$956
Wisconsin:
$1,420
(% of AGI for various income ranges: 14.8% for AGIs below $10k, 3.3% for AGIs $10k-25k, 1.7% for AGIs $25k-50k, 0.5% for AGIs $50k-75k, 0.5% for AGIs $75k-100k, 0.5% for AGIs over 100k)
Taxable dividends: $1,164 (reported on 24.1% of returns)
Here:
$1,164
State:
$2,869
(% of AGI for various income ranges: 3.9% for AGIs below $10k, 1.4% for AGIs $10k-25k, 1.0% for AGIs $25k-50k, 0.3% for AGIs $50k-75k, 0.4% for AGIs $75k-100k, 0.6% for AGIs over 100k)
Net capital gain/loss: +$7,425 (reported on 20.1% of returns)
Here:
+$7,425
State:
+$9,569
(% of AGI for various income ranges: 1.4% for AGIs below $10k, 2.3% for AGIs $10k-25k, 1.6% for AGIs $25k-50k, 2.1% for AGIs $50k-75k, 0.5% for AGIs $75k-100k, 12.6% for AGIs over 100k)
Profit/loss from business: +$7,421 (reported on 15.1% of returns)
Here:
+$7,421
State:
+$10,417
(% of AGI for various income ranges: 26.2% for AGIs below $10k, 3.4% for AGIs $10k-25k, 3.1% for AGIs $25k-50k, 2.3% for AGIs $50k-75k, 1.8% for AGIs $75k-100k, 1.7% for AGIs over 100k)
IRA payment deduction: $2,907 (reported on 3.4% of returns)
53960:
$2,907
Wisconsin:
$2,900
Total itemized deductions: $16,078 (25% of AGI, reported on 41.1% of returns)
Here:
$16,078
State:
$18,160
Here:
24.7% of AGI
State:
21.1% of AGI
(% of AGI for various income ranges: 26.7% for AGIs below $10k, 9.0% for AGIs $10k-25k, 15.1% for AGIs $25k-50k, 15.8% for AGIs $50k-75k, 18.0% for AGIs $75k-100k, 15.6% for AGIs over 100k)
Charity contributions deductions: $1,526 (2% of AGI, reported on 31.4% of returns)
Here:
$1,526
State:
$2,711
Here:
2.2% of AGI
State:
3.0% of AGI
(% of AGI for various income ranges: 0.8% for AGIs $10k-25k, 0.9% for AGIs $25k-50k, 1.0% for AGIs $50k-75k, 1.6% for AGIs $75k-100k, 1.5% for AGIs over 100k)
Total tax: $4,871 (reported on 80.1% of returns)
53960:
$4,871
State:
$7,114
(% of AGI for various income ranges: 5.7% for AGIs below $10k, 4.6% for AGIs $10k-25k, 7.0% for AGIs $25k-50k, 8.0% for AGIs $50k-75k, 9.6% for AGIs $75k-100k, 16.3% for AGIs over 100k)
Earned income credit: $1,481 (reported on 8.2% of returns)
Here:
$1,481
State:
$1,544
Percentage of individuals using paid preparers for their 2004 taxes: 63.0%
Here:
63%
State:
57%
(% for various income ranges: 53.5% for AGIs below $10k, 61.9% for AGIs $10k-25k, 64.2% for AGIs $25k-50k, 67.9% for AGIs $50k-75k, 60.7% for AGIs $75k-100k, 76.3% for AGIs over 100k)
Likely homosexual households (counted as self-reported same-sex unmarried-partner households)
Lesbian couples: 0.4% of all households
Gay men: 0.0% of all households
Household received Food Stamps/SNAP in the past 12 months: 132 Household did not receive Food Stamps/SNAP in the past 12 months: 1,227
Women who had a birth in the past 12 months: 28 (20 now married, 7 unmarried) Women who did not have a birth in the past 12 months: 594 (261 now married, 333 unmarried)
Housing units in zip code 53960 with a mortgage: 722 (170 second mortgage, 135 both second mortgage and home equity loan) Houses without a mortgage: 27
Median monthly owner costs for units with a mortgage: $1,638 Median monthly owner costs for units without a mortgage: $681
Residents with income below the poverty level in 2022:
This zip code:
10.1%
Whole state:
10.7%
Residents with income below 50% of the poverty level in 2022:
This zip code:
5.1%
Whole state:
5.7%
Median number of rooms in houses and condos:
Here:
6.9
State:
6.5
Median number of rooms in apartments:
Here:
5.2
State:
4.1
Notable locations in this zip code not listed on our city pages
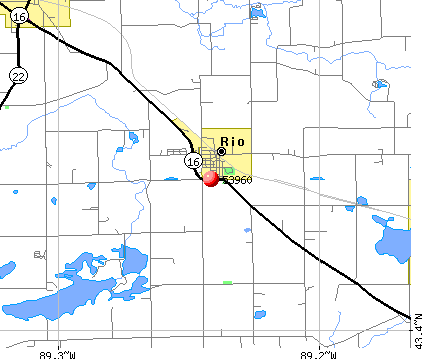
Notable locations in zip code 53960: Little Bluff Campground (A), Rio Fire Department / Rio Emergency Medical Services (B). Display/hide their locations on the map
Churches in zip code 53960 include: Bonnet Prairie Lutheran Church (A), Assembly of God Church (B), Redeemer Lutheran Church (C), Saint Josephs Catholic Church (D). Display/hide their locations on the map
Cemeteries: Hampden Cemetery (1), Rocky Run Protestant Cemetery (2), Rocky Run Catholic Cemetery (3), Bonnet Prairie Lutheran Cemetery (4), Ohio Cemetery (5), Saint Johns Lutheran Cemetery (6), Saint Joseph Cemetery (7). Display/hide their locations on the map
Lakes and reservoirs: Mud Lake (A), Hawkos Pond (B), Grassy Lake (C), 0.985 Reservoir (D), 37 Reservoir (E), 17 Reservoir (F), Silver Springs Pond (G), Willow Mill Pond (H). Display/hide their locations on the map
Parks in zip code 53960 include: Grassy Lake State Wildlife Area (1), Jennings Creek State Wildlife Area (2), Mud Lake State Public Hunting Grounds (3). Display/hide their locations on the map
418 married couples with children.
127 single-parent households (49 men, 78 women).
98.7% of residents of 53960 zip code speak English at home.
0.7% of residents speak Spanish at home (87% very well, 13% not well).
0.3% of residents speak other Indo-European language at home (62% very well, 38% not well).
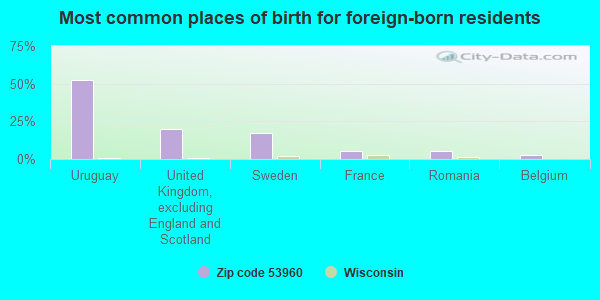
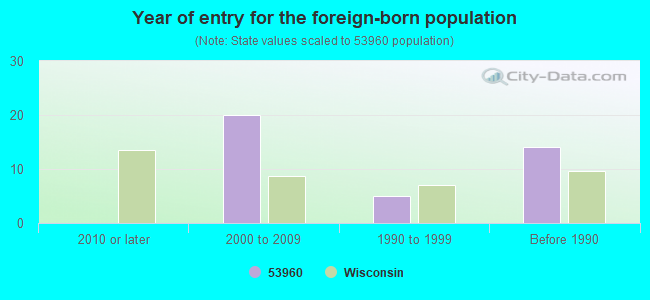
Foreign born population: 40 (1.3%) (68.4% of them are naturalized citizens)
This zip code:
1.3%
Whole state:
5.0%
52%Uruguay
20%United Kingdom, excluding England and Scotland
18%Sweden
5%France
5%Romania
2%Belgium
49%German
12%American
10%Norwegian
7%English
4%Irish
3%European
2%Polish
Year of entry for the foreign-born population
02010 or later
202000 to 2009
51990 to 1999
14Before 1990
Facilities with environmental interests located in this zip code:
DANN & WENDT INC. - CEDAR RAPIDS #7329 (PORTABLE in RIO, WI)
AIR SYNTHETIC MINOR (AIRS/AFS) CRITERIA AND HAZARDOUS AIR POLLUTANT INVENTORY (Inventory of air pollution sources) STATE MASTER (Wisconsin database) - NEI-WI998359890, AIR PROGRAM STATE MASTER (Wisconsin database) - NEI-WI998226790, AIR PROGRAM Business SIC classification: CRUSHED AND BROKEN LIMESTONE; CRUSHED AND BROKEN STONE Business NAICS classification: CRUSHED AND BROKEN LIMESTONE MINING AND QUARRYING.; OTHER CRUSHED AND BROKEN STONE MINING AND QUARRYING.; OTHER CRUSHED AND BROKEN STONE MINING AND QUARRYING. Organizations: DANN& WENDT INC. Alternative names: DANN & WENDT INC. - LIPPMAN JAW 550615
Housing units lacking complete plumbing facilities: 1.5% Housing units lacking complete kitchen facilities: 2.6%
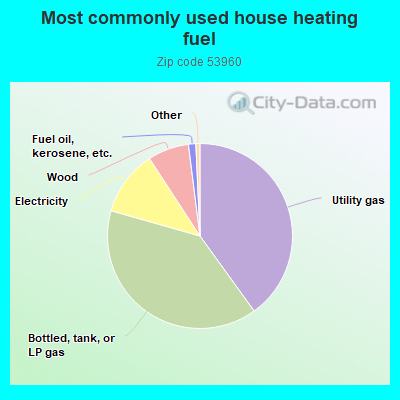
40.1%Utility gas
39.4%Bottled, tank, or LP gas
11.4%Electricity
7.2%Wood
1.3%Fuel oil, kerosene, etc.
Population in 1990: 2,766. Population change in the 1990s: +373 (+13.5%).
Place of birth for U.S.-born residents:
This state: 2,616
Northeast: 44
Midwest: 358
South: 84
West: 70
63% of the 53960 zip code residents lived in the same house 5 years ago. Out of people who lived in different houses, 43% lived in this county. Out of people who lived in different counties, 50% lived in Wisconsin.
92% of the 53960 zip code residents lived in the same house 1 year ago. Out of people who lived in different houses, 51% moved from this county. Out of people who lived in different houses, 43% moved from different county within same state. Out of people who lived in different houses, 5% moved from different state.
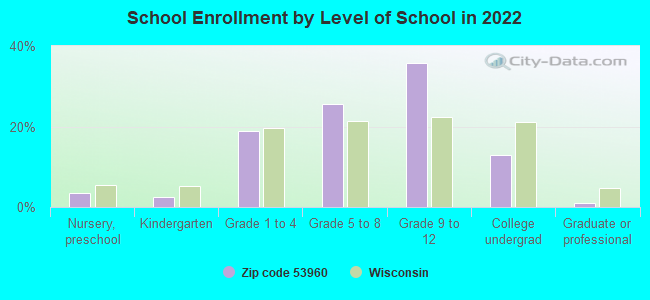
Private vs. public school enrollment:
Students in private schools in grades 1 to 8 (elementary and middle school): 1
Here:
0.7%
Wisconsin:
16.7%
Students in private schools in grades 9 to 12 (high school):
Here:
0.0%
Wisconsin:
12.5%
Students in private undergraduate colleges: 8
Here:
11.3%
Wisconsin:
17.5%
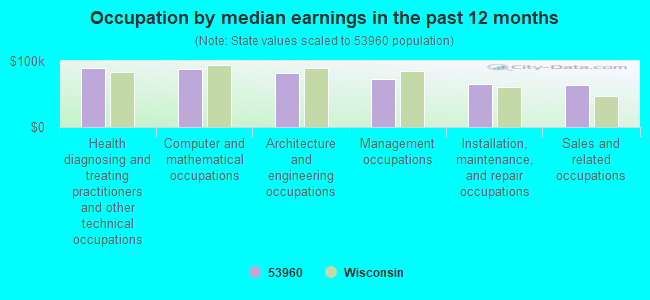
Occupation by median earnings in the past 12 months ($)
89,162Health diagnosing and treating practitioners and other technical occupations
88,568Computer and mathematical occupations
81,358Architecture and engineering occupations
73,044Management occupations
64,504Installation, maintenance, and repair occupations
63,403Sales and related occupations
Top industries in this zip code by the number of employees in 2005:
2004 - 2018 National Fire Incident Reporting System (NFIRS) incidents
Based on the data from the years 2004 - 2018 the average number of fires per year is 10. The highest number of fire incidents - 20 took place in 2016, and the least - 1 in 2006. The data has a dropping trend.
When looking into fire subcategories, the most reports belonged to: Structure Fires (41.7%), and Outside Fires (35.8%).
Fire incident types reported to NFIRS in Zip Code 53960


 Nearest zip codes: 53928, 53969, 53954, 53911, 53923, 53932.


 Based on the data from the years 2004 - 2018 the average number of fires per year is 10. The highest number of fire incidents - 20 took place in 2016, and the least - 1 in 2006. The data has a dropping trend.
 When looking into fire subcategories, the most reports belonged to: Structure Fires (41.7%), and Outside Fires (35.8%).