Estimated zip code population in 2022: 865 Zip code population in 2010: 821 Zip code population in 2000: 909
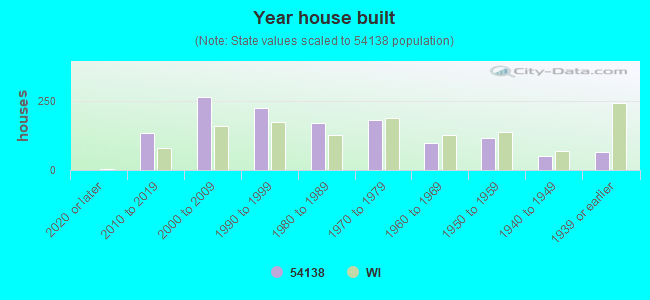
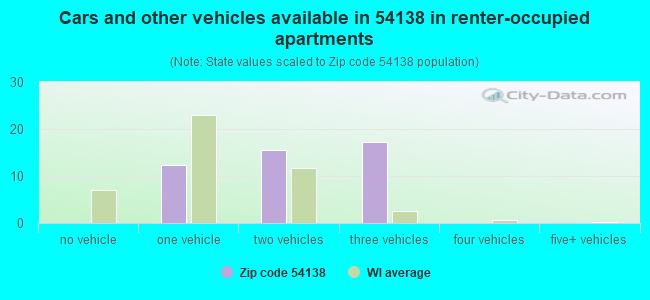
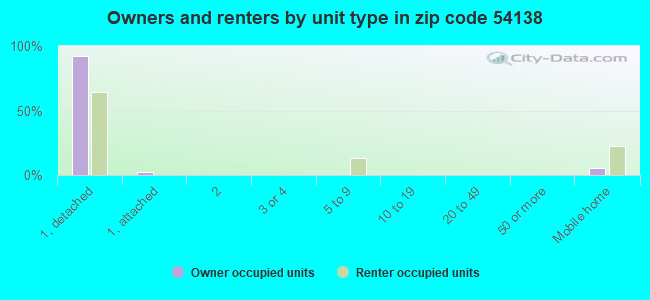
Houses and condos: 1,325 Renter-occupied apartments: 45
% of renters here:
11%
State:
32%
March 2022 cost of living index in zip code 54138: 87.6 (less than average, U.S. average is 100)
Land area: 72.9 sq. mi. Water area: 1.5 sq. mi.
Population density: 12 people per square mile
(very low).
OSM Map
General Map
Google Map
MSN Map
OSM Map
General Map
Google Map
MSN Map
OSM Map
General Map
Google Map
MSN Map
OSM Map
General Map
Google Map
MSN Map
Please wait while loading the map...
Real estate property taxes paid for housing units in 2022:
This zip code:
0.9% ($1,760)
Wisconsin:
1.4% ($3,497)
Median real estate property taxes paid for housing units with mortgages in 2022: $1,764 (0.9%) Median real estate property taxes paid for housing units with no mortgage in 2022: $1,735 (0.9%)
Averages for the 2020 tax year for zip code 54138, filed in 2021:
Average Adjusted Gross Income (AGI) in 2020: $63,563 (Individual Income Tax Returns)
Here:
$63,563
State:
$72,319
Salary/wage: $46,383 (reported on 59.2% of returns)
Here:
$46,383
State:
$59,242
(% of AGI for various income ranges: 950.0% for AGIs below $25k, 2230.0% for AGIs $25k-50k, 4324.0% for AGIs $50k-75k, 8005.0% for AGIs $75k-100k, 16982.5% for AGIs $100k-200k)
Taxable interest for individuals: $1,042 (reported on 53.1% of returns)
This zip code:
$1,042
Wisconsin:
$1,431
(% of AGI for various income ranges: 48.6% for AGIs below $25k, 52.0% for AGIs $25k-50k, 104.0% for AGIs $50k-75k, 195.0% for AGIs $75k-100k, 235.0% for AGIs $100k-200k)
Ordinary dividends: $4,262 (reported on 32.7% of returns)
Here:
$4,262
State:
$6,481
(% of AGI for various income ranges: 157.1% for AGIs below $25k, 40.0% for AGIs $25k-50k, 278.0% for AGIs $50k-75k, 982.5% for AGIs $100k-200k)
Net capital gain/loss in AGI: +$8,043 (reported on 28.6% of returns)
Here:
+$8,043
State:
+$18,329
(% of AGI for various income ranges: 41.4% for AGIs below $25k, 89.0% for AGIs $25k-50k, 390.0% for AGIs $50k-75k, 2032.5% for AGIs $100k-200k)
Profit/loss from business: +$8,100 (reported on 12.2% of returns)
Here:
+$8,100
State:
+$14,562
(% of AGI for various income ranges: 378.0% for AGIs $25k-50k, 216.0% for AGIs $50k-75k)
Taxable individual retirement arrangement distribution: $18,854 (reported on 26.5% of returns)
54138:
$18,854
Wisconsin:
$19,348
(% of AGI for various income ranges: 170.0% for AGIs below $25k, 427.0% for AGIs $25k-50k, 1096.0% for AGIs $50k-75k, 2590.0% for AGIs $75k-100k, 2097.5% for AGIs $100k-200k)
Total itemized deductions: $25,167 (reported on 6.1% of returns)
Here:
$25,167
State:
$33,000
(% of AGI for various income ranges: 755.0% for AGIs $25k-50k)
Taxes paid: $6,933 (reported on 6.1% of returns)
54138:
$6,933
State:
$8,228
(% of AGI for various income ranges: 208.0% for AGIs $25k-50k)
Earned income credit: $2,600 (reported on 8.2% of returns)
Here:
$2,600
State:
$2,155
(% of AGI for various income ranges: 148.6% for AGIs below $25k)
Percentage of individuals using paid preparers for their 2020 taxes: 89.8%
Here:
90%
State:
94%
(% for various income ranges: 91.7% for AGIs below $25k, 92.9% for AGIs $25k-50k, 87.5% for AGIs $50k-75k, 80.0% for AGIs $75k-100k, 90.0% for AGIs $100k-200k)
Averages for the 2012 tax year for zip code 54138, filed in 2013:
Average Adjusted Gross Income (AGI) in 2012: $43,198 (Individual Income Tax Returns)
Here:
$43,198
State:
$57,939
Salary/wage: $30,847 (reported on 68.1% of returns)
Here:
$30,847
State:
$48,248
(% of AGI for various income ranges: 55.2% for AGIs below $25k, 51.5% for AGIs $25k-50k, 51.5% for AGIs $50k-75k, 54.2% for AGIs $75k-100k, 37.1% for AGIs $100k-200k)
Taxable interest for individuals: $916 (reported on 53.2% of returns)
This zip code:
$916
Wisconsin:
$1,224
(% of AGI for various income ranges: 2.9% for AGIs below $25k, 1.4% for AGIs $25k-50k, 0.4% for AGIs $50k-75k, 0.5% for AGIs $75k-100k, 1.0% for AGIs $100k-200k)
Ordinary dividends: $2,257 (reported on 29.8% of returns)
Here:
$2,257
State:
$5,137
(% of AGI for various income ranges: 5.0% for AGIs below $25k, 2.2% for AGIs $25k-50k, 2.1% for AGIs $75k-100k)
Net capital gain/loss in AGI: +$382 (reported on 23.4% of returns)
Here:
+$382
State:
+$11,137
(% of AGI for various income ranges: 2.4% for AGIs $75k-100k)
Profit/loss from business: +$12,283 (reported on 12.8% of returns)
Here:
+$12,283
State:
+$11,943
Taxable individual retirement arrangement distribution: $13,667 (reported on 25.5% of returns)
54138:
$13,667
Wisconsin:
$14,087
(% of AGI for various income ranges: 8.1% for AGIs below $25k, 13.3% for AGIs $25k-50k, 19.6% for AGIs $75k-100k)
Total itemized deductions: $18,764 (25% of AGI, reported on 29.8% of returns)
Here:
$18,764
State:
$22,257
Here:
24.8% of AGI
State:
20.1% of AGI
(% of AGI for various income ranges: 18.0% for AGIs below $25k, 11.2% for AGIs $25k-50k, 11.2% for AGIs $50k-75k, 11.5% for AGIs $75k-100k, 14.2% for AGIs $100k-200k)
Charity contributions: $1,780 (reported on 21.3% of returns)
Here:
$1,780
State:
$3,370
(% of AGI for various income ranges: 0.9% for AGIs below $25k, 1.5% for AGIs $25k-50k, 2.0% for AGIs $75k-100k)
Taxes paid: $7,800 (reported on 29.8% of returns)
54138:
$7,800
State:
$10,731
(% of AGI for various income ranges: 4.2% for AGIs below $25k, 3.7% for AGIs $25k-50k, 3.9% for AGIs $50k-75k, 4.9% for AGIs $75k-100k, 8.6% for AGIs $100k-200k)
Earned income credit: $1,833 (reported on 12.8% of returns)
Here:
$1,833
State:
$2,094
(% of AGI for various income ranges: 4.3% for AGIs below $25k)
Percentage of individuals using paid preparers for their 2012 taxes: 68.1%
Here:
68%
State:
54%
(% for various income ranges: 57.1% for AGIs below $25k, 75.0% for AGIs $25k-50k, 66.7% for AGIs $50k-75k, 80.0% for AGIs $75k-100k, 100.0% for AGIs $100k-200k)
Averages for the 2004 tax year for zip code 54138, filed in 2005:
Average Adjusted Gross Income (AGI) in 2004: $35,383 (Individual Income Tax Returns)
Here:
$35,383
State:
$47,735
Salary/wage: $25,214 (reported on 69.9% of returns)
Here:
$25,214
State:
$41,540
(% of AGI for various income ranges: 105.1% for AGIs below $10k, 47.5% for AGIs $10k-25k, 54.1% for AGIs $25k-50k, 44.7% for AGIs $50k-75k, 55.8% for AGIs $75k-100k, 45.7% for AGIs over 100k)
Taxable interest for individuals: $1,445 (reported on 63.7% of returns)
This zip code:
$1,445
Wisconsin:
$1,420
(% of AGI for various income ranges: 5.1% for AGIs below $10k, 4.5% for AGIs $10k-25k, 2.8% for AGIs $25k-50k, 2.4% for AGIs $50k-75k, 0.3% for AGIs $75k-100k, 2.0% for AGIs over 100k)
Taxable dividends: $1,734 (reported on 31.5% of returns)
Here:
$1,734
State:
$2,869
(% of AGI for various income ranges: 2.4% for AGIs below $10k, 1.4% for AGIs $10k-25k, 1.8% for AGIs $25k-50k, 2.2% for AGIs $50k-75k, 1.0% for AGIs over 100k)
Net capital gain/loss: +$7,496 (reported on 26.9% of returns)
Here:
+$7,496
State:
+$9,569
(% of AGI for various income ranges: -4.5% for AGIs below $10k, 3.9% for AGIs $10k-25k, 5.0% for AGIs $25k-50k, 5.6% for AGIs $50k-75k, 12.8% for AGIs over 100k)
Profit/loss from business: +$7,651 (reported on 21.2% of returns)
Here:
+$7,651
State:
+$10,417
(% of AGI for various income ranges: 3.6% for AGIs below $10k, 4.7% for AGIs $10k-25k, 5.0% for AGIs $25k-50k, 8.2% for AGIs $50k-75k)
Total itemized deductions: $15,889 (27% of AGI, reported on 32.3% of returns)
Here:
$15,889
State:
$18,160
Here:
26.7% of AGI
State:
21.1% of AGI
(% of AGI for various income ranges: 12.2% for AGIs $10k-25k, 16.2% for AGIs $25k-50k, 14.9% for AGIs $50k-75k, 13.8% for AGIs $75k-100k, 15.6% for AGIs over 100k)
Charity contributions deductions: $1,623 (3% of AGI, reported on 29.1% of returns)
Here:
$1,623
State:
$2,711
Here:
2.7% of AGI
State:
3.0% of AGI
(% of AGI for various income ranges: 1.1% for AGIs $10k-25k, 0.9% for AGIs $25k-50k, 1.4% for AGIs $50k-75k, 1.4% for AGIs $75k-100k, 2.2% for AGIs over 100k)
Total tax: $4,394 (reported on 74.5% of returns)
54138:
$4,394
State:
$7,114
(% of AGI for various income ranges: 2.4% for AGIs below $10k, 4.3% for AGIs $10k-25k, 6.6% for AGIs $25k-50k, 10.3% for AGIs $50k-75k, 10.2% for AGIs $75k-100k, 15.7% for AGIs over 100k)
Earned income credit: $1,233 (reported on 12.0% of returns)
Here:
$1,233
State:
$1,544
Percentage of individuals using paid preparers for their 2004 taxes: 67.7%
Here:
68%
State:
57%
(% for various income ranges: 51.6% for AGIs below $10k, 67.5% for AGIs $10k-25k, 74.4% for AGIs $25k-50k, 70.3% for AGIs $50k-75k, 90.0% for AGIs $75k-100k, 71.4% for AGIs over 100k)
Household received Food Stamps/SNAP in the past 12 months: 28 Household did not receive Food Stamps/SNAP in the past 12 months: 393
Women who did not have a birth in the past 12 months: 136 (18 now married, 117 unmarried)
Housing units in zip code 54138 with a mortgage: 182 (17 second mortgage, 1 home equity loan, 9 both second mortgage and home equity loan) Median monthly owner costs for units with a mortgage: $1,022 Median monthly owner costs for units without a mortgage: $360
Residents with income below the poverty level in 2022:
This zip code:
17.2%
Whole state:
10.7%
Residents with income below 50% of the poverty level in 2022:
This zip code:
4.4%
Whole state:
5.7%
Median number of rooms in houses and condos:
Here:
5.5
State:
6.5
Median number of rooms in apartments:
Here:
5.5
State:
4.1
Notable locations in this zip code not listed on our city pages
Notable locations in zip code 54138: Lakewood State Fish Hatchery (A), Paul Bunyon Ski Area (B), Wheeler Lake Swimming Beach (C), Cathedral of Pines Area (D), Lakewood District Ranger Station (E), Lakewood Volunteer Fire Department (F). Display/hide their locations on the map
Lakes: Pine Ridge Lake (A), Sellin Lake (B), Waubee Lake (C), Wheeler Lake (D), Miriam Lake (E), Bear Lake (F), Binder Lake (G), Birch Lake (H). Display/hide their locations on the map
Creeks: Knowles Creek (A), Hay Creek (B), Forbes Creek (C), West Thunder Creek (D), East Thunder Creek (E), Battle Creek (F), Spring Creek (G), Snow Falls Creek (H). Display/hide their locations on the map
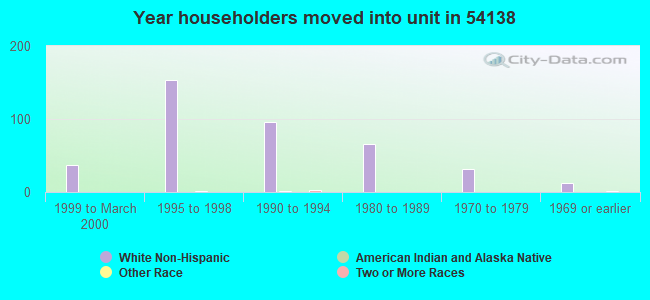
Size of family households: 195 2-persons, 30 3-persons, 16 4-persons, 9 5-persons
Size of nonfamily households: 151 1-person, 12 2-persons, 9 3-persons
30 married couples with children.
59 single-parent households (29 men, 30 women).
100.9% of residents of 54138 zip code speak English at home.
0.1% of residents speak other Indo-European language at home (100% very well).
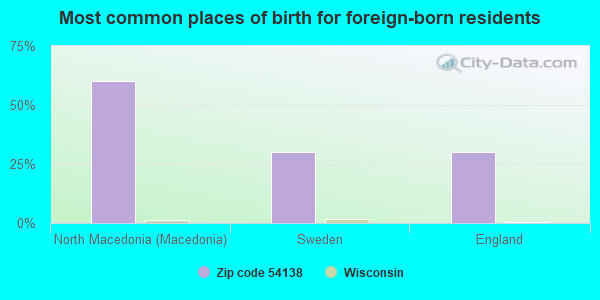
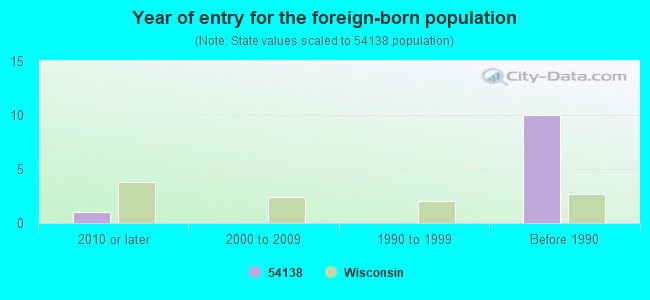
Foreign born population: 10 (1.3%) (100.0% of them are naturalized citizens)
This zip code:
1.3%
Whole state:
5.0%
60%North Macedonia (Macedonia)
30%Sweden
30%England
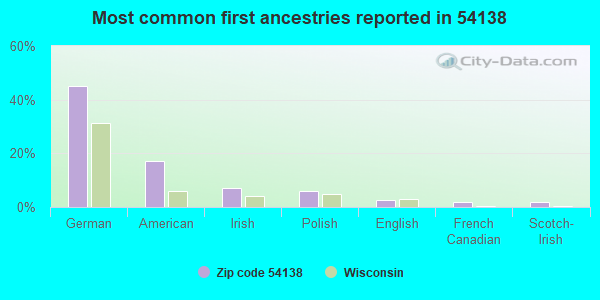
45%German
17%American
7%Irish
6%Polish
2%English
2%French Canadian
2%Scotch-Irish
Year of entry for the foreign-born population
12010 or later
02000 to 2009
01990 to 1999
10Before 1990
Housing units lacking complete plumbing facilities: 3.7% Housing units lacking complete kitchen facilities: 1.5%
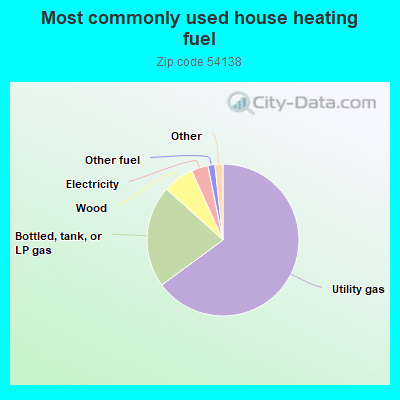
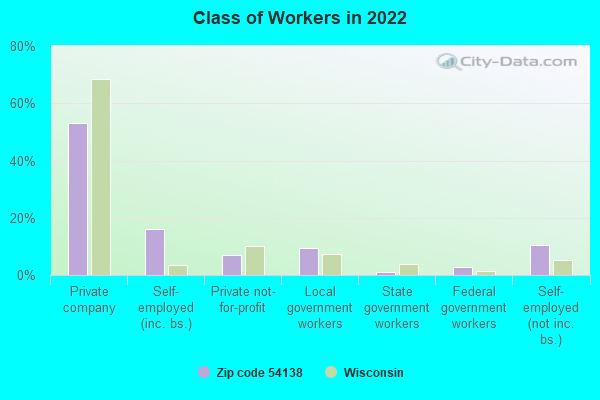
65.3%Utility gas
21.9%Bottled, tank, or LP gas
6.6%Wood
3.6%Electricity
1.5%Other fuel
1.0%Solar energy
0.7%No fuel used
Population in 1990: 626. Population change in the 1990s: +283 (+45.2%).
Place of birth for U.S.-born residents:
This state: 669
Northeast: 4
Midwest: 115
South: 22
West: 43
59% of the 54138 zip code residents lived in the same house 5 years ago. Out of people who lived in different houses, 43% lived in this county. Out of people who lived in different counties, 50% lived in Wisconsin.
90% of the 54138 zip code residents lived in the same house 1 year ago. Out of people who lived in different houses, 17% moved from this county. Out of people who lived in different houses, 51% moved from different county within same state. Out of people who lived in different houses, 36% moved from different state.
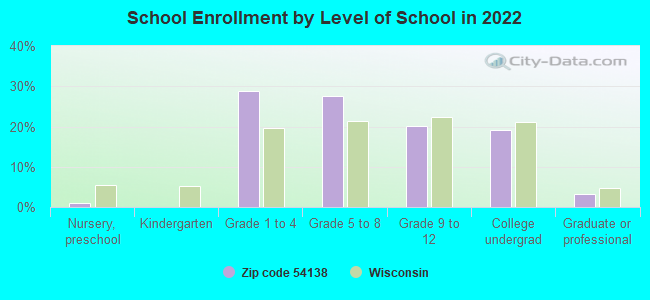
Private vs. public school enrollment:
Students in private schools in grades 1 to 8 (elementary and middle school):
Here:
0.0%
Wisconsin:
16.7%
Students in private schools in grades 9 to 12 (high school):
Here:
0.0%
Wisconsin:
12.5%
Students in private undergraduate colleges:
Here:
0.0%
Wisconsin:
17.5%
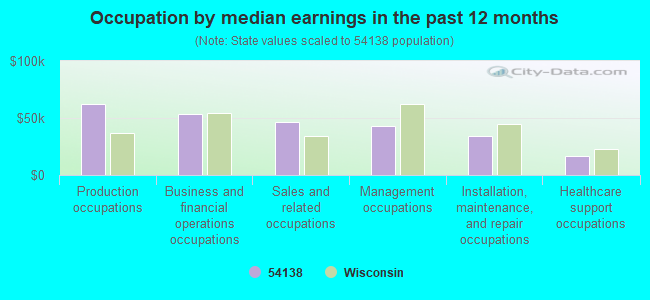
Occupation by median earnings in the past 12 months ($)
62,048Production occupations
53,410Business and financial operations occupations
46,424Sales and related occupations
42,933Management occupations
33,806Installation, maintenance, and repair occupations
16,747Healthcare support occupations
Top industries in this zip code by the number of employees in 2005:
Health Care and Social Assistance: Offices of Physicians (except Mental Health Specialists) (20-49 employees: 1 establishment)
Accommodation and Food Services: Hotels (except Casino Hotels) and Motels (10-19: 1)
Construction: Plumbing, Heating, and Air-Conditioning Contractors (5-9: 1, 1-4: 1)
Accommodation and Food Services: Full-Service Restaurants (5-9: 1, 1-4: 1)
Professional, Scientific, and Technical Services: Other Accounting Services (5-9: 1)
Real Estate and Rental and Leasing: Other Commercial and Industrial Machinery and Equipment Rental and Leasing (5-9: 1)
Fatal accident statistics in 2010:
Fatal accident count: 1
Vehicles involved in fatal accidents: 1
Fatal accidents caused by drunken drivers: 1
Fatalities: 1
Persons involved in fatal accidents: 2
Pedestrians involved in fatal accidents: 0
Home Mortgage Disclosure Act Aggregated Statistics For Year 2009 (Based on 2 partial tracts)
A) FHA, FSA/RHS & VA Home Purchase Loans
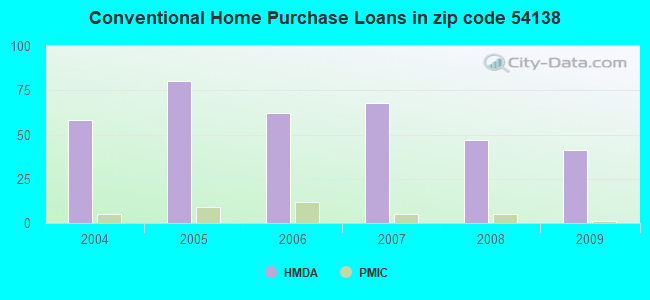
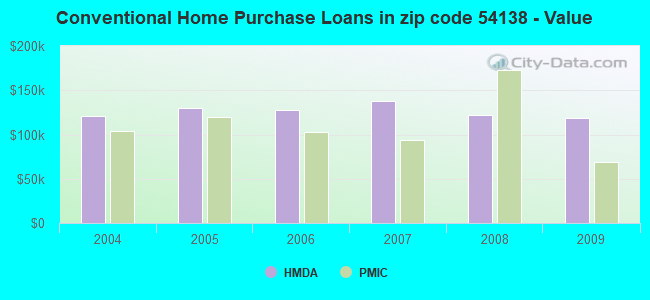
B) Conventional Home Purchase Loans
C) Refinancings
D) Home Improvement Loans
F) Non-occupant Loans on < 5 Family Dwellings (A B C & D)
G) Loans On Manufactured Home Dwelling (A B C & D)
Number
Average Value
Number
Average Value
Number
Average Value
Number
Average Value
Number
Average Value
Number
Average Value
LOANS ORIGINATED
2
$103,680
41
$118,928
179
$130,895
16
$59,808
131
$147,421
12
$73,792
APPLICATIONS APPROVED, NOT ACCEPTED
0
$0
2
$239,230
7
$162,267
1
$7,680
5
$229,940
1
$76,800
APPLICATIONS DENIED
2
$37,630
3
$241,920
31
$128,652
4
$58,175
17
$152,109
4
$70,465
APPLICATIONS WITHDRAWN
0
$0
7
$98,523
28
$137,033
0
$0
18
$142,208
1
$63,740
FILES CLOSED FOR INCOMPLETENESS
0
$0
0
$0
6
$116,608
0
$0
3
$114,943
0
$0
Aggregated Statistics For Year 2008 (Based on 2 partial tracts)
A) FHA, FSA/RHS & VA Home Purchase Loans
B) Conventional Home Purchase Loans
C) Refinancings
D) Home Improvement Loans
E) Loans on Dwellings For 5+ Families
F) Non-occupant Loans on < 5 Family Dwellings (A B C & D)
G) Loans On Manufactured Home Dwelling (A B C & D)
Number
Average Value
Number
Average Value
Number
Average Value
Number
Average Value
Number
Average Value
Number
Average Value
Number
Average Value
LOANS ORIGINATED
2
$107,905
47
$121,851
137
$128,323
14
$44,544
1
$454,660
104
$146,289
21
$65,938
APPLICATIONS APPROVED, NOT ACCEPTED
0
$0
2
$102,530
18
$145,664
2
$85,250
0
$0
15
$142,233
2
$86,015
APPLICATIONS DENIED
3
$89,857
6
$129,792
35
$126,457
7
$46,957
0
$0
16
$102,432
10
$93,926
APPLICATIONS WITHDRAWN
0
$0
2
$109,825
17
$136,116
0
$0
0
$0
9
$135,509
0
$0
FILES CLOSED FOR INCOMPLETENESS
0
$0
2
$83,330
2
$86,785
0
$0
0
$0
0
$0
2
$65,665
Aggregated Statistics For Year 2007 (Based on 2 partial tracts)
A) FHA, FSA/RHS & VA Home Purchase Loans
B) Conventional Home Purchase Loans
C) Refinancings
D) Home Improvement Loans
F) Non-occupant Loans on < 5 Family Dwellings (A B C & D)
G) Loans On Manufactured Home Dwelling (A B C & D)
Number
Average Value
Number
Average Value
Number
Average Value
Number
Average Value
Number
Average Value
Number
Average Value
LOANS ORIGINATED
3
$58,623
68
$137,687
113
$121,167
19
$56,994
94
$141,410
11
$74,077
APPLICATIONS APPROVED, NOT ACCEPTED
0
$0
4
$96,768
12
$138,240
1
$38,400
8
$131,040
1
$93,700
APPLICATIONS DENIED
0
$0
10
$153,523
38
$135,875
6
$45,697
12
$147,264
3
$80,127
APPLICATIONS WITHDRAWN
1
$35,330
3
$131,583
18
$98,048
0
$0
7
$127,927
1
$73,730
FILES CLOSED FOR INCOMPLETENESS
0
$0
1
$96,770
2
$99,840
1
$49,920
0
$0
0
$0
Aggregated Statistics For Year 2006 (Based on 2 partial tracts)
A) FHA, FSA/RHS & VA Home Purchase Loans
B) Conventional Home Purchase Loans
C) Refinancings
D) Home Improvement Loans
F) Non-occupant Loans on < 5 Family Dwellings (A B C & D)
G) Loans On Manufactured Home Dwelling (A B C & D)
Number
Average Value
Number
Average Value
Number
Average Value
Number
Average Value
Number
Average Value
Number
Average Value
LOANS ORIGINATED
2
$76,030
62
$127,290
116
$113,849
25
$51,302
90
$132,966
18
$68,651
APPLICATIONS APPROVED, NOT ACCEPTED
0
$0
7
$107,740
18
$119,168
1
$1,540
8
$134,112
5
$103,526
APPLICATIONS DENIED
1
$53,760
15
$116,583
32
$116,616
8
$49,440
24
$111,232
7
$77,787
APPLICATIONS WITHDRAWN
0
$0
5
$125,030
16
$151,824
2
$104,065
7
$126,610
2
$83,330
FILES CLOSED FOR INCOMPLETENESS
0
$0
2
$54,530
9
$138,581
0
$0
2
$155,135
1
$102,910
Aggregated Statistics For Year 2005 (Based on 2 partial tracts)
A) FHA, FSA/RHS & VA Home Purchase Loans
B) Conventional Home Purchase Loans
C) Refinancings
D) Home Improvement Loans
F) Non-occupant Loans on < 5 Family Dwellings (A B C & D)
G) Loans On Manufactured Home Dwelling (A B C & D)
Number
Average Value
Number
Average Value
Number
Average Value
Number
Average Value
Number
Average Value
Number
Average Value
LOANS ORIGINATED
0
$0
80
$130,483
131
$94,740
16
$77,664
111
$133,016
16
$62,784
APPLICATIONS APPROVED, NOT ACCEPTED
0
$0
4
$98,305
15
$86,937
0
$0
5
$149,146
2
$46,465
APPLICATIONS DENIED
0
$0
8
$86,688
37
$112,377
9
$31,488
7
$130,231
3
$99,840
APPLICATIONS WITHDRAWN
1
$86,020
3
$102,143
14
$132,754
0
$0
5
$163,892
1
$99,840
FILES CLOSED FOR INCOMPLETENESS
0
$0
1
$76,800
12
$143,104
1
$30,720
4
$77,760
2
$72,960
Aggregated Statistics For Year 2004 (Based on 2 partial tracts)
A) FHA, FSA/RHS & VA Home Purchase Loans
B) Conventional Home Purchase Loans
C) Refinancings
D) Home Improvement Loans
F) Non-occupant Loans on < 5 Family Dwellings (A B C & D)
G) Loans On Manufactured Home Dwelling (A B C & D)


 Nearest zip codes: 54149, 54104, 54566, 54175, 54125, 54174.