Estimated zip code population in 2022: 8,011 Zip code population in 2010: 5,451 Zip code population in 2000: 4,204
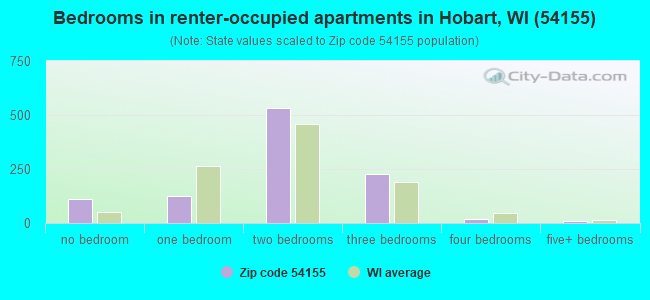
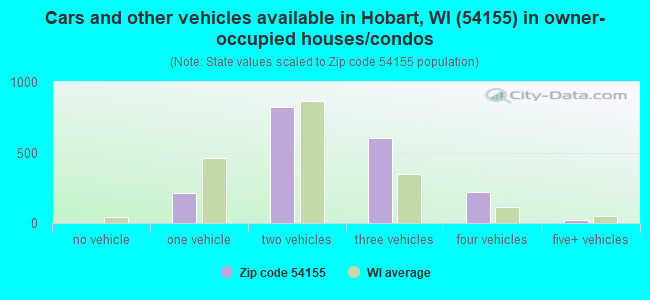
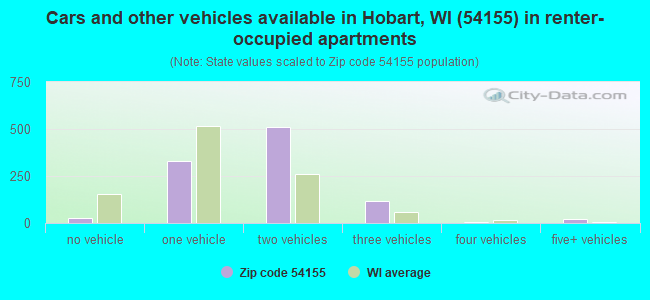
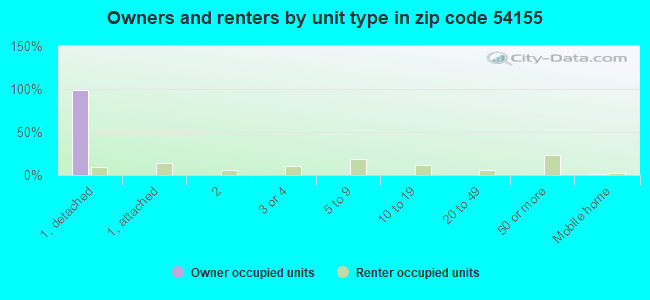
Houses and condos: 3,092 Renter-occupied apartments: 1,025
% of renters here:
35%
State:
32%
March 2022 cost of living index in zip code 54155: 87.9 (less than average, U.S. average is 100)
Land area: 34.4 sq. mi. Water area: 0.1 sq. mi.
Population density: 233 people per square mile
(very low).
OSM Map
General Map
Google Map
MSN Map
OSM Map
General Map
Google Map
MSN Map
OSM Map
General Map
Google Map
MSN Map
OSM Map
General Map
Google Map
MSN Map
Please wait while loading the map...
Real estate property taxes paid for housing units in 2022:
This zip code:
1.3% ($4,295)
Wisconsin:
1.4% ($3,497)
Median real estate property taxes paid for housing units with mortgages in 2022: $4,309 (1.2%) Median real estate property taxes paid for housing units with no mortgage in 2022: $4,257 (1.4%)
Business Search- 14 Million verified businesses
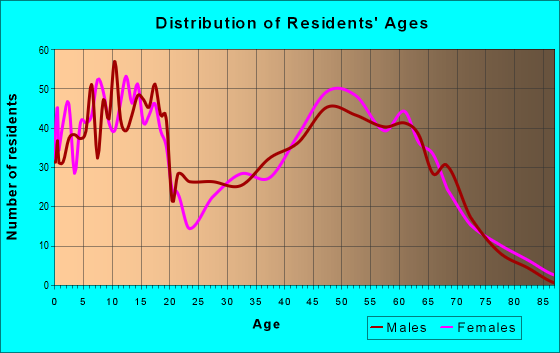
Males: 3,932
(49.1%)
Females: 4,078
(50.9%)
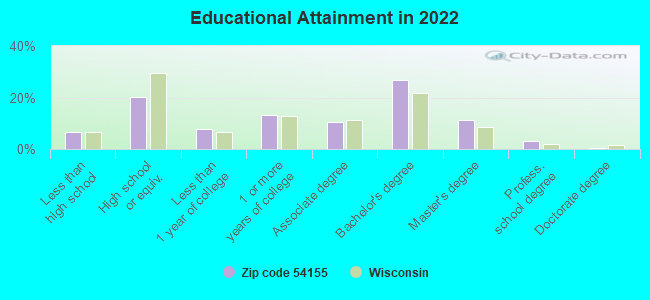
For population 25 years and over in 54155:
High school or higher: 93.5%
Bachelor's degree or higher: 41.5%
Graduate or professional degree: 14.8%
Unemployed: 1.3%
Mean travel time to work (commute): 20.4 minutes
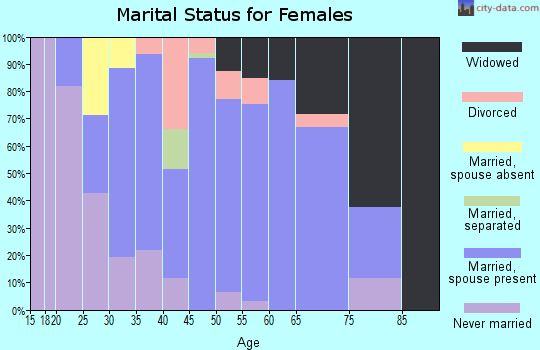
For population 15 years and over in 54155:
Never married: 30.6%
Now married: 54.8%
Separated: 0.6%
Widowed: 1.2%
Divorced: 12.9%
Zip code 54155 compared to state average:
Unemployed percentage below state average.
Black race population percentage significantly below state average.
Foreign-born population percentage significantly below state average.
Length of stay since moving in significantly above state average.
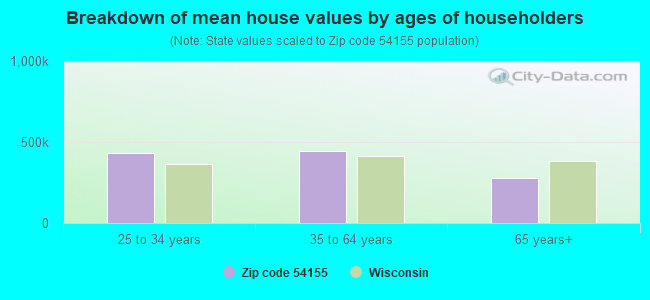
Estimated median house/condo value in 2022: $332,879
54155:
$332,879
Wisconsin:
$252,800
According to our research of Wisconsin and other state lists, there were 17 registered sex offenders living in 54155 zip code as of April 24, 2024. The ratio of all residents to sex offenders in zip code 54155 is 403 to 1. The ratio of registered sex offenders to all residents in this zip code is near the state average.
Median resident age:
This zip code:
36.5 years
Wisconsin median age:
40.4 years
Average household size:
This zip code:
2.7 people
Wisconsin:
2.3 people
Averages for the 2020 tax year for zip code 54155, filed in 2021:
Average Adjusted Gross Income (AGI) in 2020: $98,539 (Individual Income Tax Returns)
Here:
$98,539
State:
$72,319
Salary/wage: $69,881 (reported on 84.0% of returns)
Here:
$69,881
State:
$59,242
(% of AGI for various income ranges: 1176.5% for AGIs below $25k, 3430.9% for AGIs $25k-50k, 6239.5% for AGIs $50k-75k, 8860.0% for AGIs $75k-100k, 15991.4% for AGIs $100k-200k, 86729.0% for AGIs over 200k)
Taxable interest for individuals: $2,062 (reported on 40.7% of returns)
This zip code:
$2,062
Wisconsin:
$1,431
(% of AGI for various income ranges: 21.5% for AGIs below $25k, 18.8% for AGIs $25k-50k, 41.0% for AGIs $50k-75k, 55.0% for AGIs $75k-100k, 126.8% for AGIs $100k-200k, 2209.0% for AGIs over 200k)
Ordinary dividends: $8,670 (reported on 24.9% of returns)
Here:
$8,670
State:
$6,481
(% of AGI for various income ranges: 36.5% for AGIs below $25k, 39.1% for AGIs $25k-50k, 109.8% for AGIs $50k-75k, 173.1% for AGIs $75k-100k, 582.7% for AGIs $100k-200k, 4855.0% for AGIs over 200k)
Net capital gain/loss in AGI: +$34,996 (reported on 23.2% of returns)
Here:
+$34,996
State:
+$18,329
(% of AGI for various income ranges: 10.8% for AGIs below $25k, 36.5% for AGIs $25k-50k, 69.8% for AGIs $50k-75k, 214.6% for AGIs $75k-100k, 817.8% for AGIs $100k-200k, 27604.0% for AGIs over 200k)
Profit/loss from business: +$19,627 (reported on 12.2% of returns)
Here:
+$19,627
State:
+$14,562
(% of AGI for various income ranges: 57.4% for AGIs below $25k, 119.7% for AGIs $25k-50k, 266.4% for AGIs $50k-75k, 189.6% for AGIs $75k-100k, 527.3% for AGIs $100k-200k, 4499.0% for AGIs over 200k)
Taxable individual retirement arrangement distribution: $22,561 (reported on 13.7% of returns)
54155:
$22,561
Wisconsin:
$19,348
(% of AGI for various income ranges: 94.3% for AGIs below $25k, 147.2% for AGIs $25k-50k, 390.5% for AGIs $50k-75k, 693.1% for AGIs $75k-100k, 1152.4% for AGIs $100k-200k, 2631.0% for AGIs over 200k)
Self-employed (Keogh) retirement plans: $25,825 (reported on 1.0% of returns)
54155:
$25,825
Wisconsin:
$21,322
(% of AGI for various income ranges: 1033.0% for AGIs over 200k)
Total itemized deductions: $32,813 (reported on 7.6% of returns)
Here:
$32,813
State:
$33,000
(% of AGI for various income ranges: 109.1% for AGIs below $25k, 208.6% for AGIs $50k-75k, 410.8% for AGIs $75k-100k, 610.8% for AGIs $100k-200k, 4833.0% for AGIs over 200k)
Charity contributions: $11,817 (reported on 5.9% of returns)
Here:
$11,817
State:
$12,044
(% of AGI for various income ranges: 16.8% for AGIs $25k-50k, 60.4% for AGIs $75k-100k, 130.0% for AGIs $100k-200k, 1949.0% for AGIs over 200k)
Taxes paid: $8,697 (reported on 7.4% of returns)
54155:
$8,697
State:
$8,228
(% of AGI for various income ranges: 13.8% for AGIs below $25k, 47.4% for AGIs $50k-75k, 115.0% for AGIs $75k-100k, 211.6% for AGIs $100k-200k, 1139.0% for AGIs over 200k)
Earned income credit: $1,998 (reported on 11.7% of returns)
Here:
$1,998
State:
$2,155
(% of AGI for various income ranges: 68.2% for AGIs below $25k, 53.1% for AGIs $25k-50k)
Percentage of individuals using paid preparers for their 2020 taxes: 96.7%
Here:
97%
State:
94%
(% for various income ranges: 95.1% for AGIs below $25k, 97.9% for AGIs $25k-50k, 96.6% for AGIs $50k-75k, 97.4% for AGIs $75k-100k, 96.9% for AGIs $100k-200k, 96.9% for AGIs over 200k)
Averages for the 2012 tax year for zip code 54155, filed in 2013:
Average Adjusted Gross Income (AGI) in 2012: $91,352 (Individual Income Tax Returns)
Here:
$91,352
State:
$57,939
Salary/wage: $68,618 (reported on 86.0% of returns)
Here:
$68,618
State:
$48,248
(% of AGI for various income ranges: 75.4% for AGIs below $25k, 80.3% for AGIs $25k-50k, 72.8% for AGIs $50k-75k, 73.2% for AGIs $75k-100k, 70.9% for AGIs $100k-200k, 55.4% for AGIs over 200k)
Taxable interest for individuals: $2,580 (reported on 42.3% of returns)
This zip code:
$2,580
Wisconsin:
$1,224
(% of AGI for various income ranges: 0.8% for AGIs below $25k, 0.8% for AGIs $25k-50k, 0.5% for AGIs $50k-75k, 0.7% for AGIs $75k-100k, 1.3% for AGIs $100k-200k, 1.5% for AGIs over 200k)
Ordinary dividends: $6,410 (reported on 27.3% of returns)
Here:
$6,410
State:
$5,137
(% of AGI for various income ranges: 2.0% for AGIs below $25k, 0.9% for AGIs $25k-50k, 1.0% for AGIs $50k-75k, 1.1% for AGIs $75k-100k, 2.5% for AGIs $100k-200k, 2.2% for AGIs over 200k)
Net capital gain/loss in AGI: +$30,935 (reported on 21.0% of returns)
Here:
+$30,935
State:
+$11,137
(% of AGI for various income ranges: 0.2% for AGIs $25k-50k, 0.4% for AGIs $50k-75k, 0.3% for AGIs $75k-100k, 2.1% for AGIs $100k-200k, 13.3% for AGIs over 200k)
Profit/loss from business: +$15,394 (reported on 12.2% of returns)
Here:
+$15,394
State:
+$11,943
(% of AGI for various income ranges: 1.5% for AGIs below $25k, 0.9% for AGIs $25k-50k, 2.8% for AGIs $50k-75k, 1.2% for AGIs $75k-100k, 3.7% for AGIs $100k-200k, 1.8% for AGIs over 200k)
Taxable individual retirement arrangement distribution: $20,767 (reported on 11.5% of returns)
54155:
$20,767
Wisconsin:
$14,087
(% of AGI for various income ranges: 3.6% for AGIs below $25k, 3.6% for AGIs $25k-50k, 4.4% for AGIs $50k-75k, 4.6% for AGIs $75k-100k, 4.3% for AGIs $100k-200k, 1.0% for AGIs over 200k)
Self-employment retirement plans: $28,300 (reported on 1.0% of returns)
54155:
$28,300
Wisconsin:
$17,048
Total itemized deductions: $34,140 (17% of AGI, reported on 36.4% of returns)
Here:
$34,140
State:
$22,257
Here:
17.3% of AGI
State:
20.1% of AGI
(% of AGI for various income ranges: 7.1% for AGIs below $25k, 9.1% for AGIs $25k-50k, 13.5% for AGIs $50k-75k, 12.9% for AGIs $75k-100k, 17.8% for AGIs $100k-200k, 13.6% for AGIs over 200k)
Charity contributions: $4,231 (reported on 30.4% of returns)
Here:
$4,231
State:
$3,370
(% of AGI for various income ranges: 0.4% for AGIs below $25k, 0.7% for AGIs $25k-50k, 1.2% for AGIs $50k-75k, 1.3% for AGIs $75k-100k, 2.0% for AGIs $100k-200k, 1.5% for AGIs over 200k)
Taxes paid: $17,789 (reported on 36.0% of returns)
54155:
$17,789
State:
$10,731
(% of AGI for various income ranges: 1.7% for AGIs below $25k, 2.9% for AGIs $25k-50k, 5.3% for AGIs $50k-75k, 6.1% for AGIs $75k-100k, 9.1% for AGIs $100k-200k, 8.0% for AGIs over 200k)
Earned income credit: $2,218 (reported on 15.4% of returns)
Here:
$2,218
State:
$2,094
(% of AGI for various income ranges: 6.1% for AGIs below $25k, 1.0% for AGIs $25k-50k)
Percentage of individuals using paid preparers for their 2012 taxes: 62.2%
Here:
62%
State:
54%
(% for various income ranges: 54.9% for AGIs below $25k, 60.7% for AGIs $25k-50k, 68.4% for AGIs $50k-75k, 62.5% for AGIs $75k-100k, 67.6% for AGIs $100k-200k, 84.2% for AGIs over 200k)
Averages for the 2004 tax year for zip code 54155, filed in 2005:
Average Adjusted Gross Income (AGI) in 2004: $73,670 (Individual Income Tax Returns)
Here:
$73,670
State:
$47,735
Salary/wage: $59,611 (reported on 89.3% of returns)
Here:
$59,611
State:
$41,540
(% of AGI for various income ranges: 175.0% for AGIs below $10k, 77.7% for AGIs $10k-25k, 84.8% for AGIs $25k-50k, 78.6% for AGIs $50k-75k, 80.6% for AGIs $75k-100k, 65.7% for AGIs over 100k)
Taxable interest for individuals: $1,986 (reported on 52.1% of returns)
This zip code:
$1,986
Wisconsin:
$1,420
(% of AGI for various income ranges: 5.4% for AGIs below $10k, 2.1% for AGIs $10k-25k, 0.7% for AGIs $25k-50k, 1.4% for AGIs $50k-75k, 1.1% for AGIs $75k-100k, 1.5% for AGIs over 100k)
Taxable dividends: $2,935 (reported on 32.8% of returns)
Here:
$2,935
State:
$2,869
(% of AGI for various income ranges: 7.3% for AGIs below $10k, 1.6% for AGIs $10k-25k, 0.9% for AGIs $25k-50k, 1.1% for AGIs $50k-75k, 1.5% for AGIs $75k-100k, 1.3% for AGIs over 100k)
Net capital gain/loss: +$14,822 (reported on 27.9% of returns)
Here:
+$14,822
State:
+$9,569
(% of AGI for various income ranges: 34.2% for AGIs below $10k, 0.4% for AGIs $10k-25k, 0.5% for AGIs $25k-50k, 0.8% for AGIs $50k-75k, 2.0% for AGIs $75k-100k, 8.1% for AGIs over 100k)
Profit/loss from business: +$15,749 (reported on 12.9% of returns)
Here:
+$15,749
State:
+$10,417
(% of AGI for various income ranges: 1.1% for AGIs below $10k, -2.2% for AGIs $10k-25k, 1.2% for AGIs $25k-50k, 3.8% for AGIs $50k-75k, 1.8% for AGIs $75k-100k, 3.4% for AGIs over 100k)
IRA payment deduction: $3,262 (reported on 2.4% of returns)
54155:
$3,262
Wisconsin:
$2,900
Self-employed pension: $17,886 (reported on 1.4% of returns)
Here:
$17,886
Wisconsin:
$11,934
Total itemized deductions: $26,918 (18% of AGI, reported on 40.2% of returns)
Here:
$26,918
State:
$18,160
Here:
18.4% of AGI
State:
21.1% of AGI
(% of AGI for various income ranges: 9.5% for AGIs $10k-25k, 11.5% for AGIs $25k-50k, 16.8% for AGIs $50k-75k, 18.4% for AGIs $75k-100k, 14.7% for AGIs over 100k)
Charity contributions deductions: $3,643 (2% of AGI, reported on 36.7% of returns)
Here:
$3,643
State:
$2,711
Here:
2.4% of AGI
State:
3.0% of AGI
(% of AGI for various income ranges: 0.9% for AGIs $10k-25k, 0.8% for AGIs $25k-50k, 1.7% for AGIs $50k-75k, 1.9% for AGIs $75k-100k, 2.1% for AGIs over 100k)
Total tax: $16,022 (reported on 76.0% of returns)
54155:
$16,022
State:
$7,114
(% of AGI for various income ranges: 3.9% for AGIs below $10k, 3.9% for AGIs $10k-25k, 6.1% for AGIs $25k-50k, 8.5% for AGIs $50k-75k, 9.6% for AGIs $75k-100k, 22.2% for AGIs over 100k)
Earned income credit: $1,650 (reported on 13.4% of returns)
Here:
$1,650
State:
$1,544
Percentage of individuals using paid preparers for their 2004 taxes: 63.6%
Here:
64%
State:
57%
(% for various income ranges: 51.7% for AGIs below $10k, 60.8% for AGIs $10k-25k, 67.3% for AGIs $25k-50k, 66.0% for AGIs $50k-75k, 66.3% for AGIs $75k-100k, 72.9% for AGIs over 100k)
Likely homosexual households (counted as self-reported same-sex unmarried-partner households)
Lesbian couples: 0.6% of all households
Gay men: 0.0% of all households
Household received Food Stamps/SNAP in the past 12 months: 192 Household did not receive Food Stamps/SNAP in the past 12 months: 2,714
Women who had a birth in the past 12 months: 32 (19 now married, 12 unmarried) Women who did not have a birth in the past 12 months: 1,720 (650 now married, 1,069 unmarried)
Housing units in zip code 54155 with a mortgage: 1,133 (76 second mortgage, 61 both second mortgage and home equity loan) Houses without a mortgage: 6
Median monthly owner costs for units with a mortgage: $1,794 Median monthly owner costs for units without a mortgage: $616
Residents with income below the poverty level in 2022:
This zip code:
5.5%
Whole state:
10.7%
Residents with income below 50% of the poverty level in 2022:
This zip code:
1.6%
Whole state:
5.7%
Median number of rooms in houses and condos:
Here:
7.1
State:
6.5
Median number of rooms in apartments:
Here:
4.2
State:
4.1
Notable locations in this zip code not listed on our city pages
Notable locations in zip code 54155: Oneida Apple Orchard (A), Oneida Township Volunteer Fire Department (B), Hobart Volunteer Fire Department Station 1 (C), Hobart Volunteer Fire Department Station 2 (D), Mayflower Greenhouse (E). Display/hide their locations on the map
In group quarters: 38 (-1 institutionalized population)
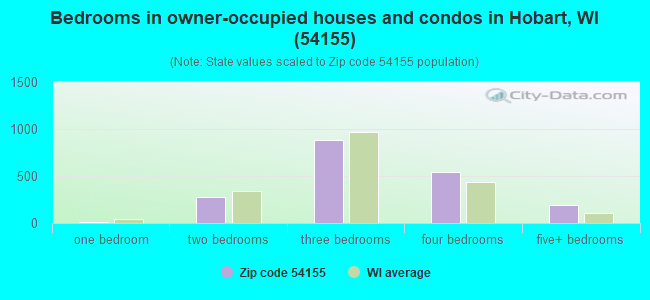
Size of family households: 977 2-persons, 390 3-persons, 193 4-persons, 467 5-persons, 101 6-persons, 2 7-or-more-persons
Size of nonfamily households: 477 1-person, 303 2-persons
1,087 married couples with children.
606 single-parent households (299 men, 307 women).
96.2% of residents of 54155 zip code speak English at home.
1.0% of residents speak Spanish at home (99% very well, 1% well).
1.0% of residents speak Asian or Pacific Island language at home (100% very well).
1.2% of residents speak other language at home (100% very well).
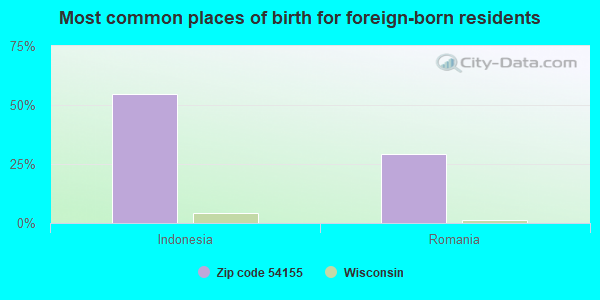
Foreign born population: 110 (1.4%) (100.0% of them are naturalized citizens)
This zip code:
1.4%
Whole state:
5.0%
55%Indonesia
29%Romania
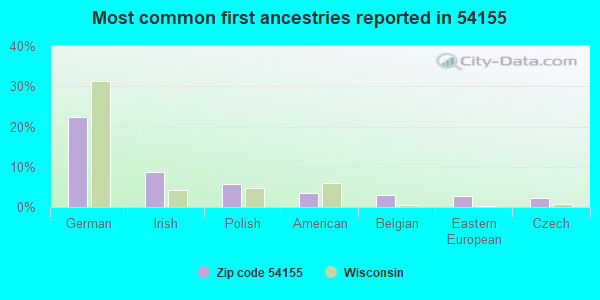
22%German
9%Irish
6%Polish
4%American
3%Belgian
3%Eastern European
2%Czech
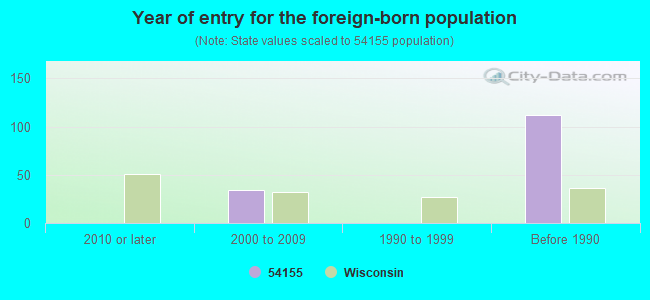
Year of entry for the foreign-born population
02010 or later
342000 to 2009
01990 to 1999
112Before 1990
Facilities with environmental interests located in this zip code:
BIX SERV COMPANY (1127 HILL DRIVE in ONEIDA, WI) . Tribal Land
Conditionally Exempt Small Quantity Generators, less than 100 kg/month of hazardous waste (Resource Conservation and Recovery Act (tracking hazardous waste)) - notification STATE MASTER (Wisconsin database) - RCRAINFO-WID988623070, CESQG Organizations: EVERSON LISA (CONTACT/OWNER)
BIRDS EYE FOODS (3680 W MASON ST in ONEIDA, WI)
Conditionally Exempt Small Quantity Generators, less than 100 kg/month of hazardous waste (Resource Conservation and Recovery Act (tracking hazardous waste)) Business NAICS classification: CROP HARVESTING, PRIMARILY BY MACHINE.; FRUIT AND VEGETABLE CANNING. Organizations: DEAN FOODS VEGETABLE CO (CONTACT/OWNER)
BROWN COUNTY GOLF COURSE (897 RIVERDALE DRIVE in ONEIDA, WI) . Federal Facility. UNDETERMINED OR UNKNOWN AGENCY AFFILIATION. Tribal Land
Small Quantity Generators, between 100 kg and 1000 kg of hazardous waste/month (Resource Conservation and Recovery Act (tracking hazardous waste)) - notification Organizations: BROWN COUNTY GOVERNMENT (CONTACT/OWNER)
Housing units lacking complete plumbing facilities: 0.3%
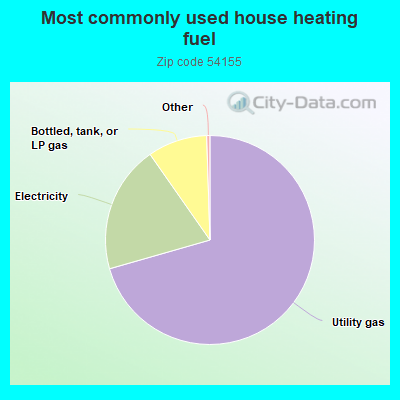
70.5%Utility gas
19.7%Electricity
9.2%Bottled, tank, or LP gas
Population in 1990: 3,674. Population change in the 1990s: +530 (+14.4%).
Place of birth for U.S.-born residents:
This state: 6,284
Northeast: 90
Midwest: 789
South: 167
West: 533
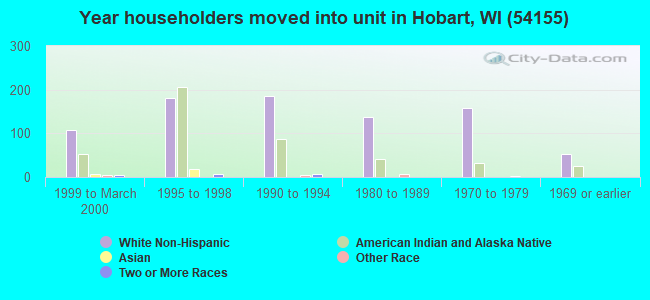
66% of the 54155 zip code residents lived in the same house 5 years ago. Out of people who lived in different houses, 56% lived in this county. Out of people who lived in different counties, 50% lived in Wisconsin.
90% of the 54155 zip code residents lived in the same house 1 year ago. Out of people who lived in different houses, 50% moved from this county. Out of people who lived in different houses, 20% moved from different county within same state. Out of people who lived in different houses, 30% moved from different state.
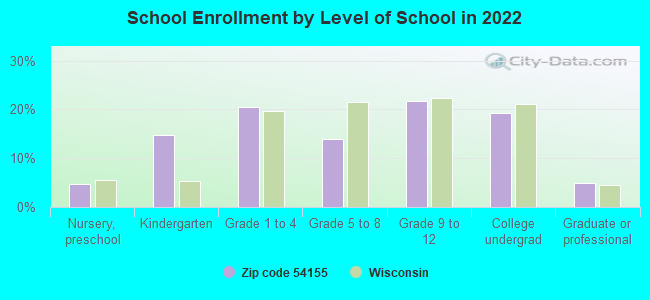
Private vs. public school enrollment:
Students in private schools in grades 1 to 8 (elementary and middle school): 155
Here:
22.3%
Wisconsin:
16.7%
Students in private schools in grades 9 to 12 (high school): 143
Here:
32.5%
Wisconsin:
12.5%
Students in private undergraduate colleges: 100
Here:
26.3%
Wisconsin:
17.5%
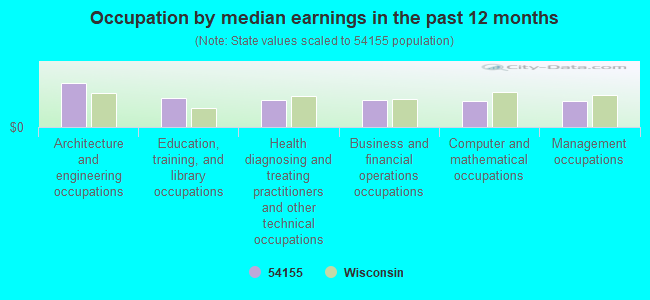
Occupation by median earnings in the past 12 months ($)
111,390Architecture and engineering occupations
74,551Education, training, and library occupations
67,959Health diagnosing and treating practitioners and other technical occupations
67,702Business and financial operations occupations
66,884Computer and mathematical occupations
65,222Management occupations
Companies with federal contracts located in this zip code:
CLEAR STREAM CO , INC (878 PINE HILL DR in ONEIDA, WI; small business) : $7,546 in 2 contractsin 2005
$4,222 with Air Force for Floor Polishers and Vacuum Cleaning Equipment. Taking place in NJ. Signed on 2005-09-30. Completion date: 2005-11-30.
$3,324 with Army for Miscellaneous Aircraft Accessories and Components. Signed on 2005-09-21. Completion date: 2005-10-13.
Top industries in this zip code by the number of employees in 2005:
Detailed PMIC statistics for the following Tracts:0130.00
, 0204.00
2004 - 2018 National Fire Incident Reporting System (NFIRS) incidents
According to the data from the years 2004 - 2018 the average number of fires per year is 20. The highest number of reported fires - 31 took place in 2008, and the least - 0 in 2005. The data has a rising trend.
When looking into fire subcategories, the most incidents belonged to: Structure Fires (49.2%), and Outside Fires (31.2%).
Fire incident types reported to NFIRS in Zip Code 54155


 Nearest zip codes: 54313, 54165, 54304, 54303, 54162, 54115.


 . Tribal Land
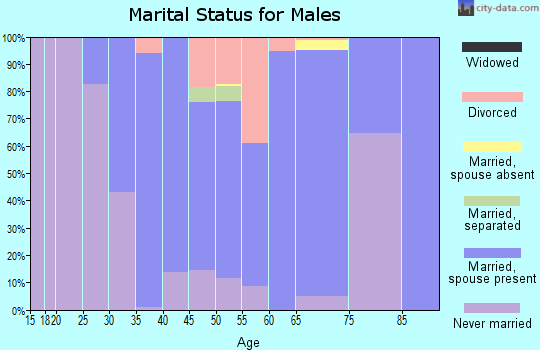
 According to the data from the years 2004 - 2018 the average number of fires per year is 20. The highest number of reported fires - 31 took place in 2008, and the least - 0 in 2005. The data has a rising trend.
 When looking into fire subcategories, the most incidents belonged to: Structure Fires (49.2%), and Outside Fires (31.2%).