Estimated zip code population in 2022: 1,367 Zip code population in 2010: 1,434 Zip code population in 2000: 1,257
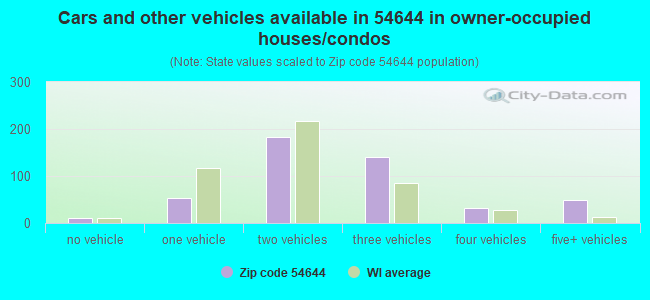
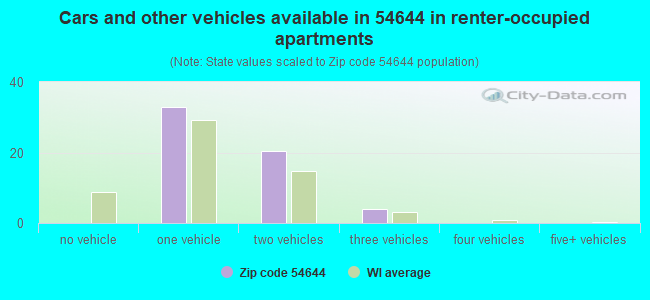
Houses and condos: 566 Renter-occupied apartments: 57
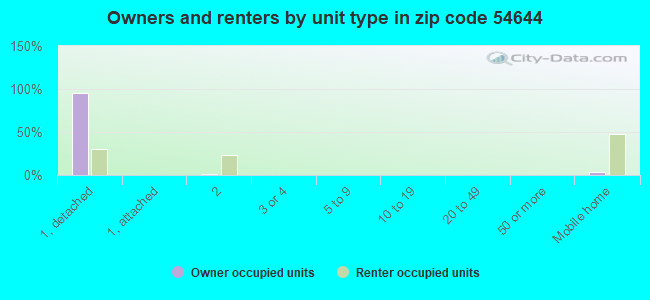
% of renters here:
11%
State:
32%
March 2022 cost of living index in zip code 54644: 86.9 (less than average, U.S. average is 100)
Land area: 62.7 sq. mi. Water area: 0.5 sq. mi.
Population density: 22 people per square mile
(very low).
OSM Map
General Map
Google Map
MSN Map
OSM Map
General Map
Google Map
MSN Map
OSM Map
General Map
Google Map
MSN Map
OSM Map
General Map
Google Map
MSN Map
Please wait while loading the map...
Real estate property taxes paid for housing units in 2022:
This zip code:
1.2% ($3,395)
Wisconsin:
1.4% ($3,497)
Median real estate property taxes paid for housing units with mortgages in 2022: $3,315 (1.2%) Median real estate property taxes paid for housing units with no mortgage in 2022: $3,546 (1.4%)
Business Search- 14 Million verified businesses
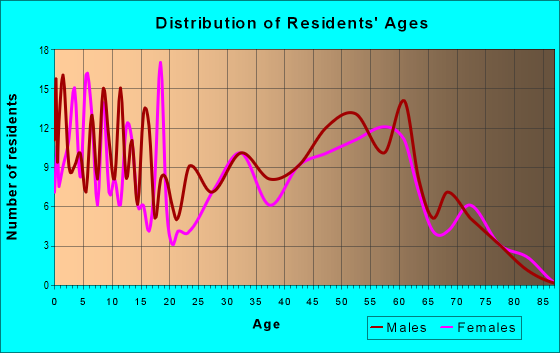
Males: 772
(56.5%)
Females: 595
(43.5%)
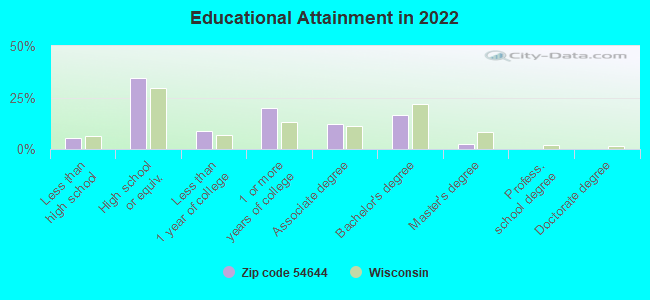
For population 25 years and over in 54644:
High school or higher: 93.1%
Bachelor's degree or higher: 19.0%
Graduate or professional degree: 2.8%
Unemployed: 3.1%
Mean travel time to work (commute): 33.1 minutes
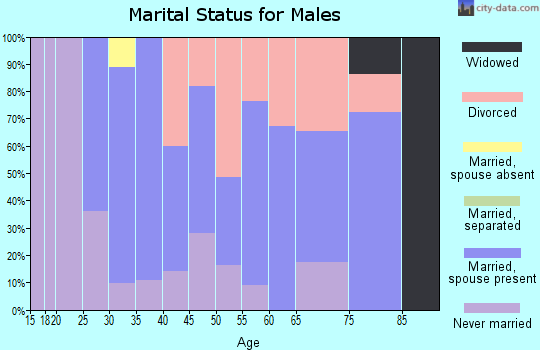
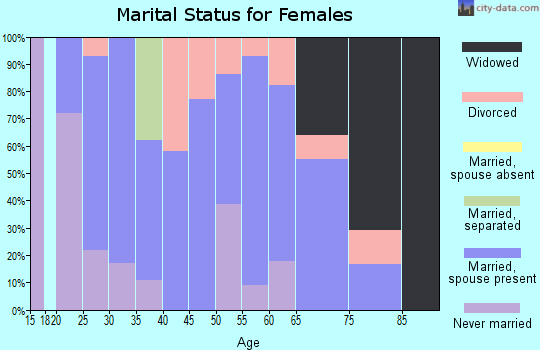
For population 15 years and over in 54644:
Never married: 26.0%
Now married: 59.6%
Separated: 0.4%
Widowed: 6.3%
Divorced: 7.6%
Zip code 54644 compared to state average:
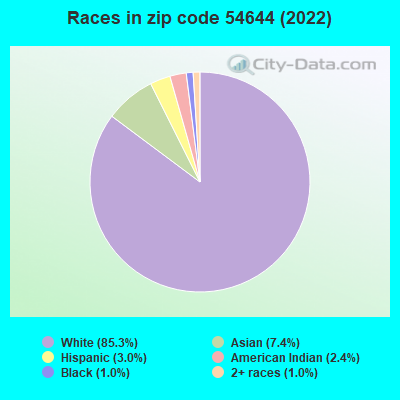
Black race population percentage significantly below state average.
Hispanic race population percentage below state average.
Median age above state average.
Foreign-born population percentage below state average.
Renting percentage significantly below state average.
Length of stay since moving in above state average.
Number of college students below state average.
Percentage of population with a bachelor's degree or higher below state average.
Averages for the 2020 tax year for zip code 54644, filed in 2021:
Average Adjusted Gross Income (AGI) in 2020: $64,274 (Individual Income Tax Returns)
Here:
$64,274
State:
$72,319
Salary/wage: $54,614 (reported on 80.8% of returns)
Here:
$54,614
State:
$59,242
(% of AGI for various income ranges: 1152.9% for AGIs below $25k, 3664.2% for AGIs $25k-50k, 7240.0% for AGIs $50k-75k, 7778.3% for AGIs $75k-100k, 20595.0% for AGIs $100k-200k)
Taxable interest for individuals: $840 (reported on 47.9% of returns)
This zip code:
$840
Wisconsin:
$1,431
(% of AGI for various income ranges: 34.3% for AGIs below $25k, 15.8% for AGIs $25k-50k, 144.3% for AGIs $50k-75k, 55.0% for AGIs $75k-100k, 116.3% for AGIs $100k-200k)
Ordinary dividends: $2,014 (reported on 19.2% of returns)
Here:
$2,014
State:
$6,481
(% of AGI for various income ranges: 20.7% for AGIs below $25k, 40.8% for AGIs $25k-50k, 128.6% for AGIs $50k-75k, 70.0% for AGIs $75k-100k, 90.0% for AGIs $100k-200k)
Net capital gain/loss in AGI: +$13,907 (reported on 20.5% of returns)
Here:
+$13,907
State:
+$18,329
(% of AGI for various income ranges: 39.3% for AGIs below $25k, 49.2% for AGIs $25k-50k, 631.4% for AGIs $50k-75k, 1912.5% for AGIs $100k-200k)
Profit/loss from business: +$11,182 (reported on 15.1% of returns)
Here:
+$11,182
State:
+$14,562
(% of AGI for various income ranges: 258.6% for AGIs below $25k, 714.3% for AGIs $50k-75k, 460.0% for AGIs $100k-200k)
Taxable individual retirement arrangement distribution: $13,314 (reported on 9.6% of returns)
54644:
$13,314
Wisconsin:
$19,348
(% of AGI for various income ranges: 113.6% for AGIs below $25k, 196.7% for AGIs $25k-50k, 895.0% for AGIs $75k-100k)
Total itemized deductions: $25,500 (reported on 4.1% of returns)
Here:
$25,500
State:
$33,000
(% of AGI for various income ranges: 1275.0% for AGIs $75k-100k)
Taxes paid: $9,133 (reported on 4.1% of returns)
54644:
$9,133
State:
$8,228
(% of AGI for various income ranges: 456.7% for AGIs $75k-100k)
Earned income credit: $2,311 (reported on 12.3% of returns)
Here:
$2,311
State:
$2,155
(% of AGI for various income ranges: 82.9% for AGIs below $25k, 76.7% for AGIs $25k-50k)
Percentage of individuals using paid preparers for their 2020 taxes: 91.8%
Here:
92%
State:
94%
(% for various income ranges: 86.4% for AGIs below $25k, 93.8% for AGIs $25k-50k, 91.7% for AGIs $50k-75k, 100.0% for AGIs $75k-100k, 93.3% for AGIs $100k-200k)
Averages for the 2012 tax year for zip code 54644, filed in 2013:
Average Adjusted Gross Income (AGI) in 2012: $48,009 (Individual Income Tax Returns)
Here:
$48,009
State:
$57,939
Salary/wage: $42,095 (reported on 83.8% of returns)
Here:
$42,095
State:
$48,248
(% of AGI for various income ranges: 66.3% for AGIs below $25k, 81.4% for AGIs $25k-50k, 78.1% for AGIs $50k-75k, 75.8% for AGIs $75k-100k, 64.3% for AGIs $100k-200k)
Taxable interest for individuals: $635 (reported on 50.0% of returns)
This zip code:
$635
Wisconsin:
$1,224
(% of AGI for various income ranges: 1.7% for AGIs below $25k, 0.4% for AGIs $25k-50k, 0.8% for AGIs $50k-75k, 0.7% for AGIs $75k-100k, 0.3% for AGIs $100k-200k)
Ordinary dividends: $1,354 (reported on 19.1% of returns)
Here:
$1,354
State:
$5,137
(% of AGI for various income ranges: 1.2% for AGIs below $25k, 0.6% for AGIs $25k-50k, 0.8% for AGIs $50k-75k, 0.6% for AGIs $75k-100k)
Net capital gain/loss in AGI: +$2,330 (reported on 14.7% of returns)
Here:
+$2,330
State:
+$11,137
(% of AGI for various income ranges: 0.3% for AGIs below $25k, 2.7% for AGIs $25k-50k, 0.8% for AGIs $75k-100k)
Profit/loss from business: +$5,800 (reported on 14.7% of returns)
Here:
+$5,800
State:
+$11,943
(% of AGI for various income ranges: 10.3% for AGIs below $25k, 3.3% for AGIs $25k-50k, 1.2% for AGIs $75k-100k)
Taxable individual retirement arrangement distribution: $10,214 (reported on 10.3% of returns)
54644:
$10,214
Wisconsin:
$14,087
Total itemized deductions: $17,355 (24% of AGI, reported on 32.4% of returns)
Here:
$17,355
State:
$22,257
Here:
24.2% of AGI
State:
20.1% of AGI
(% of AGI for various income ranges: 15.9% for AGIs $25k-50k, 12.0% for AGIs $50k-75k, 11.0% for AGIs $75k-100k, 12.6% for AGIs $100k-200k)
Charity contributions: $1,256 (reported on 23.5% of returns)
Here:
$1,256
State:
$3,370
(% of AGI for various income ranges: 0.5% for AGIs $25k-50k, 0.8% for AGIs $50k-75k, 0.7% for AGIs $75k-100k, 0.7% for AGIs $100k-200k)
Taxes paid: $6,723 (reported on 32.4% of returns)
54644:
$6,723
State:
$10,731
(% of AGI for various income ranges: 4.6% for AGIs $25k-50k, 4.3% for AGIs $50k-75k, 4.5% for AGIs $75k-100k, 6.1% for AGIs $100k-200k)
Earned income credit: $1,989 (reported on 13.2% of returns)
Here:
$1,989
State:
$2,094
(% of AGI for various income ranges: 4.1% for AGIs below $25k, 1.0% for AGIs $25k-50k)
Percentage of individuals using paid preparers for their 2012 taxes: 67.6%
Here:
68%
State:
54%
(% for various income ranges: 65.2% for AGIs below $25k, 66.7% for AGIs $25k-50k, 61.5% for AGIs $50k-75k, 75.0% for AGIs $75k-100k, 83.3% for AGIs $100k-200k)
Averages for the 2004 tax year for zip code 54644, filed in 2005:
Average Adjusted Gross Income (AGI) in 2004: $38,877 (Individual Income Tax Returns)
Here:
$38,877
State:
$47,735
Salary/wage: $35,123 (reported on 85.5% of returns)
Here:
$35,123
State:
$41,540
(% of AGI for various income ranges: 151.1% for AGIs below $10k, 75.0% for AGIs $10k-25k, 79.1% for AGIs $25k-50k, 86.4% for AGIs $50k-75k, 80.9% for AGIs $75k-100k, 51.8% for AGIs over 100k)
Taxable interest for individuals: $800 (reported on 62.7% of returns)
This zip code:
$800
Wisconsin:
$1,420
(% of AGI for various income ranges: 11.7% for AGIs below $10k, 3.0% for AGIs $10k-25k, 1.4% for AGIs $25k-50k, 0.5% for AGIs $50k-75k, 0.9% for AGIs $75k-100k, 1.1% for AGIs over 100k)
Taxable dividends: $683 (reported on 22.1% of returns)
Here:
$683
State:
$2,869
(% of AGI for various income ranges: 0.8% for AGIs below $10k, 1.1% for AGIs $10k-25k, 0.4% for AGIs $25k-50k, 0.2% for AGIs $50k-75k, 0.0% for AGIs $75k-100k, 0.6% for AGIs over 100k)
Net capital gain/loss: +$4,656 (reported on 18.6% of returns)
Here:
+$4,656
State:
+$9,569
(% of AGI for various income ranges: 2.4% for AGIs below $10k, 1.0% for AGIs $10k-25k, 2.9% for AGIs $25k-50k, 0.9% for AGIs $50k-75k, 3.6% for AGIs $75k-100k, 2.9% for AGIs over 100k)
Profit/loss from business: +$6,520 (reported on 18.8% of returns)
Here:
+$6,520
State:
+$10,417
(% of AGI for various income ranges: 15.5% for AGIs below $10k, 9.9% for AGIs $10k-25k, 3.4% for AGIs $25k-50k, 3.9% for AGIs $50k-75k, -0.5% for AGIs $75k-100k)
IRA payment deduction: $2,182 (reported on 3.4% of returns)
54644:
$2,182
Wisconsin:
$2,900
Total itemized deductions: $15,482 (23% of AGI, reported on 29.4% of returns)
Here:
$15,482
State:
$18,160
Here:
22.8% of AGI
State:
21.1% of AGI
(% of AGI for various income ranges: 9.7% for AGIs $10k-25k, 10.3% for AGIs $25k-50k, 13.5% for AGIs $50k-75k, 13.8% for AGIs $75k-100k, 11.0% for AGIs over 100k)
Charity contributions deductions: $1,304 (2% of AGI, reported on 24.1% of returns)
Here:
$1,304
State:
$2,711
Here:
1.9% of AGI
State:
3.0% of AGI
(% of AGI for various income ranges: 0.4% for AGIs $10k-25k, 0.5% for AGIs $25k-50k, 0.8% for AGIs $50k-75k, 1.2% for AGIs $75k-100k, 1.2% for AGIs over 100k)
Total tax: $4,776 (reported on 77.4% of returns)
54644:
$4,776
State:
$7,114
(% of AGI for various income ranges: 7.1% for AGIs below $10k, 4.9% for AGIs $10k-25k, 6.5% for AGIs $25k-50k, 7.8% for AGIs $50k-75k, 10.5% for AGIs $75k-100k, 18.5% for AGIs over 100k)
Earned income credit: $1,386 (reported on 12.7% of returns)
Here:
$1,386
State:
$1,544
Percentage of individuals using paid preparers for their 2004 taxes: 66.2%
Here:
66%
State:
57%
(% for various income ranges: 56.8% for AGIs below $10k, 63.8% for AGIs $10k-25k, 71.3% for AGIs $25k-50k, 63.9% for AGIs $50k-75k, 77.6% for AGIs $75k-100k, 80.8% for AGIs over 100k)
Household received Food Stamps/SNAP in the past 12 months: 21 Household did not receive Food Stamps/SNAP in the past 12 months: 505
Women who had a birth in the past 12 months: 17 (10 now married, 6 unmarried) Women who did not have a birth in the past 12 months: 220 (105 now married, 114 unmarried)
Housing units in zip code 54644 with a mortgage: 300 (49 second mortgage, 29 both second mortgage and home equity loan) Median monthly owner costs for units with a mortgage: $1,700 Median monthly owner costs for units without a mortgage: $680
Residents with income below the poverty level in 2022:
This zip code:
8.2%
Whole state:
10.7%
Residents with income below 50% of the poverty level in 2022:
This zip code:
5.6%
Whole state:
5.7%
Median number of rooms in houses and condos:
Here:
6.4
State:
6.5
Median number of rooms in apartments:
Here:
4.9
State:
4.1
Notable locations in this zip code not listed on our city pages
Size of family households: 193 2-persons, 93 3-persons, 52 4-persons, 21 5-persons, 7 6-persons, 19 7-or-more-persons
Size of nonfamily households: 134 1-person, 6 2-persons
255 married couples with children.
24 single-parent households (19 men, 5 women).
96.9% of residents of 54644 zip code speak English at home.
2.9% of residents speak Asian or Pacific Island language at home (100% very well).
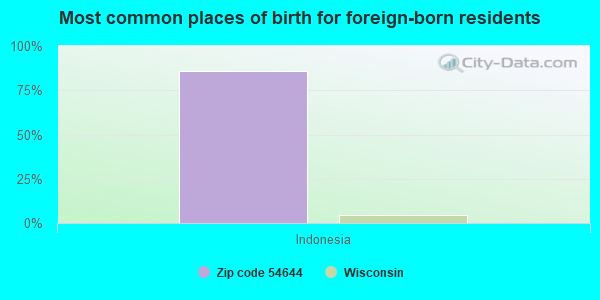
Foreign born population: 36 (2.7%) (100.0% of them are naturalized citizens)
This zip code:
2.7%
Whole state:
5.0%
86%Indonesia
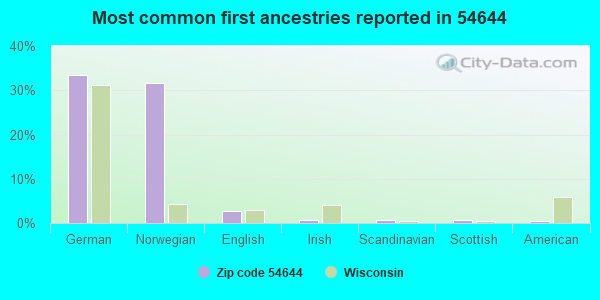
33%German
32%Norwegian
3%English
1%Irish
1%Scandinavian
1%Scottish
0%American
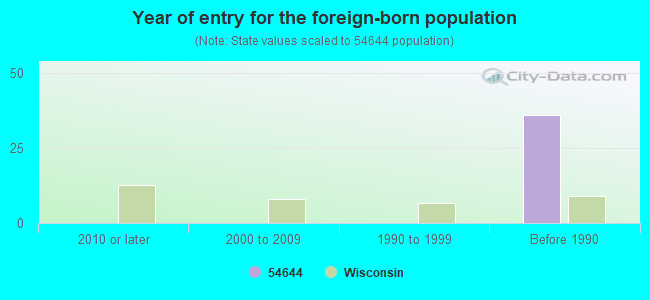
Year of entry for the foreign-born population
02010 or later
02000 to 2009
01990 to 1999
36Before 1990
Facilities with environmental interests located in this zip code:
BURR OAK LUTHERAN SCH (N9113 CO. RD C in MINDORO, WI)
COMPLIANCE ACTIVITY (Tracking inspections of insecticide, fungicide, and rodenticide, and toxic substances)
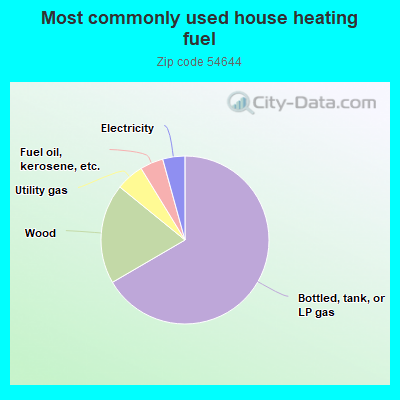
67.0%Bottled, tank, or LP gas
19.4%Wood
5.4%Utility gas
4.5%Fuel oil, kerosene, etc.
4.3%Electricity
Population in 1990: 1,157. Population change in the 1990s: +100 (+8.6%).
Place of birth for U.S.-born residents:
This state: 1,098
Northeast: 8
Midwest: 167
South: 10
West: 43
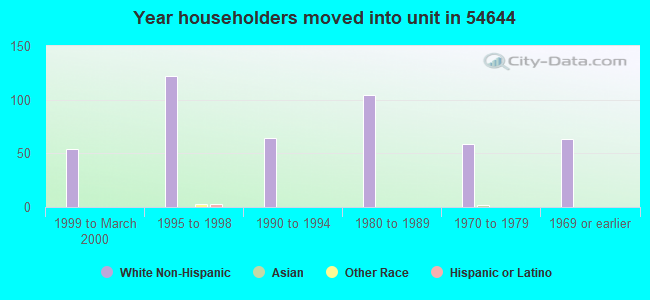
67% of the 54644 zip code residents lived in the same house 5 years ago. Out of people who lived in different houses, 64% lived in this county. Out of people who lived in different counties, 50% lived in Wisconsin.
94% of the 54644 zip code residents lived in the same house 1 year ago. Out of people who lived in different houses, 37% moved from this county. Out of people who lived in different houses, 42% moved from different county within same state. Out of people who lived in different houses, 24% moved from different state.
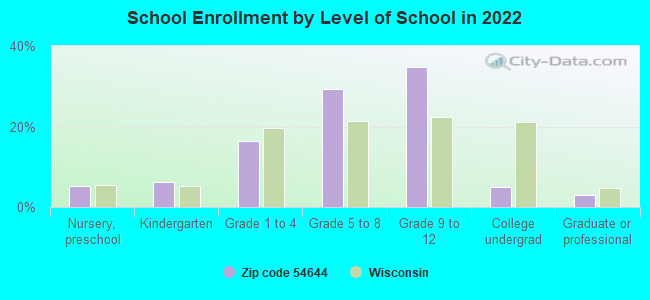
Private vs. public school enrollment:
Students in private schools in grades 1 to 8 (elementary and middle school): 8
Here:
5.2%
Wisconsin:
16.7%
Students in private schools in grades 9 to 12 (high school): 1
Here:
1.0%
Wisconsin:
12.5%
Students in private undergraduate colleges:
Here:
0.0%
Wisconsin:
17.5%
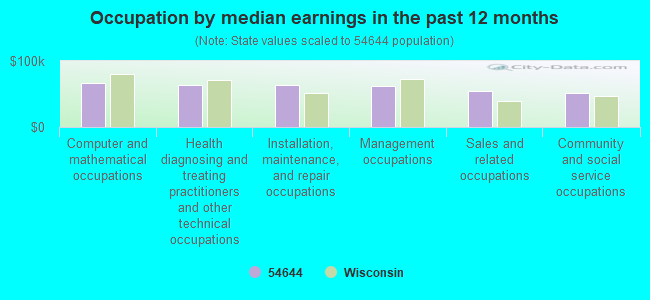
Occupation by median earnings in the past 12 months ($)
66,738Computer and mathematical occupations
63,376Health diagnosing and treating practitioners and other technical occupations
63,373Installation, maintenance, and repair occupations
62,111Management occupations
53,903Sales and related occupations
51,848Community and social service occupations
Companies with federal contracts located in this zip code:
ADVANCED HYDROSEEDING LLC (W 3278 COUNTY RD DE in MINDORO, WI; small business) : $33,130 in 3 contractsfrom 2003 to 2004
$24,930 with Army for Landscaping/Groundskeeping Services. Taking place in MI. Signed on 2004-09-30. Completion date: 2005-07-15.
$7,200 with Army for Landscaping/Groundskeeping Services. Signed on 2003-11-13. Completion date: 2004-05-30.
$1,000, same as above.Signed on 2004-07-29. Completion date: 2004-07-08.
Top industries in this zip code by the number of employees in 2005:
Other Services (except Public Administration): Religious Organizations (5-9 employees: 2 establishments, 1-4 employees: 1 establishment)
Finance and Insurance: Commercial Banking (10-19: 1)
Accommodation and Food Services: Recreational and Vacation Camps (except Campgrounds) (5-9: 1)
Accommodation and Food Services: Caterers (5-9: 1)
Accommodation and Food Services: Drinking Places (Alcoholic Beverages) (5-9: 1)
Construction: All Other Specialty Trade Contractors (1-4: 2)
Fatal accident statistics in 2011:
Fatal accident count: 2
Vehicles involved in fatal accidents: 3
Fatal accidents caused by drunken drivers: 1
Fatalities: 4
Persons involved in fatal accidents: 6
Pedestrians involved in fatal accidents: 0
Fatal accident statistics in 2010:
Fatal accident count: 1
Vehicles involved in fatal accidents: 2
Fatal accidents caused by drunken drivers: 0
Fatalities: 1
Persons involved in fatal accidents: 2
Pedestrians involved in fatal accidents: 0
Home Mortgage Disclosure Act Aggregated Statistics For Year 2009 (Based on 2 partial tracts)
A) FHA, FSA/RHS & VA Home Purchase Loans
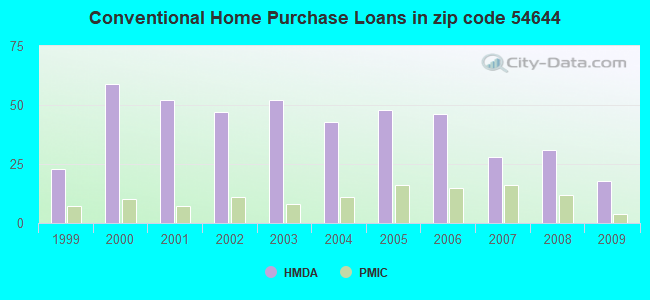
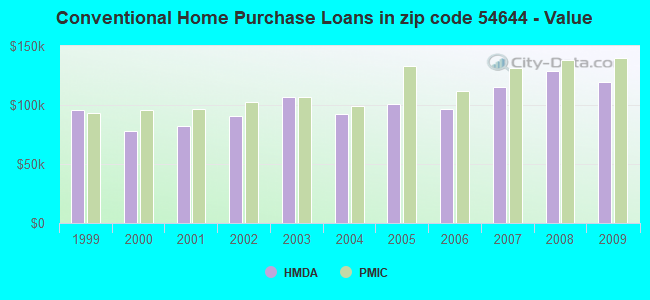
B) Conventional Home Purchase Loans
C) Refinancings
D) Home Improvement Loans
F) Non-occupant Loans on < 5 Family Dwellings (A B C & D)
G) Loans On Manufactured Home Dwelling (A B C & D)
Number
Average Value
Number
Average Value
Number
Average Value
Number
Average Value
Number
Average Value
Number
Average Value
LOANS ORIGINATED
7
$139,379
18
$119,837
198
$124,609
25
$40,582
16
$100,586
7
$56,329
APPLICATIONS APPROVED, NOT ACCEPTED
1
$43,400
1
$380,090
5
$125,100
1
$29,930
0
$0
0
$0
APPLICATIONS DENIED
3
$120,460
7
$126,231
40
$140,269
4
$52,935
1
$33,670
1
$7,480
APPLICATIONS WITHDRAWN
1
$174,330
3
$115,720
34
$142,708
1
$18,700
1
$44,890
0
$0
FILES CLOSED FOR INCOMPLETENESS
1
$119,710
0
$0
4
$162,360
0
$0
0
$0
0
$0
Aggregated Statistics For Year 2008 (Based on 2 partial tracts)
A) FHA, FSA/RHS & VA Home Purchase Loans
B) Conventional Home Purchase Loans
C) Refinancings
D) Home Improvement Loans
F) Non-occupant Loans on < 5 Family Dwellings (A B C & D)
G) Loans On Manufactured Home Dwelling (A B C & D)
Number
Average Value
Number
Average Value
Number
Average Value
Number
Average Value
Number
Average Value
Number
Average Value
LOANS ORIGINATED
10
$122,331
31
$129,173
152
$102,828
24
$34,854
13
$113,381
7
$32,814
APPLICATIONS APPROVED, NOT ACCEPTED
1
$182,560
2
$131,685
12
$210,119
3
$37,910
0
$0
1
$37,410
APPLICATIONS DENIED
4
$149,080
7
$110,413
49
$125,194
7
$105,069
0
$0
4
$70,330
APPLICATIONS WITHDRAWN
1
$83,050
4
$160,490
21
$151,315
1
$129,440
0
$0
1
$97,270
FILES CLOSED FOR INCOMPLETENESS
0
$0
0
$0
10
$124,426
0
$0
0
$0
0
$0
Aggregated Statistics For Year 2007 (Based on 2 partial tracts)
A) FHA, FSA/RHS & VA Home Purchase Loans
B) Conventional Home Purchase Loans
C) Refinancings
D) Home Improvement Loans
F) Non-occupant Loans on < 5 Family Dwellings (A B C & D)
G) Loans On Manufactured Home Dwelling (A B C & D)
Number
Average Value
Number
Average Value
Number
Average Value
Number
Average Value
Number
Average Value
Number
Average Value
LOANS ORIGINATED
6
$131,060
28
$115,089
109
$97,698
19
$51,941
11
$123,249
10
$34,716
APPLICATIONS APPROVED, NOT ACCEPTED
0
$0
1
$100,260
12
$128,628
6
$62,973
0
$0
0
$0
APPLICATIONS DENIED
1
$54,620
9
$110,900
57
$129,531
10
$67,188
1
$114,470
1
$67,340
APPLICATIONS WITHDRAWN
1
$163,110
5
$114,474
18
$116,013
1
$48,630
1
$70,330
1
$35,910
FILES CLOSED FOR INCOMPLETENESS
0
$0
0
$0
4
$175,640
0
$0
0
$0
0
$0
Aggregated Statistics For Year 2006 (Based on 2 partial tracts)
A) FHA, FSA/RHS & VA Home Purchase Loans
B) Conventional Home Purchase Loans
C) Refinancings
D) Home Improvement Loans
F) Non-occupant Loans on < 5 Family Dwellings (A B C & D)
G) Loans On Manufactured Home Dwelling (A B C & D)
Number
Average Value
Number
Average Value
Number
Average Value
Number
Average Value
Number
Average Value
Number
Average Value
LOANS ORIGINATED
6
$128,940
46
$96,924
103
$113,443
31
$22,977
12
$103,812
4
$23,755
APPLICATIONS APPROVED, NOT ACCEPTED
0
$0
4
$76,318
12
$121,832
2
$28,055
1
$150,390
1
$89,780
APPLICATIONS DENIED
0
$0
7
$103,251
64
$110,699
8
$32,454
1
$121,210
1
$138,420
APPLICATIONS WITHDRAWN
0
$0
10
$92,552
38
$119,948
3
$75,070
1
$209,500
1
$71,080
FILES CLOSED FOR INCOMPLETENESS
0
$0
1
$308,260
12
$128,004
1
$7,480
0
$0
0
$0
Aggregated Statistics For Year 2005 (Based on 2 partial tracts)
A) FHA, FSA/RHS & VA Home Purchase Loans
B) Conventional Home Purchase Loans
C) Refinancings
D) Home Improvement Loans
F) Non-occupant Loans on < 5 Family Dwellings (A B C & D)
G) Loans On Manufactured Home Dwelling (A B C & D)
Number
Average Value
Number
Average Value
Number
Average Value
Number
Average Value
Number
Average Value
Number
Average Value
LOANS ORIGINATED
1
$190,040
48
$100,602
83
$102,440
22
$23,840
8
$115,504
8
$29,086
APPLICATIONS APPROVED, NOT ACCEPTED
1
$88,290
3
$78,560
9
$98,513
1
$150,390
0
$0
1
$20,200
APPLICATIONS DENIED
0
$0
10
$79,983
48
$120,725
11
$33,261
1
$102,500
4
$82,675
APPLICATIONS WITHDRAWN
1
$89,780
7
$114,689
22
$128,214
2
$37,410
0
$0
0
$0
FILES CLOSED FOR INCOMPLETENESS
0
$0
4
$98,762
13
$127,539
0
$0
0
$0
0
$0
Aggregated Statistics For Year 2004 (Based on 2 partial tracts)
A) FHA, FSA/RHS & VA Home Purchase Loans
B) Conventional Home Purchase Loans
C) Refinancings
D) Home Improvement Loans
F) Non-occupant Loans on < 5 Family Dwellings (A B C & D)
G) Loans On Manufactured Home Dwelling (A B C & D)
Number
Average Value
Number
Average Value
Number
Average Value
Number
Average Value
Number
Average Value
Number
Average Value
LOANS ORIGINATED
1
$168,350
43
$92,185
113
$120,056
30
$29,479
4
$86,230
13
$23,194
APPLICATIONS APPROVED, NOT ACCEPTED
0
$0
1
$166,850
13
$132,777
1
$113,730
1
$72,580
0
$0
APPLICATIONS DENIED
1
$50,130
6
$59,732
30
$108,090
4
$45,265
1
$136,170
4
$75,942
APPLICATIONS WITHDRAWN
1
$53,120
2
$103,250
15
$125,847
1
$23,190
0
$0
0
$0
FILES CLOSED FOR INCOMPLETENESS
0
$0
0
$0
7
$130,829
0
$0
0
$0
0
$0
Aggregated Statistics For Year 2003 (Based on 2 partial tracts)
A) FHA, FSA/RHS & VA Home Purchase Loans
B) Conventional Home Purchase Loans
C) Refinancings
D) Home Improvement Loans
F) Non-occupant Loans on < 5 Family Dwellings (A B C & D)
Number
Average Value
Number
Average Value
Number
Average Value
Number
Average Value
Number
Average Value
LOANS ORIGINATED
6
$97,017
52
$107,050
254
$95,033
24
$33,638
10
$67,263
APPLICATIONS APPROVED, NOT ACCEPTED
1
$57,610
2
$170,590
12
$97,391
1
$44,890
0
$0
APPLICATIONS DENIED
2
$100,260
4
$75,755
40
$92,571
2
$56,115
0
$0
APPLICATIONS WITHDRAWN
1
$152,630
4
$89,970
14
$112,016
1
$227,450
1
$142,910
FILES CLOSED FOR INCOMPLETENESS
0
$0
2
$117,095
1
$83,800
0
$0
0
$0
Aggregated Statistics For Year 2002 (Based on 2 partial tracts)
A) FHA, FSA/RHS & VA Home Purchase Loans
B) Conventional Home Purchase Loans
C) Refinancings
D) Home Improvement Loans
F) Non-occupant Loans on < 5 Family Dwellings (A B C & D)
Number
Average Value
Number
Average Value
Number
Average Value
Number
Average Value
Number
Average Value
LOANS ORIGINATED
3
$101,507
47
$90,676
203
$95,633
29
$23,530
8
$63,410
APPLICATIONS APPROVED, NOT ACCEPTED
0
$0
4
$72,015
11
$106,585
3
$14,713
0
$0
APPLICATIONS DENIED
1
$74,070
6
$55,117
23
$114,280
1
$4,490
1
$245,410
APPLICATIONS WITHDRAWN
0
$0
3
$76,317
13
$95,367
0
$0
0
$0
FILES CLOSED FOR INCOMPLETENESS
0
$0
1
$183,310
4
$51,065
1
$48,630
0
$0
Aggregated Statistics For Year 2001 (Based on 2 partial tracts)
A) FHA, FSA/RHS & VA Home Purchase Loans
B) Conventional Home Purchase Loans
C) Refinancings
D) Home Improvement Loans
F) Non-occupant Loans on < 5 Family Dwellings (A B C & D)
Number
Average Value
Number
Average Value
Number
Average Value
Number
Average Value
Number
Average Value
LOANS ORIGINATED
2
$91,280
52
$82,244
186
$87,033
47
$18,387
12
$63,410
APPLICATIONS APPROVED, NOT ACCEPTED
1
$72,580
2
$126,445
10
$86,642
1
$14,220
0
$0
APPLICATIONS DENIED
0
$0
8
$59,575
28
$69,743
3
$58,110
0
$0
APPLICATIONS WITHDRAWN
0
$0
4
$83,798
15
$80,556
1
$11,970
0
$0
FILES CLOSED FOR INCOMPLETENESS
0
$0
1
$16,460
4
$54,058
1
$24,690
0
$0
Aggregated Statistics For Year 2000 (Based on 2 partial tracts)
A) FHA, FSA/RHS & VA Home Purchase Loans
B) Conventional Home Purchase Loans
C) Refinancings
D) Home Improvement Loans
F) Non-occupant Loans on < 5 Family Dwellings (A B C & D)
Number
Average Value
Number
Average Value
Number
Average Value
Number
Average Value
Number
Average Value
LOANS ORIGINATED
2
$98,760
59
$78,016
41
$74,802
44
$13,638
13
$32,288
APPLICATIONS APPROVED, NOT ACCEPTED
0
$0
4
$63,970
4
$57,612
1
$22,450
0
$0
APPLICATIONS DENIED
0
$0
4
$55,740
15
$62,001
1
$29,180
0
$0
APPLICATIONS WITHDRAWN
0
$0
4
$57,238
7
$44,464
1
$49,380
0
$0
FILES CLOSED FOR INCOMPLETENESS
0
$0
1
$82,300
1
$47,880
0
$0
0
$0
Aggregated Statistics For Year 1999 (Based on 1 partial tract)
A) FHA, FSA/RHS & VA Home Purchase Loans
B) Conventional Home Purchase Loans
C) Refinancings
D) Home Improvement Loans
F) Non-occupant Loans on < 5 Family Dwellings (A B C & D)
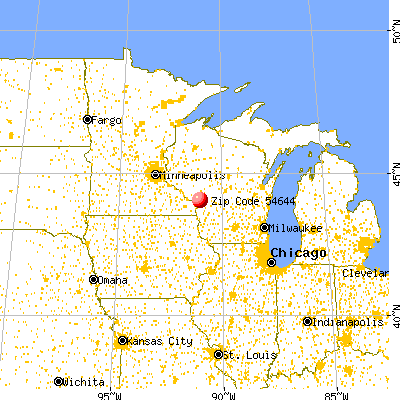


 Nearest zip codes: 54642, 54669, 54636, 54614, 54650, 54627.