Estimated zip code population in 2022: 1,008 Zip code population in 2010: 1,191 Zip code population in 2000: 1,243
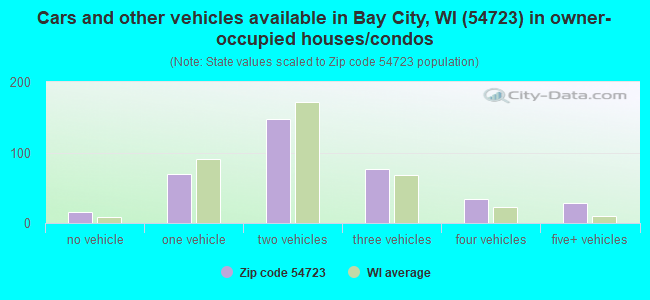
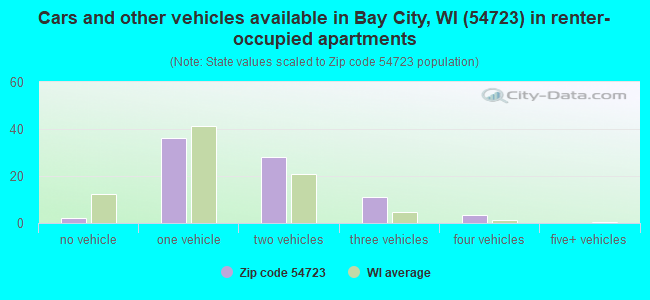
Houses and condos: 477 Renter-occupied apartments: 82
% of renters here:
18%
State:
32%
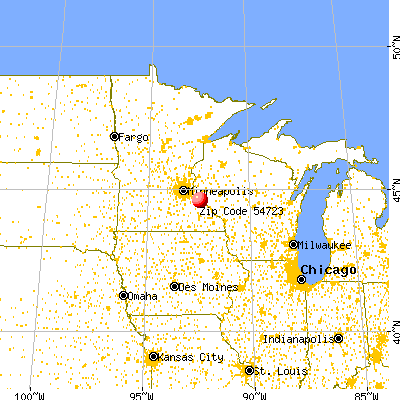
March 2022 cost of living index in zip code 54723: 95.0 (less than average, U.S. average is 100)
Land area: 30.7 sq. mi. Water area: 6.2 sq. mi.
Population density: 33 people per square mile
(very low).
OSM Map
General Map
Google Map
MSN Map
OSM Map
General Map
Google Map
MSN Map
OSM Map
General Map
Google Map
MSN Map
OSM Map
General Map
Google Map
MSN Map
Please wait while loading the map...
Real estate property taxes paid for housing units in 2022:
This zip code:
1.5% ($2,750)
Wisconsin:
1.4% ($3,497)
Median real estate property taxes paid for housing units with mortgages in 2022: $2,812 (1.4%) Median real estate property taxes paid for housing units with no mortgage in 2022: $2,476 (1.5%)
Business Search- 14 Million verified businesses
Males: 531
(52.7%)
Females: 477
(47.3%)
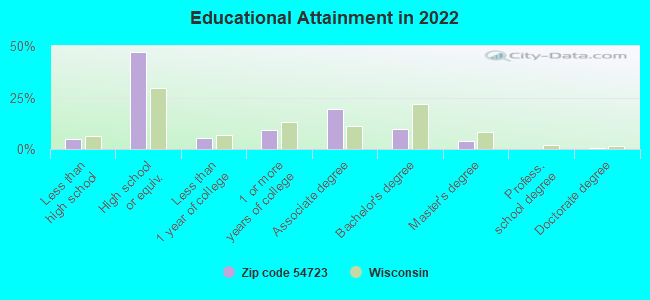
For population 25 years and over in 54723:
High school or higher: 93.7%
Bachelor's degree or higher: 14.3%
Graduate or professional degree: 4.7%
Unemployed: 1.0%
Mean travel time to work (commute): 29.3 minutes
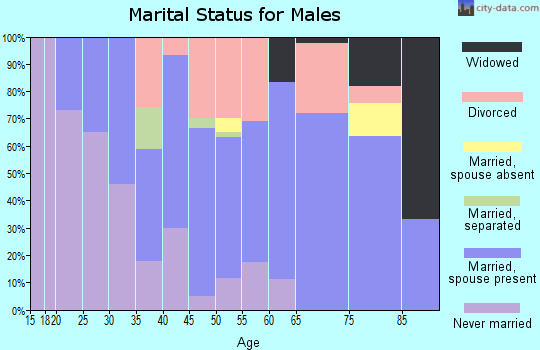
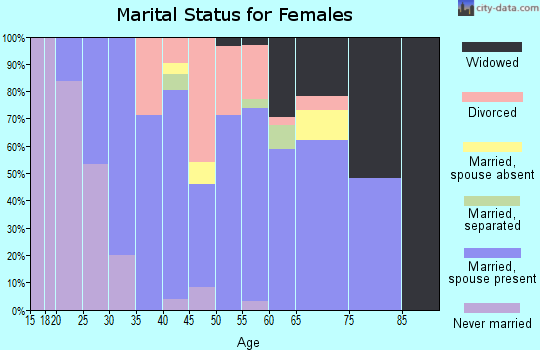
For population 15 years and over in 54723:
Never married: 29.0%
Now married: 49.6%
Separated: 0.4%
Widowed: 4.0%
Divorced: 16.9%
Zip code 54723 compared to state average:
Unemployed percentage below state average.
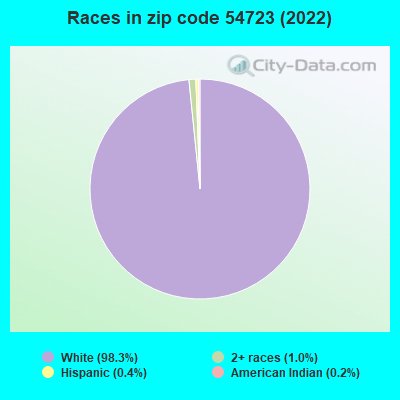
Black race population percentage significantly below state average.
Hispanic race population percentage significantly below state average.
Median age above state average.
Foreign-born population percentage significantly below state average.
Renting percentage below state average.
Length of stay since moving in significantly above state average.
Percentage of population with a bachelor's degree or higher below state average.
Averages for the 2020 tax year for zip code 54723, filed in 2021:
Average Adjusted Gross Income (AGI) in 2020: $63,690 (Individual Income Tax Returns)
Here:
$63,690
State:
$72,319
Salary/wage: $52,870 (reported on 84.1% of returns)
Here:
$52,870
State:
$59,242
(% of AGI for various income ranges: 1197.0% for AGIs below $25k, 3972.1% for AGIs $25k-50k, 5926.7% for AGIs $50k-75k, 8374.0% for AGIs $75k-100k, 19570.0% for AGIs $100k-200k)
Taxable interest for individuals: $668 (reported on 39.7% of returns)
This zip code:
$668
Wisconsin:
$1,431
(% of AGI for various income ranges: 18.0% for AGIs below $25k, 13.6% for AGIs $25k-50k, 14.4% for AGIs $50k-75k, 22.0% for AGIs $75k-100k, 176.7% for AGIs $100k-200k)
Ordinary dividends: $2,860 (reported on 15.9% of returns)
Here:
$2,860
State:
$6,481
(% of AGI for various income ranges: 59.3% for AGIs $25k-50k, 34.4% for AGIs $50k-75k, 286.7% for AGIs $100k-200k)
Net capital gain/loss in AGI: +$6,580 (reported on 15.9% of returns)
Here:
+$6,580
State:
+$18,329
(% of AGI for various income ranges: 46.4% for AGIs $25k-50k, 1.1% for AGIs $50k-75k, 986.7% for AGIs $100k-200k)
Profit/loss from business: +$8,343 (reported on 11.1% of returns)
Here:
+$8,343
State:
+$14,562
(% of AGI for various income ranges: 280.7% for AGIs $25k-50k, 318.3% for AGIs $100k-200k)
Taxable individual retirement arrangement distribution: $18,440 (reported on 7.9% of returns)
54723:
$18,440
Wisconsin:
$19,348
(% of AGI for various income ranges: 252.1% for AGIs $25k-50k, 1138.0% for AGIs $75k-100k)
Total itemized deductions: $21,533 (reported on 4.8% of returns)
Here:
$21,533
State:
$33,000
(% of AGI for various income ranges: 717.8% for AGIs $50k-75k)
Taxes paid: $7,167 (reported on 4.8% of returns)
54723:
$7,167
State:
$8,228
(% of AGI for various income ranges: 430.0% for AGIs $75k-100k)
Earned income credit: $1,867 (reported on 9.5% of returns)
Here:
$1,867
State:
$2,155
(% of AGI for various income ranges: 61.0% for AGIs below $25k, 36.4% for AGIs $25k-50k)
Percentage of individuals using paid preparers for their 2020 taxes: 95.2%
Here:
95%
State:
94%
(% for various income ranges: 93.3% for AGIs below $25k, 94.7% for AGIs $25k-50k, 100.0% for AGIs $50k-75k, 100.0% for AGIs $75k-100k, 91.7% for AGIs $100k-200k)
Averages for the 2012 tax year for zip code 54723, filed in 2013:
Average Adjusted Gross Income (AGI) in 2012: $51,900 (Individual Income Tax Returns)
Here:
$51,900
State:
$57,939
Salary/wage: $41,851 (reported on 85.9% of returns)
Here:
$41,851
State:
$48,248
(% of AGI for various income ranges: 77.2% for AGIs below $25k, 79.8% for AGIs $25k-50k, 80.1% for AGIs $50k-75k, 79.3% for AGIs $75k-100k, 49.7% for AGIs $100k-200k)
Taxable interest for individuals: $650 (reported on 34.4% of returns)
This zip code:
$650
Wisconsin:
$1,224
(% of AGI for various income ranges: 1.4% for AGIs below $25k, 0.7% for AGIs $25k-50k, 0.3% for AGIs $50k-75k, 0.1% for AGIs $75k-100k, 0.2% for AGIs $100k-200k)
Ordinary dividends: $10,610 (reported on 15.6% of returns)
Here:
$10,610
State:
$5,137
(% of AGI for various income ranges: 0.4% for AGIs below $25k, 0.5% for AGIs $25k-50k, 0.9% for AGIs $50k-75k, 8.4% for AGIs $100k-200k)
Net capital gain/loss in AGI: +$2,925 (reported on 12.5% of returns)
Here:
+$2,925
State:
+$11,137
Profit/loss from business: +$7,462 (reported on 12.5% of returns)
Here:
+$7,462
State:
+$11,943
Taxable individual retirement arrangement distribution: $9,133 (reported on 9.4% of returns)
54723:
$9,133
Wisconsin:
$14,087
Total itemized deductions: $19,329 (21% of AGI, reported on 32.8% of returns)
Here:
$19,329
State:
$22,257
Here:
20.9% of AGI
State:
20.1% of AGI
(% of AGI for various income ranges: 10.8% for AGIs $25k-50k, 13.9% for AGIs $50k-75k, 16.4% for AGIs $75k-100k, 12.8% for AGIs $100k-200k)
Charity contributions: $2,300 (reported on 23.4% of returns)
Here:
$2,300
State:
$3,370
(% of AGI for various income ranges: 0.7% for AGIs $25k-50k, 1.4% for AGIs $50k-75k, 1.2% for AGIs $75k-100k, 1.2% for AGIs $100k-200k)
Taxes paid: $8,548 (reported on 32.8% of returns)
54723:
$8,548
State:
$10,731
(% of AGI for various income ranges: 3.6% for AGIs $25k-50k, 4.9% for AGIs $50k-75k, 7.6% for AGIs $75k-100k, 6.9% for AGIs $100k-200k)
Earned income credit: $1,914 (reported on 10.9% of returns)
Here:
$1,914
State:
$2,094
(% of AGI for various income ranges: 4.7% for AGIs below $25k)
Percentage of individuals using paid preparers for their 2012 taxes: 64.1%
Here:
64%
State:
54%
(% for various income ranges: 50.0% for AGIs below $25k, 70.6% for AGIs $25k-50k, 66.7% for AGIs $50k-75k, 85.7% for AGIs $75k-100k, 66.7% for AGIs $100k-200k)
Averages for the 2004 tax year for zip code 54723, filed in 2005:
Average Adjusted Gross Income (AGI) in 2004: $41,819 (Individual Income Tax Returns)
Here:
$41,819
State:
$47,735
Salary/wage: $38,235 (reported on 89.9% of returns)
Here:
$38,235
State:
$41,540
(% of AGI for various income ranges: 104.2% for AGIs below $10k, 82.3% for AGIs $10k-25k, 86.0% for AGIs $25k-50k, 87.7% for AGIs $50k-75k, 88.6% for AGIs $75k-100k, 61.5% for AGIs over 100k)
Taxable interest for individuals: $823 (reported on 45.4% of returns)
This zip code:
$823
Wisconsin:
$1,420
(% of AGI for various income ranges: 4.0% for AGIs below $10k, 1.2% for AGIs $10k-25k, 0.6% for AGIs $25k-50k, 1.0% for AGIs $50k-75k, 0.2% for AGIs $75k-100k, 1.3% for AGIs over 100k)
Taxable dividends: $1,066 (reported on 19.1% of returns)
Here:
$1,066
State:
$2,869
(% of AGI for various income ranges: 0.6% for AGIs below $10k, 0.3% for AGIs $10k-25k, 0.4% for AGIs $25k-50k, 0.6% for AGIs $50k-75k, 0.2% for AGIs $75k-100k, 0.9% for AGIs over 100k)
Net capital gain/loss: +$6,176 (reported on 14.3% of returns)
Here:
+$6,176
State:
+$9,569
(% of AGI for various income ranges: -1.3% for AGIs below $10k, -0.1% for AGIs $10k-25k, 0.7% for AGIs $25k-50k, 0.3% for AGIs $50k-75k, 0.5% for AGIs $75k-100k, 9.4% for AGIs over 100k)
Profit/loss from business: +$5,536 (reported on 13.2% of returns)
Here:
+$5,536
State:
+$10,417
(% of AGI for various income ranges: 3.8% for AGIs $10k-25k, 3.4% for AGIs $25k-50k, 0.9% for AGIs $50k-75k, 1.5% for AGIs $75k-100k)
Total itemized deductions: $15,777 (23% of AGI, reported on 36.7% of returns)
Here:
$15,777
State:
$18,160
Here:
22.8% of AGI
State:
21.1% of AGI
(% of AGI for various income ranges: 10.5% for AGIs $10k-25k, 13.4% for AGIs $25k-50k, 14.7% for AGIs $50k-75k, 14.1% for AGIs $75k-100k, 16.2% for AGIs over 100k)
Charity contributions deductions: $1,834 (3% of AGI, reported on 28.5% of returns)
Here:
$1,834
State:
$2,711
Here:
2.6% of AGI
State:
3.0% of AGI
(% of AGI for various income ranges: 0.5% for AGIs $10k-25k, 1.2% for AGIs $25k-50k, 1.1% for AGIs $50k-75k, 1.2% for AGIs $75k-100k, 2.0% for AGIs over 100k)
Total tax: $4,729 (reported on 81.4% of returns)
54723:
$4,729
State:
$7,114
(% of AGI for various income ranges: 1.9% for AGIs below $10k, 4.8% for AGIs $10k-25k, 7.3% for AGIs $25k-50k, 7.4% for AGIs $50k-75k, 10.1% for AGIs $75k-100k, 16.1% for AGIs over 100k)
Earned income credit: $1,407 (reported on 13.5% of returns)
Here:
$1,407
State:
$1,544
Percentage of individuals using paid preparers for their 2004 taxes: 64.4%
Here:
64%
State:
57%
(% for various income ranges: 58.5% for AGIs below $10k, 60.0% for AGIs $10k-25k, 64.6% for AGIs $25k-50k, 69.9% for AGIs $50k-75k, 68.3% for AGIs $75k-100k, 79.3% for AGIs over 100k)
Household received Food Stamps/SNAP in the past 12 months: 27 Household did not receive Food Stamps/SNAP in the past 12 months: 422
Women who had a birth in the past 12 months: 11 (11 now married, 0 unmarried) Women who did not have a birth in the past 12 months: 187 (78 now married, 108 unmarried)
Housing units in zip code 54723 with a mortgage: 226 (22 second mortgage, 14 both second mortgage and home equity loan) Houses without a mortgage: 5
Median monthly owner costs for units with a mortgage: $1,521 Median monthly owner costs for units without a mortgage: $521
Residents with income below the poverty level in 2022:
This zip code:
5.6%
Whole state:
10.7%
Residents with income below 50% of the poverty level in 2022:
This zip code:
3.7%
Whole state:
5.7%
Median number of rooms in houses and condos:
Here:
6.1
State:
6.5
Median number of rooms in apartments:
Here:
5.1
State:
4.1
Notable locations in this zip code not listed on our city pages
96 married couples with children.
32 single-parent households (10 men, 22 women).
98.8% of residents of 54723 zip code speak English at home.
1.0% of residents speak Spanish at home (50% very well, 20% well, 30% not well).
0.1% of residents speak Asian or Pacific Island language at home (100% not well).
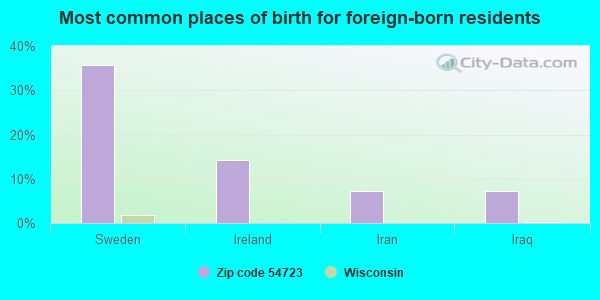
Foreign born population: 14 (1.5%) (26.7% of them are naturalized citizens)
This zip code:
1.5%
Whole state:
5.0%
36%Sweden
14%Ireland
7%Iran
7%Iraq
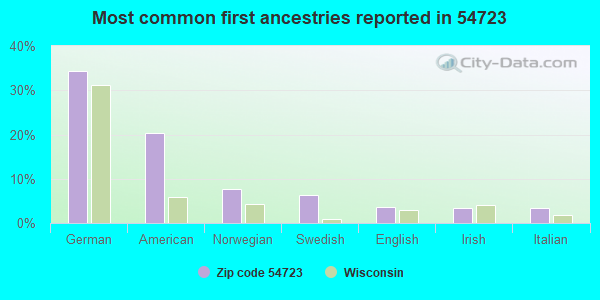
34%German
20%American
8%Norwegian
6%Swedish
4%English
3%Irish
3%Italian
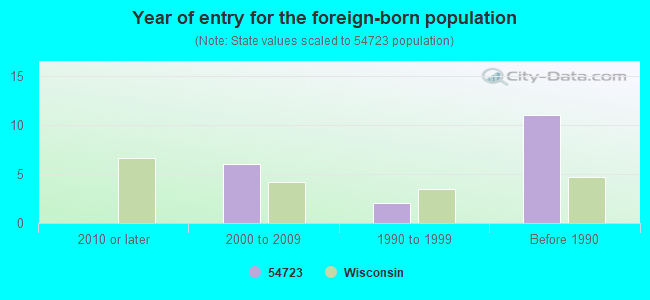
Year of entry for the foreign-born population
02010 or later
62000 to 2009
21990 to 1999
11Before 1990
Facilities with environmental interests located in this zip code:
AERO ASHANNON (HWY 35 RED WING AIRPORT in BAY CITY, WI)
Conditionally Exempt Small Quantity Generators, less than 100 kg/month of hazardous waste (Resource Conservation and Recovery Act (tracking hazardous waste)) - notification STATE MASTER (Wisconsin database) - RCRAINFO-WID988631347, CESQG Organizations: KELLY DAN (CONTACT/OWNER)
Alternative names: AERO DSHANNON
BAY CITY VILLAGE (WEST STH 35 in BAY CITY, WI)
National Pollutant Discharge Elimination System NON-MAJOR (Tracking pollutant discharge elimination systems) - permit STATE MASTER (Wisconsin database) - PCS-WI0061255, WASTEWATER FACILITY, SDWIS-WI6480153, DRINKING WATER SYSTEM Business SIC classification: SEWERAGE SYSTEMS
BLUE AIRWAYS (HWY 35 S, RED WING AIRPORT in BAY CITY, WI)
Conditionally Exempt Small Quantity Generators, less than 100 kg/month of hazardous waste (Resource Conservation and Recovery Act (tracking hazardous waste)) - notification STATE MASTER (Wisconsin database) - RCRAINFO-WID988631362, CESQG Organizations: BLUE TOM (CONTACT/OWNER)
BROWN SEED FARMS (RR 1 in BAY CITY, WI)
Small Quantity Generators, between 100 kg and 1000 kg of hazardous waste/month (Resource Conservation and Recovery Act (tracking hazardous waste)) - notification Organizations: BROWN CHARLES (CONTACT/OWNER)
CHARLES BACH PROP (FORMER) (W6414 PEPIN ST in BAY CITY, WI)
Conditionally Exempt Small Quantity Generators, less than 100 kg/month of hazardous waste (Resource Conservation and Recovery Act (tracking hazardous waste)) Organizations: CITIFINANCIAL MORTGAGE (CONTACT/OWNER)
Housing units lacking complete plumbing facilities: 1.1% Housing units lacking complete kitchen facilities: 1.1%
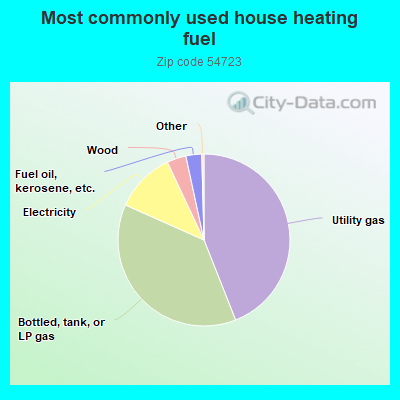
44.2%Utility gas
37.8%Bottled, tank, or LP gas
11.4%Electricity
3.6%Wood
3.0%Fuel oil, kerosene, etc.
Population in 1990: 1,540.
Place of birth for U.S.-born residents:
This state: 200
Northeast: 12
Midwest: 746
South: 4
West: 36
61% of the 54723 zip code residents lived in the same house 5 years ago. Out of people who lived in different houses, 62% lived in this county. Out of people who lived in different counties, 50% lived in Wisconsin.
95% of the 54723 zip code residents lived in the same house 1 year ago. Out of people who lived in different houses, 27% moved from this county. Out of people who lived in different houses, 14% moved from different county within same state. Out of people who lived in different houses, 57% moved from different state. Out of people who lived in different houses, 8% moved from abroad.
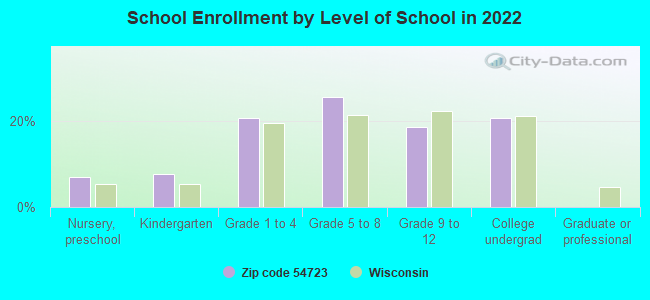
Private vs. public school enrollment:
Students in private schools in grades 1 to 8 (elementary and middle school): 8
Here:
12.4%
Wisconsin:
16.7%
Students in private schools in grades 9 to 12 (high school): 8
Here:
29.0%
Wisconsin:
12.5%
Students in private undergraduate colleges: 1
Here:
6.0%
Wisconsin:
17.5%
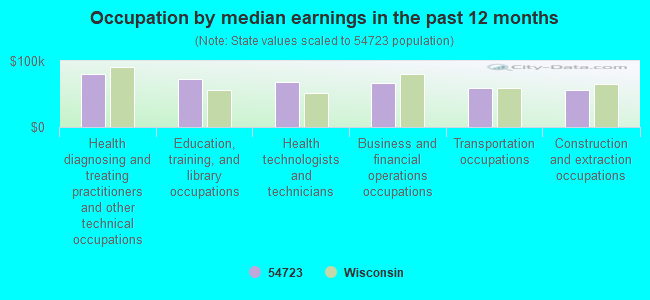
Occupation by median earnings in the past 12 months ($)
80,774Health diagnosing and treating practitioners and other technical occupations
72,172Education, training, and library occupations
67,927Health technologists and technicians
66,627Business and financial operations occupations
59,827Transportation occupations
56,029Construction and extraction occupations
Companies with federal contracts located in this zip code:
GS DISTRIBUTING (N1695 660TH ST in BAY CITY, WI; small business)
$1,025 with Army for Plumbing Fixtures and Accessories. Taking place in MN. Signed on 2005-08-13. Completion date: 2005-08-19.
Top industries in this zip code by the number of employees in 2005:
Accommodation and Food Services: Full-Service Restaurants (10-19 employees: 1 establishment)
Construction: Commercial and Institutional Building Construction (5-9: 1)
Construction: Water and Sewer Line and Related Structures Construction (5-9: 1)
Other Services (except Public Administration): Religious Organizations (1-4: 2)
Accommodation and Food Services: Drinking Places (Alcoholic Beverages) (1-4: 2)
Construction: Plumbing, Heating, and Air-Conditioning Contractors (1-4: 1)
Fatal accident statistics in 2010:
Fatal accident count: 2
Vehicles involved in fatal accidents: 3
Fatal accidents caused by drunken drivers: 2
Fatalities: 2
Persons involved in fatal accidents: 4
Pedestrians involved in fatal accidents: 0
Home Mortgage Disclosure Act Aggregated Statistics For Year 2009 (Based on 2 partial tracts)
A) FHA, FSA/RHS & VA Home Purchase Loans
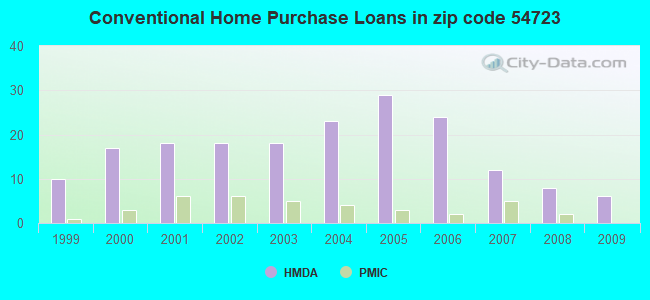
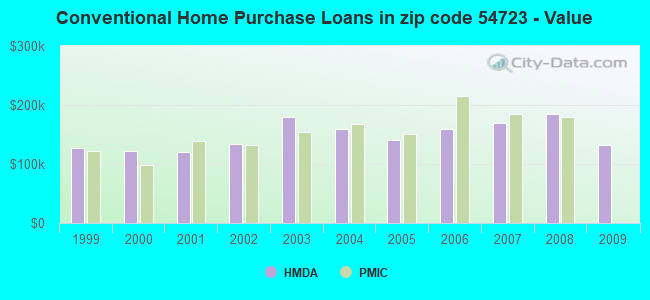
B) Conventional Home Purchase Loans
C) Refinancings
D) Home Improvement Loans
F) Non-occupant Loans on < 5 Family Dwellings (A B C & D)
G) Loans On Manufactured Home Dwelling (A B C & D)
Number
Average Value
Number
Average Value
Number
Average Value
Number
Average Value
Number
Average Value
Number
Average Value
LOANS ORIGINATED
4
$125,152
6
$132,548
48
$163,978
4
$51,210
1
$139,360
4
$74,415
APPLICATIONS APPROVED, NOT ACCEPTED
0
$0
0
$0
4
$208,092
0
$0
0
$0
0
$0
APPLICATIONS DENIED
1
$113,920
2
$146,395
14
$186,231
2
$52,765
0
$0
1
$54,120
APPLICATIONS WITHDRAWN
0
$0
2
$108,375
12
$180,896
0
$0
0
$0
0
$0
FILES CLOSED FOR INCOMPLETENESS
0
$0
0
$0
2
$261,940
0
$0
0
$0
0
$0
Aggregated Statistics For Year 2008 (Based on 2 partial tracts)
A) FHA, FSA/RHS & VA Home Purchase Loans
B) Conventional Home Purchase Loans
C) Refinancings
D) Home Improvement Loans
F) Non-occupant Loans on < 5 Family Dwellings (A B C & D)
G) Loans On Manufactured Home Dwelling (A B C & D)
Number
Average Value
Number
Average Value
Number
Average Value
Number
Average Value
Number
Average Value
Number
Average Value
LOANS ORIGINATED
3
$173,273
8
$185,328
20
$169,950
3
$96,063
2
$170,885
1
$67,380
APPLICATIONS APPROVED, NOT ACCEPTED
0
$0
1
$173,730
5
$141,254
1
$122,580
0
$0
0
$0
APPLICATIONS DENIED
1
$71,980
2
$192,530
14
$163,036
2
$92,275
1
$63,860
2
$97,820
APPLICATIONS WITHDRAWN
0
$0
1
$82,800
5
$181,572
0
$0
0
$0
0
$0
FILES CLOSED FOR INCOMPLETENESS
0
$0
0
$0
1
$92,270
0
$0
0
$0
0
$0
Aggregated Statistics For Year 2007 (Based on 2 partial tracts)
A) FHA, FSA/RHS & VA Home Purchase Loans
B) Conventional Home Purchase Loans
C) Refinancings
D) Home Improvement Loans
F) Non-occupant Loans on < 5 Family Dwellings (A B C & D)
G) Loans On Manufactured Home Dwelling (A B C & D)
Number
Average Value
Number
Average Value
Number
Average Value
Number
Average Value
Number
Average Value
Number
Average Value
LOANS ORIGINATED
1
$98,230
12
$169,892
27
$171,921
6
$86,050
2
$68,325
2
$89,435
APPLICATIONS APPROVED, NOT ACCEPTED
0
$0
1
$110,130
6
$198,800
1
$46,270
0
$0
0
$0
APPLICATIONS DENIED
0
$0
2
$82,670
17
$173,439
4
$30,645
0
$0
1
$110,400
APPLICATIONS WITHDRAWN
0
$0
1
$200,790
7
$188,879
1
$105,530
0
$0
0
$0
FILES CLOSED FOR INCOMPLETENESS
0
$0
0
$0
2
$274,795
0
$0
0
$0
0
$0
Aggregated Statistics For Year 2006 (Based on 2 partial tracts)
A) FHA, FSA/RHS & VA Home Purchase Loans
B) Conventional Home Purchase Loans
C) Refinancings
D) Home Improvement Loans
F) Non-occupant Loans on < 5 Family Dwellings (A B C & D)
G) Loans On Manufactured Home Dwelling (A B C & D)
Number
Average Value
Number
Average Value
Number
Average Value
Number
Average Value
Number
Average Value
Number
Average Value
LOANS ORIGINATED
3
$157,310
24
$159,474
37
$150,242
5
$57,908
4
$115,818
3
$70,717
APPLICATIONS APPROVED, NOT ACCEPTED
0
$0
4
$129,820
8
$189,081
1
$147,210
0
$0
1
$132,320
APPLICATIONS DENIED
0
$0
6
$171,740
24
$187,842
2
$122,580
1
$139,090
1
$69,540
APPLICATIONS WITHDRAWN
0
$0
3
$262,210
13
$192,772
0
$0
0
$0
0
$0
FILES CLOSED FOR INCOMPLETENESS
0
$0
1
$109,320
4
$182,520
0
$0
0
$0
0
$0
Aggregated Statistics For Year 2005 (Based on 2 partial tracts)
A) FHA, FSA/RHS & VA Home Purchase Loans
B) Conventional Home Purchase Loans
C) Refinancings
D) Home Improvement Loans
F) Non-occupant Loans on < 5 Family Dwellings (A B C & D)
G) Loans On Manufactured Home Dwelling (A B C & D)
Number
Average Value
Number
Average Value
Number
Average Value
Number
Average Value
Number
Average Value
Number
Average Value
LOANS ORIGINATED
1
$92,000
29
$140,563
39
$169,909
9
$62,238
3
$145,673
5
$84,914
APPLICATIONS APPROVED, NOT ACCEPTED
0
$0
1
$108,240
6
$160,060
2
$53,715
1
$60,610
1
$83,620
APPLICATIONS DENIED
0
$0
5
$167,394
16
$149,896
4
$88,012
1
$206,470
2
$39,510
APPLICATIONS WITHDRAWN
0
$0
4
$135,502
18
$179,333
1
$208,900
2
$148,560
0
$0
FILES CLOSED FOR INCOMPLETENESS
0
$0
0
$0
7
$193,673
0
$0
0
$0
0
$0
Aggregated Statistics For Year 2004 (Based on 2 partial tracts)
A) FHA, FSA/RHS & VA Home Purchase Loans
B) Conventional Home Purchase Loans
C) Refinancings
D) Home Improvement Loans
F) Non-occupant Loans on < 5 Family Dwellings (A B C & D)
G) Loans On Manufactured Home Dwelling (A B C & D)
Number
Average Value
Number
Average Value
Number
Average Value
Number
Average Value
Number
Average Value
Number
Average Value
LOANS ORIGINATED
1
$167,230
23
$159,995
42
$142,484
9
$62,569
2
$132,055
4
$85,915
APPLICATIONS APPROVED, NOT ACCEPTED
0
$0
2
$157,490
6
$140,307
1
$49,790
0
$0
1
$89,840
APPLICATIONS DENIED
0
$0
4
$128,738
21
$142,645
2
$34,095
1
$256,800
5
$90,218
APPLICATIONS WITHDRAWN
1
$77,390
1
$112,570
16
$144,771
1
$40,320
0
$0
1
$68,190
FILES CLOSED FOR INCOMPLETENESS
0
$0
1
$175,350
2
$144,635
0
$0
0
$0
0
$0
Aggregated Statistics For Year 2003 (Based on 2 partial tracts)
A) FHA, FSA/RHS & VA Home Purchase Loans
B) Conventional Home Purchase Loans
C) Refinancings
D) Home Improvement Loans
F) Non-occupant Loans on < 5 Family Dwellings (A B C & D)
Number
Average Value
Number
Average Value
Number
Average Value
Number
Average Value
Number
Average Value
LOANS ORIGINATED
2
$156,540
18
$178,867
100
$132,875
5
$72,574
2
$114,735
APPLICATIONS APPROVED, NOT ACCEPTED
1
$85,510
1
$146,940
6
$151,445
1
$41,670
0
$0
APPLICATIONS DENIED
0
$0
3
$121,230
19
$125,872
2
$16,235
1
$106,080
APPLICATIONS WITHDRAWN
0
$0
3
$152,077
13
$133,281
0
$0
0
$0
FILES CLOSED FOR INCOMPLETENESS
1
$67,380
1
$119,610
2
$102,830
0
$0
0
$0
Aggregated Statistics For Year 2002 (Based on 2 partial tracts)
A) FHA, FSA/RHS & VA Home Purchase Loans
B) Conventional Home Purchase Loans
C) Refinancings
D) Home Improvement Loans
F) Non-occupant Loans on < 5 Family Dwellings (A B C & D)
Number
Average Value
Number
Average Value
Number
Average Value
Number
Average Value
Number
Average Value
LOANS ORIGINATED
1
$162,090
18
$133,165
80
$113,375
6
$24,625
3
$63,953
APPLICATIONS APPROVED, NOT ACCEPTED
0
$0
2
$109,050
4
$98,565
1
$20,840
0
$0
APPLICATIONS DENIED
0
$0
4
$152,212
14
$109,071
2
$14,750
0
$0
APPLICATIONS WITHDRAWN
0
$0
2
$135,300
8
$129,990
0
$0
0
$0
FILES CLOSED FOR INCOMPLETENESS
0
$0
0
$0
3
$115,277
0
$0
0
$0
Aggregated Statistics For Year 2001 (Based on 2 partial tracts)
A) FHA, FSA/RHS & VA Home Purchase Loans
B) Conventional Home Purchase Loans
C) Refinancings
D) Home Improvement Loans
F) Non-occupant Loans on < 5 Family Dwellings (A B C & D)
Number
Average Value
Number
Average Value
Number
Average Value
Number
Average Value
Number
Average Value
LOANS ORIGINATED
1
$190,230
18
$120,101
65
$111,058
5
$26,790
1
$49,790
APPLICATIONS APPROVED, NOT ACCEPTED
0
$0
2
$134,625
5
$99,202
1
$10,550
1
$93,090
APPLICATIONS DENIED
0
$0
3
$72,700
12
$91,531
2
$22,460
1
$36,530
APPLICATIONS WITHDRAWN
0
$0
1
$88,760
8
$108,849
0
$0
0
$0
FILES CLOSED FOR INCOMPLETENESS
0
$0
0
$0
1
$99,850
0
$0
0
$0
Aggregated Statistics For Year 2000 (Based on 2 partial tracts)
A) FHA, FSA/RHS & VA Home Purchase Loans
B) Conventional Home Purchase Loans
C) Refinancings
D) Home Improvement Loans
E) Loans on Dwellings For 5+ Families
F) Non-occupant Loans on < 5 Family Dwellings (A B C & D)
Number
Average Value
Number
Average Value
Number
Average Value
Number
Average Value
Number
Average Value
Number
Average Value
LOANS ORIGINATED
1
$112,030
17
$122,088
21
$85,522
5
$24,030
2
$75,360
1
$56,830
APPLICATIONS APPROVED, NOT ACCEPTED
0
$0
2
$85,240
2
$94,440
0
$0
0
$0
0
$0
APPLICATIONS DENIED
0
$0
5
$69,868
9
$96,484
2
$14,340
0
$0
1
$59,260
APPLICATIONS WITHDRAWN
0
$0
0
$0
4
$93,560
1
$66,030
0
$0
0
$0
FILES CLOSED FOR INCOMPLETENESS
0
$0
0
$0
2
$93,355
0
$0
0
$0
0
$0
Aggregated Statistics For Year 1999 (Based on 1 partial tract)
A) FHA, FSA/RHS & VA Home Purchase Loans
B) Conventional Home Purchase Loans
C) Refinancings
D) Home Improvement Loans
F) Non-occupant Loans on < 5 Family Dwellings (A B C & D)


 Nearest zip codes: 55026, 54011, 54750, 54010, 55066, 54014.