Estimated median house/condo value in 2022: $593,111
55384:
$593,111
Minnesota:
$314,600
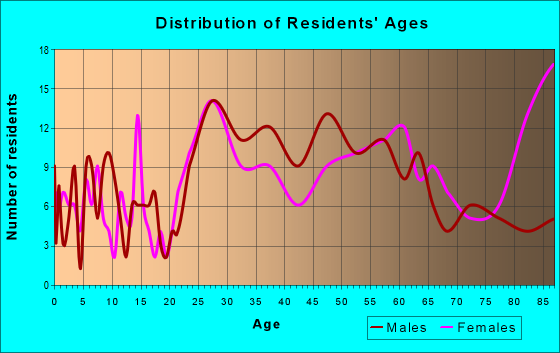
Median resident age:
This zip code:
56.2 years
Minnesota median age:
39.0 years
Average household size:
This zip code:
1.4 people
Minnesota:
2.4 people
Averages for the 2020 tax year for zip code 55384, filed in 2021:
Average Adjusted Gross Income (AGI) in 2020: $95,287 (Individual Income Tax Returns)
Here:
$95,287
State:
$82,178
Salary/wage: $76,552 (reported on 66.3% of returns)
Here:
$76,552
State:
$67,438
(% of AGI for various income ranges: 981.1% for AGIs below $25k, 3922.0% for AGIs $25k-50k, 6018.6% for AGIs $50k-75k, 10050.0% for AGIs $75k-100k, 17071.7% for AGIs $100k-200k, 83883.3% for AGIs over 200k)
Taxable interest for individuals: $1,715 (reported on 39.6% of returns)
This zip code:
$1,715
Minnesota:
$1,814
(% of AGI for various income ranges: 51.1% for AGIs below $25k, 35.3% for AGIs $25k-50k, 88.6% for AGIs $50k-75k, 37.5% for AGIs $75k-100k, 361.7% for AGIs $100k-200k, 823.3% for AGIs over 200k)
Ordinary dividends: $9,200 (reported on 30.7% of returns)
Here:
$9,200
State:
$6,928
(% of AGI for various income ranges: 126.7% for AGIs below $25k, 80.7% for AGIs $25k-50k, 481.4% for AGIs $50k-75k, 477.5% for AGIs $75k-100k, 1445.0% for AGIs $100k-200k, 3693.3% for AGIs over 200k)
Net capital gain/loss in AGI: +$16,788 (reported on 31.7% of returns)
Here:
+$16,788
State:
+$20,591
(% of AGI for various income ranges: 21.1% for AGIs below $25k, 102.7% for AGIs $25k-50k, 312.9% for AGIs $50k-75k, 585.0% for AGIs $75k-100k, 988.3% for AGIs $100k-200k, 13780.0% for AGIs over 200k)
Profit/loss from business: +$19,453 (reported on 14.9% of returns)
Here:
+$19,453
State:
+$14,342
(% of AGI for various income ranges: 190.6% for AGIs below $25k, 284.0% for AGIs $25k-50k, 335.7% for AGIs $50k-75k, 1336.7% for AGIs $100k-200k, 3706.7% for AGIs over 200k)
Taxable individual retirement arrangement distribution: $28,867 (reported on 14.9% of returns)
55384:
$28,867
Minnesota:
$20,675
(% of AGI for various income ranges: 141.7% for AGIs below $25k, 269.3% for AGIs $25k-50k, 1128.6% for AGIs $50k-75k, 4801.7% for AGIs $100k-200k)
Total itemized deductions: $37,479 (reported on 13.9% of returns)
Here:
$37,479
State:
$33,311
(% of AGI for various income ranges: 417.8% for AGIs below $25k, 1372.9% for AGIs $50k-75k, 1800.0% for AGIs $100k-200k, 8180.0% for AGIs over 200k)
Charity contributions: $6,755 (reported on 10.9% of returns)
Here:
$6,755
State:
$11,879
(% of AGI for various income ranges: 30.0% for AGIs $25k-50k, 258.3% for AGIs $100k-200k, 1810.0% for AGIs over 200k)
Taxes paid: $8,229 (reported on 13.9% of returns)
55384:
$8,229
State:
$8,252
(% of AGI for various income ranges: 88.9% for AGIs below $25k, 195.7% for AGIs $50k-75k, 491.7% for AGIs $100k-200k, 1866.7% for AGIs over 200k)
Earned income credit: $1,389 (reported on 8.9% of returns)
Here:
$1,389
State:
$2,055
(% of AGI for various income ranges: 43.9% for AGIs below $25k, 30.7% for AGIs $25k-50k)
Percentage of individuals using paid preparers for their 2020 taxes: 92.1%
Here:
92%
State:
94%
(% for various income ranges: 87.9% for AGIs below $25k, 92.0% for AGIs $25k-50k, 92.3% for AGIs $50k-75k, 87.5% for AGIs $75k-100k, 100.0% for AGIs $100k-200k, 100.0% for AGIs over 200k)
Averages for the 2012 tax year for zip code 55384, filed in 2013:
Average Adjusted Gross Income (AGI) in 2012: $68,411 (Individual Income Tax Returns)
Here:
$68,411
State:
$67,192
Salary/wage: $62,942 (reported on 72.7% of returns)
Here:
$62,942
State:
$55,182
(% of AGI for various income ranges: 57.1% for AGIs below $25k, 79.5% for AGIs $25k-50k, 65.2% for AGIs $50k-75k, 59.4% for AGIs $75k-100k, 70.4% for AGIs $100k-200k, 64.2% for AGIs over 200k)
Taxable interest for individuals: $1,305 (reported on 40.4% of returns)
This zip code:
$1,305
Minnesota:
$1,664
(% of AGI for various income ranges: 2.7% for AGIs below $25k, 0.8% for AGIs $25k-50k, 1.3% for AGIs $50k-75k, 0.6% for AGIs $75k-100k, 0.6% for AGIs $100k-200k, 0.4% for AGIs over 200k)
Ordinary dividends: $5,133 (reported on 27.3% of returns)
Here:
$5,133
State:
$5,665
(% of AGI for various income ranges: 5.2% for AGIs below $25k, 1.1% for AGIs $25k-50k, 3.2% for AGIs $50k-75k, 2.0% for AGIs $75k-100k, 1.5% for AGIs $100k-200k, 1.9% for AGIs over 200k)
Net capital gain/loss in AGI: +$6,742 (reported on 24.2% of returns)
Here:
+$6,742
State:
+$16,131
(% of AGI for various income ranges: 0.1% for AGIs $25k-50k, 1.0% for AGIs $50k-75k, 6.3% for AGIs over 200k)
Profit/loss from business: +$8,243 (reported on 14.1% of returns)
Here:
+$8,243
State:
+$12,430
(% of AGI for various income ranges: 7.3% for AGIs below $25k, 1.8% for AGIs $25k-50k, 5.6% for AGIs $50k-75k, 1.8% for AGIs $100k-200k)
Taxable individual retirement arrangement distribution: $19,500 (reported on 14.1% of returns)
55384:
$19,500
Minnesota:
$15,212
(% of AGI for various income ranges: 6.1% for AGIs below $25k, 2.1% for AGIs $25k-50k, 9.9% for AGIs $50k-75k, 10.4% for AGIs $100k-200k)
Total itemized deductions: $27,379 (19% of AGI, reported on 34.3% of returns)
Here:
$27,379
State:
$24,665
Here:
19.3% of AGI
State:
19.6% of AGI
(% of AGI for various income ranges: 15.2% for AGIs below $25k, 9.1% for AGIs $25k-50k, 14.0% for AGIs $50k-75k, 16.3% for AGIs $75k-100k, 15.7% for AGIs $100k-200k, 13.3% for AGIs over 200k)
Charity contributions: $3,266 (reported on 29.3% of returns)
Here:
$3,266
State:
$3,948
(% of AGI for various income ranges: 1.3% for AGIs below $25k, 0.6% for AGIs $25k-50k, 1.0% for AGIs $50k-75k, 1.6% for AGIs $75k-100k, 2.1% for AGIs $100k-200k, 1.3% for AGIs over 200k)
Taxes paid: $13,215 (reported on 33.3% of returns)
55384:
$13,215
State:
$10,589
(% of AGI for various income ranges: 2.0% for AGIs below $25k, 2.3% for AGIs $25k-50k, 4.5% for AGIs $50k-75k, 5.8% for AGIs $75k-100k, 7.4% for AGIs $100k-200k, 8.9% for AGIs over 200k)
Earned income credit: $1,356 (reported on 9.1% of returns)
Here:
$1,356
State:
$2,037
(% of AGI for various income ranges: 2.2% for AGIs below $25k, 0.3% for AGIs $25k-50k)
Percentage of individuals using paid preparers for their 2012 taxes: 56.6%
Here:
57%
State:
55%
(% for various income ranges: 52.8% for AGIs below $25k, 46.2% for AGIs $25k-50k, 58.3% for AGIs $50k-75k, 62.5% for AGIs $75k-100k, 72.7% for AGIs $100k-200k, 83.3% for AGIs over 200k)
Averages for the 2004 tax year for zip code 55384, filed in 2005:
Average Adjusted Gross Income (AGI) in 2004: $56,989 (Individual Income Tax Returns)
Here:
$56,989
State:
$53,560
Salary/wage: $48,964 (reported on 72.0% of returns)
Here:
$48,964
State:
$46,177
(% of AGI for various income ranges: 55.6% for AGIs below $10k, 59.8% for AGIs $10k-25k, 77.6% for AGIs $25k-50k, 69.6% for AGIs $50k-75k, 71.6% for AGIs $75k-100k, 52.9% for AGIs over 100k)
Taxable interest for individuals: $1,835 (reported on 44.1% of returns)
This zip code:
$1,835
Minnesota:
$1,796
(% of AGI for various income ranges: 11.5% for AGIs below $10k, 4.4% for AGIs $10k-25k, 2.2% for AGIs $25k-50k, 1.3% for AGIs $50k-75k, 1.1% for AGIs $75k-100k, 0.5% for AGIs over 100k)
Taxable dividends: $3,066 (reported on 32.9% of returns)
Here:
$3,066
State:
$3,096
(% of AGI for various income ranges: 8.7% for AGIs below $10k, 5.9% for AGIs $10k-25k, 2.7% for AGIs $25k-50k, 1.1% for AGIs $50k-75k, 0.6% for AGIs $75k-100k, 1.0% for AGIs over 100k)
Net capital gain/loss: +$11,802 (reported on 27.9% of returns)
Here:
+$11,802
State:
+$10,864
(% of AGI for various income ranges: -5.5% for AGIs below $10k, -0.8% for AGIs $10k-25k, 1.0% for AGIs $25k-50k, 1.8% for AGIs $50k-75k, 0.4% for AGIs $75k-100k, 10.7% for AGIs over 100k)
Profit/loss from business: +$7,495 (reported on 12.8% of returns)
Here:
+$7,495
State:
+$10,442
(% of AGI for various income ranges: 14.5% for AGIs below $10k, 6.5% for AGIs $10k-25k, 2.7% for AGIs $25k-50k, 0.3% for AGIs $75k-100k, 0.9% for AGIs over 100k)
Total itemized deductions: $22,557 (20% of AGI, reported on 34.4% of returns)
Here:
$22,557
State:
$20,035
Here:
19.5% of AGI
State:
21.3% of AGI
(% of AGI for various income ranges: 18.6% for AGIs $10k-25k, 10.1% for AGIs $25k-50k, 16.6% for AGIs $50k-75k, 19.0% for AGIs $75k-100k, 12.7% for AGIs over 100k)
Charity contributions deductions: $2,721 (2% of AGI, reported on 30.5% of returns)
Here:
$2,721
State:
$3,333
Here:
2.2% of AGI
State:
3.4% of AGI
(% of AGI for various income ranges: 1.7% for AGIs $10k-25k, 1.2% for AGIs $25k-50k, 1.7% for AGIs $50k-75k, 1.4% for AGIs $75k-100k, 1.5% for AGIs over 100k)
Total tax: $9,892 (reported on 82.2% of returns)
55384:
$9,892
State:
$8,485
(% of AGI for various income ranges: 3.4% for AGIs below $10k, 5.1% for AGIs $10k-25k, 8.6% for AGIs $25k-50k, 10.4% for AGIs $50k-75k, 12.1% for AGIs $75k-100k, 19.3% for AGIs over 100k)
Earned income credit: $1,146 (reported on 5.5% of returns)
Here:
$1,146
State:
$1,523
Percentage of individuals using paid preparers for their 2004 taxes: 57.5%
Here:
58%
State:
59%
(% for various income ranges: 59.3% for AGIs below $10k, 64.4% for AGIs $10k-25k, 50.0% for AGIs $25k-50k, 49.4% for AGIs $50k-75k, 58.0% for AGIs $75k-100k, 66.3% for AGIs over 100k)
Household received Food Stamps/SNAP in the past 12 months: 90 Household did not receive Food Stamps/SNAP in the past 12 months: 1,164
Women who had a birth in the past 12 months: 6 (6 now married, 0 unmarried) Women who did not have a birth in the past 12 months: 349 (41 now married, 307 unmarried)
Housing units in zip code 55384 with a mortgage: 138 (16 second mortgage, 16 both second mortgage and home equity loan) Median monthly owner costs for units with a mortgage: $2,394 Median monthly owner costs for units without a mortgage: $1,032
Residents with income below the poverty level in 2022:
This zip code:
9.0%
Whole state:
9.6%
Residents with income below 50% of the poverty level in 2022:
This zip code:
4.9%
Whole state:
5.2%
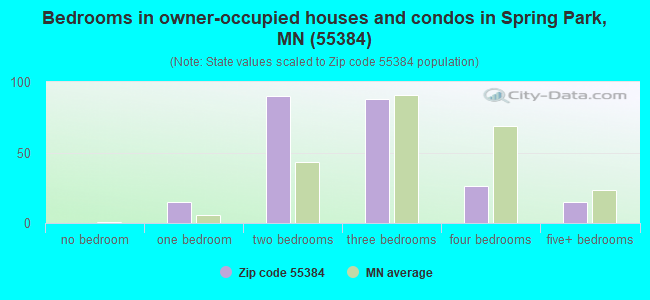
Median number of rooms in houses and condos:
Here:
6.3
State:
7.1
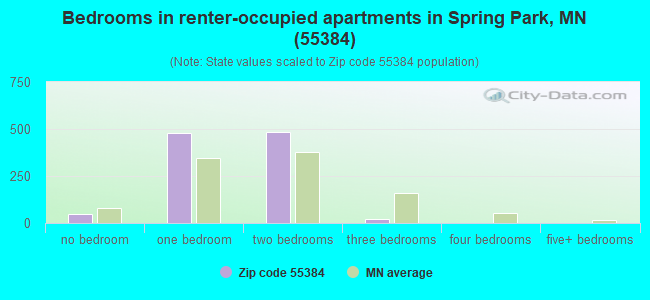
Median number of rooms in apartments:
Here:
3.5
State:
3.8
Notable locations in this zip code not listed on our city pages
In group quarters: 123 (-1 institutionalized population)
Size of family households: 286 2-persons, 93 3-persons, 11 4-persons, 7 5-persons, 5 6-persons
Size of nonfamily households: 830 1-person, 34 2-persons
24 married couples with children.
125 single-parent households (125 women).
96.2% of residents of 55384 zip code speak English at home.
0.3% of residents speak Spanish at home (100% very well).
1.6% of residents speak other Indo-European language at home (87% very well, 13% well).
1.0% of residents speak Asian or Pacific Island language at home (65% well, 35% not at all).
1.6% of residents speak other language at home (73% very well, 27% not well).
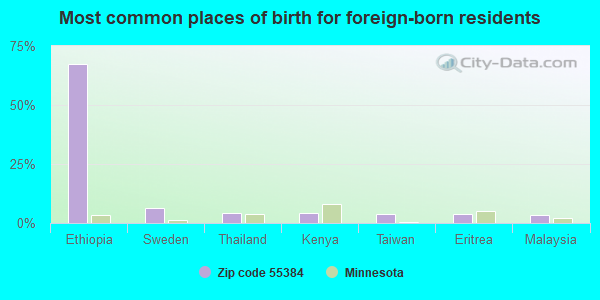
Foreign born population: 179 (9.3%) (20.7% of them are naturalized citizens)
This zip code:
9.3%
Whole state:
8.7%
67%Ethiopia
7%Sweden
4%Thailand
4%Kenya
4%Taiwan
4%Eritrea
3%Malaysia
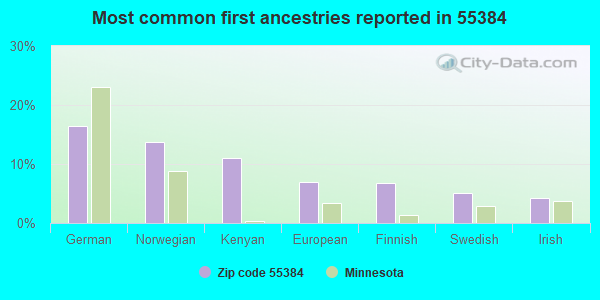
16%German
14%Norwegian
11%Kenyan
7%European
7%Finnish
5%Swedish
4%Irish
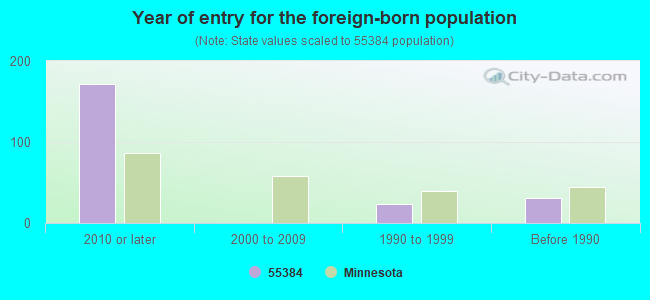
Year of entry for the foreign-born population
1712010 or later
02000 to 2009
241990 to 1999
31Before 1990
Facilities with environmental interests located in this zip code:
BOOMRANG LABORATORIES (4164 SHORELINE DRIVE in SPRING PARK, MN)
STATE MASTER (Minnesota Pollution Control Agency permits and compilance tracking) - PCS-A00008880, NPDES STORMWATER PERMIT, PCS-MN0066508, NPDES NON-MAJOR National Pollutant Discharge Elimination System NON-MAJOR (Tracking pollutant discharge elimination systems) - permit Conditionally Exempt Small Quantity Generators, less than 100 kg/month of hazardous waste (Resource Conservation and Recovery Act (tracking hazardous waste)) - notification USED OIL PROGRAM (Resource Conservation and Recovery Act (tracking hazardous waste)) Business SIC classification: PERFUMES, COSMETICS, AND OTHER TOILET PREPARATIONS Organizations: MYBERG HANING YOSS GRANSTROM WAKEFIE (CONTACT/OWNER)
, BOOMERANG LABORATORIES INC (CONTACT/OWNER)
Alternative names: BOOMERANG LABORATORIES
ADVANCE MACHINE COMPANY (4080 SUNSET DRIVE in SPRING PARK, MN)
STATE MASTER (Minnesota Pollution Control Agency permits and compilance tracking) - PCS-MN0066648, NPDES NON-MAJOR, RCRIS-MND006249338, SQG National Pollutant Discharge Elimination System NON-MAJOR (Tracking pollutant discharge elimination systems) - permit Small Quantity Generators, between 100 kg and 1000 kg of hazardous waste/month (Resource Conservation and Recovery Act (tracking hazardous waste)) - notification Organizations: NILFISK-ADVANCE INC (CONTACT/OWNER)
Alternative names: FORMER ADVANCE MACHINE CO
HASBRO INC (4144 SHORELINE DR in SPRING PARK, MN)
STATE MASTER (Minnesota Pollution Control Agency permits and compilance tracking) - RCRAINFO-MN0000995779, CESQG, RCRIS-MN0000995779, (Resource Conservation and Recovery Act (tracking hazardous waste)) Organizations: BALBOA MINNESOTA CO (CONTACT/OWNER)
PERFORMANCE MARINE (4144 SHORELINE DRIVE in SPRING PARK, MN) . Federal Facility. UNDETERMINED OR UNKNOWN AGENCY AFFILIATION
STATE MASTER (Minnesota Pollution Control Agency permits and compilance tracking) - RCRAINFO-MND048341713, CESQG, RCRIS-MND048341713, Conditionally Exempt Small Quantity Generators, less than 100 kg/month of hazardous waste (Resource Conservation and Recovery Act (tracking hazardous waste)) - notification Business SIC classification: GAMES, TOYS, AND CHILDREN'S VEHICLES, EXCEPT DOLLS AND BICYCLES Organizations: BUTLER CHRIS (CONTACT/OWNER)
BRANDENBURG CRAIG DDS LTD (4165 SHORELINE DR in SPRING PARK, MN)
STATE MASTER (Minnesota Pollution Control Agency permits and compilance tracking) - RCRAINFO-MNR000017749, CESQG, RCRIS-MNR000017749, Conditionally Exempt Small Quantity Generators, less than 100 kg/month of hazardous waste (Resource Conservation and Recovery Act (tracking hazardous waste)) - notification Business SIC classification: HEALTH AND ALLIED SERVICES Organizations: BRANDENBURG CRAIG J (CONTACT/OWNER)
, BRANDENBURG CRAIG J DDS LTD (CONTACT/OWNER)
Alternative names: BRANDENBURG CRAIG J DDS LTD
277 WESTONKA ALC (4388 SHORELINE DR. in SPRING PARK, MN)
(National Center for Education Statistics) - STATE ID-060287649 Organizations: INTERMEDIATE SCHOOL DISTRICT 287 (SCHOOL DISTRICT)
A VETS GARAGE (4037 SUNSET DR in SPRING PARK, MN)
(Resource Conservation and Recovery Act (tracking hazardous waste))
MINNTONKA MIST (4050 SHORELINE DR in SPRING PARK, MN)
(Resource Conservation and Recovery Act (tracking hazardous waste)) Organizations: THE CONERSTONE GROUP (CONTACT/OWNER)
HC SHERIFF WATER PATROL (4141 SHORELINE DR MC743 in SPRING PARK, MN)
Conditionally Exempt Small Quantity Generators, less than 100 kg/month of hazardous waste (Resource Conservation and Recovery Act (tracking hazardous waste)) - notification Organizations: HENNEPIN COUNTY (CONTACT/OWNER)
FAMILY & COSMETIC GENTLE DENTISTRY LTD 3 (4787 SHORELINE DR in SPRING PARK, MN)
Conditionally Exempt Small Quantity Generators, less than 100 kg/month of hazardous waste (Resource Conservation and Recovery Act (tracking hazardous waste))
Housing units lacking complete plumbing facilities: 0.2% Housing units lacking complete kitchen facilities: 2.5%
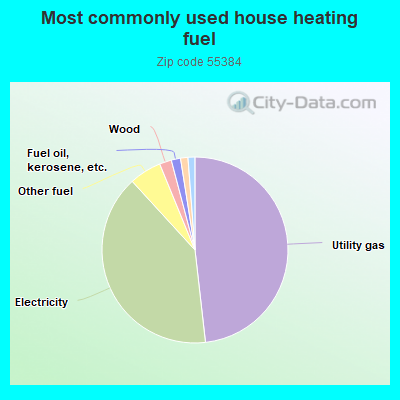
48.3%Utility gas
40.1%Electricity
5.6%Other fuel
2.1%Wood
1.6%Fuel oil, kerosene, etc.
1.3%Bottled, tank, or LP gas
1.2%No fuel used
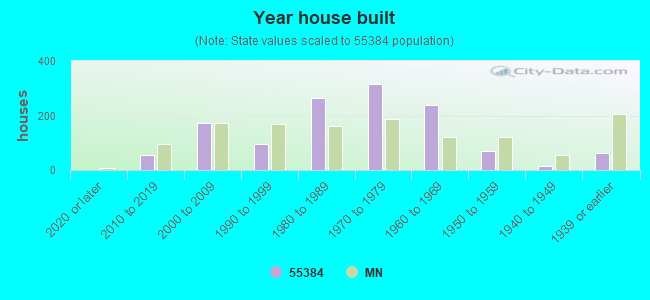
Population in 1990: 1,571.
Place of birth for U.S.-born residents:
This state: 1,237
Northeast: 33
Midwest: 343
South: 47
West: 56
37% of the 55384 zip code residents lived in the same house 5 years ago. Out of people who lived in different houses, 61% lived in this county. Out of people who lived in different counties, 50% lived in Minnesota.
82% of the 55384 zip code residents lived in the same house 1 year ago. Out of people who lived in different houses, 59% moved from this county. Out of people who lived in different houses, 22% moved from different county within same state. Out of people who lived in different houses, 8% moved from different state. Out of people who lived in different houses, 7% moved from abroad.
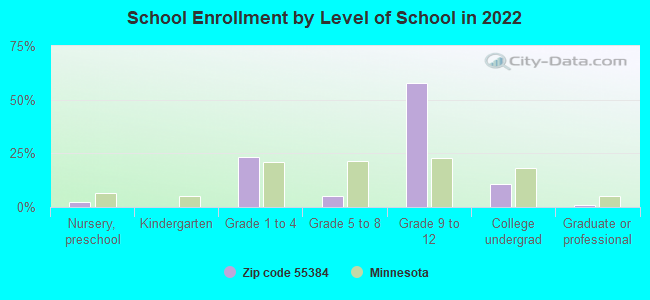
Private vs. public school enrollment:
Students in private schools in grades 1 to 8 (elementary and middle school): 13
Here:
20.0%
Minnesota:
12.9%
Students in private schools in grades 9 to 12 (high school): 13
Here:
9.8%
Minnesota:
8.6%
Students in private undergraduate colleges:
Here:
0.0%
Minnesota:
26.2%
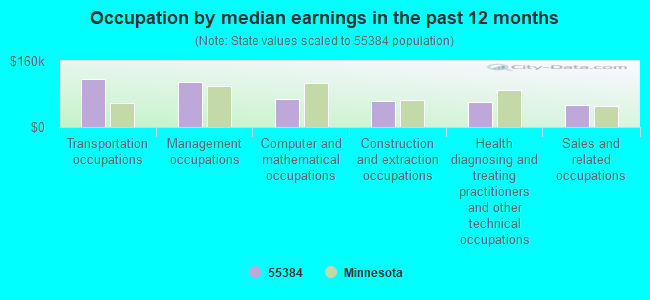
Occupation by median earnings in the past 12 months ($)
116,311Transportation occupations
109,351Management occupations
68,665Computer and mathematical occupations
63,970Construction and extraction occupations
61,720Health diagnosing and treating practitioners and other technical occupations
52,977Sales and related occupations
Companies with federal contracts located in this zip code:
ION TECHNOLOGIES INCORPORATED (4165 SHORELINE DR STE 20 in SPRING PARK, MN; small business)
$53,925 with Army for ADP Software. Taking place in AR. Signed on 2002-08-15. Completion date: 2002-08-23.
Top industries in this zip code by the number of employees in 2005:
Real Estate and Rental and Leasing: Lessors of Residential Buildings and Dwellings (100-249 employees: 1 establishment, 1-4 employees: 1 establishment)
Health Care and Social Assistance: Nursing Care Facilities (100-249: 1)
Health Care and Social Assistance: Offices of Dentists (20-49: 1)
Wholesale Trade: Industrial Machinery and Equipment Merchant Wholesalers (20-49: 1)
Accommodation and Food Services: Full-Service Restaurants (5-9: 3, 1-4: 1)
Real Estate and Rental and Leasing: Offices of Real Estate Agents and Brokers (5-9: 1, 1-4: 6)
People in group quarters in 2010:
173 people in nursing facilities/skilled-nursing facilities
People in group quarters in 2000:
200 people in nursing homes
Home Mortgage Disclosure Act Aggregated Statistics For Year 2009 (Based on 2 partial tracts)
A) FHA, FSA/RHS & VA Home Purchase Loans
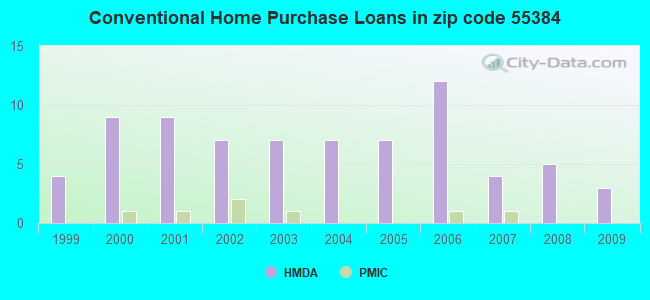
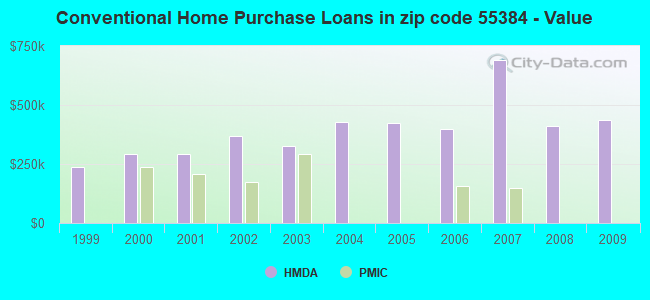
B) Conventional Home Purchase Loans
C) Refinancings
F) Non-occupant Loans on < 5 Family Dwellings (A B C & D)
Number
Average Value
Number
Average Value
Number
Average Value
Number
Average Value
LOANS ORIGINATED
1
$237,110
3
$434,563
11
$403,882
1
$277,680
APPLICATIONS APPROVED, NOT ACCEPTED
0
$0
0
$0
1
$526,470
0
$0
APPLICATIONS DENIED
0
$0
1
$567,730
4
$505,845
1
$170,410
APPLICATIONS WITHDRAWN
0
$0
0
$0
2
$580,450
1
$157,350
FILES CLOSED FOR INCOMPLETENESS
0
$0
0
$0
1
$193,900
0
$0
Aggregated Statistics For Year 2008 (Based on 2 partial tracts)
A) FHA, FSA/RHS & VA Home Purchase Loans
B) Conventional Home Purchase Loans
C) Refinancings
D) Home Improvement Loans
F) Non-occupant Loans on < 5 Family Dwellings (A B C & D)
Number
Average Value
Number
Average Value
Number
Average Value
Number
Average Value
Number
Average Value
LOANS ORIGINATED
1
$115,170
5
$411,850
7
$432,583
1
$299,910
2
$392,045
APPLICATIONS APPROVED, NOT ACCEPTED
0
$0
1
$221,980
1
$146,000
0
$0
0
$0
APPLICATIONS DENIED
0
$0
1
$135,690
3
$724,653
0
$0
0
$0
APPLICATIONS WITHDRAWN
0
$0
0
$0
1
$737,220
0
$0
0
$0
FILES CLOSED FOR INCOMPLETENESS
0
$0
0
$0
1
$425,050
0
$0
0
$0
Aggregated Statistics For Year 2007 (Based on 2 partial tracts)
B) Conventional Home Purchase Loans
C) Refinancings
D) Home Improvement Loans
E) Loans on Dwellings For 5+ Families
F) Non-occupant Loans on < 5 Family Dwellings (A B C & D)
Number
Average Value
Number
Average Value
Number
Average Value
Number
Average Value
Number
Average Value
LOANS ORIGINATED
4
$690,380
8
$646,186
1
$224,160
1
$779,280
2
$814,750
APPLICATIONS APPROVED, NOT ACCEPTED
1
$712,810
1
$740,320
0
$0
0
$0
1
$274,700
APPLICATIONS DENIED
1
$398,690
5
$549,278
1
$37,130
0
$0
1
$872,450
APPLICATIONS WITHDRAWN
1
$1,007,790
1
$742,610
0
$0
0
$0
0
$0
FILES CLOSED FOR INCOMPLETENESS
0
$0
1
$340,820
0
$0
0
$0
0
$0
Aggregated Statistics For Year 2006 (Based on 2 partial tracts)
B) Conventional Home Purchase Loans
C) Refinancings
D) Home Improvement Loans
F) Non-occupant Loans on < 5 Family Dwellings (A B C & D)
Number
Average Value
Number
Average Value
Number
Average Value
Number
Average Value
LOANS ORIGINATED
12
$399,897
10
$492,047
2
$352,110
6
$305,505
APPLICATIONS APPROVED, NOT ACCEPTED
2
$219,175
2
$357,780
0
$0
1
$64,290
APPLICATIONS DENIED
5
$214,118
3
$456,833
0
$0
1
$201,810
APPLICATIONS WITHDRAWN
1
$624,460
3
$433,340
0
$0
1
$267,250
FILES CLOSED FOR INCOMPLETENESS
0
$0
1
$276,420
0
$0
0
$0
Aggregated Statistics For Year 2005 (Based on 2 partial tracts)
B) Conventional Home Purchase Loans
C) Refinancings
D) Home Improvement Loans
F) Non-occupant Loans on < 5 Family Dwellings (A B C & D)
Number
Average Value
Number
Average Value
Number
Average Value
Number
Average Value
LOANS ORIGINATED
7
$422,170
13
$451,471
1
$454,620
2
$391,815
APPLICATIONS APPROVED, NOT ACCEPTED
0
$0
2
$412,330
0
$0
0
$0
APPLICATIONS DENIED
2
$241,980
4
$395,658
1
$159,640
0
$0
APPLICATIONS WITHDRAWN
1
$769,770
3
$390,403
0
$0
0
$0
FILES CLOSED FOR INCOMPLETENESS
0
$0
1
$130,870
0
$0
0
$0
Aggregated Statistics For Year 2004 (Based on 2 partial tracts)
B) Conventional Home Purchase Loans
C) Refinancings
D) Home Improvement Loans
F) Non-occupant Loans on < 5 Family Dwellings (A B C & D)
Number
Average Value
Number
Average Value
Number
Average Value
Number
Average Value
LOANS ORIGINATED
7
$427,196
13
$395,405
2
$119,530
2
$378,125
APPLICATIONS APPROVED, NOT ACCEPTED
1
$646,460
1
$913,020
0
$0
0
$0
APPLICATIONS DENIED
1
$707,310
4
$313,632
1
$85,610
1
$239,060
APPLICATIONS WITHDRAWN
1
$476,620
3
$519,557
0
$0
0
$0
FILES CLOSED FOR INCOMPLETENESS
0
$0
1
$344,830
0
$0
0
$0
Aggregated Statistics For Year 2003 (Based on 2 partial tracts)
B) Conventional Home Purchase Loans
C) Refinancings
D) Home Improvement Loans
F) Non-occupant Loans on < 5 Family Dwellings (A B C & D)
Number
Average Value
Number
Average Value
Number
Average Value
Number
Average Value
LOANS ORIGINATED
7
$324,793
40
$313,216
2
$91,335
3
$253,647
APPLICATIONS APPROVED, NOT ACCEPTED
1
$482,920
4
$267,648
0
$0
0
$0
APPLICATIONS DENIED
1
$244,900
7
$328,116
1
$27,390
0
$0
APPLICATIONS WITHDRAWN
1
$356,060
5
$309,650
0
$0
0
$0
FILES CLOSED FOR INCOMPLETENESS
1
$148,870
1
$352,280
0
$0
0
$0
Aggregated Statistics For Year 2002 (Based on 2 partial tracts)
A) FHA, FSA/RHS & VA Home Purchase Loans
B) Conventional Home Purchase Loans
C) Refinancings
D) Home Improvement Loans
F) Non-occupant Loans on < 5 Family Dwellings (A B C & D)
Number
Average Value
Number
Average Value
Number
Average Value
Number
Average Value
Number
Average Value
LOANS ORIGINATED
1
$93,860
7
$369,733
29
$337,537
1
$245,010
2
$205,590
APPLICATIONS APPROVED, NOT ACCEPTED
0
$0
1
$136,600
3
$209,260
0
$0
0
$0
APPLICATIONS DENIED
0
$0
1
$303,690
3
$302,620
1
$35,870
0
$0
APPLICATIONS WITHDRAWN
0
$0
1
$253,150
4
$353,912
0
$0
0
$0
FILES CLOSED FOR INCOMPLETENESS
0
$0
0
$0
2
$229,315
0
$0
0
$0
Aggregated Statistics For Year 2001 (Based on 2 partial tracts)
B) Conventional Home Purchase Loans
C) Refinancings
D) Home Improvement Loans
F) Non-occupant Loans on < 5 Family Dwellings (A B C & D)
Number
Average Value
Number
Average Value
Number
Average Value
Number
Average Value
LOANS ORIGINATED
9
$293,974
26
$233,572
2
$57,470
2
$147,605
APPLICATIONS APPROVED, NOT ACCEPTED
0
$0
2
$190,295
0
$0
0
$0
APPLICATIONS DENIED
1
$132,360
6
$415,960
0
$0
1
$81,020
APPLICATIONS WITHDRAWN
0
$0
4
$238,025
0
$0
0
$0
FILES CLOSED FOR INCOMPLETENESS
0
$0
2
$295,325
0
$0
0
$0
Aggregated Statistics For Year 2000 (Based on 2 partial tracts)
B) Conventional Home Purchase Loans
C) Refinancings
D) Home Improvement Loans
F) Non-occupant Loans on < 5 Family Dwellings (A B C & D)
Number
Average Value
Number
Average Value
Number
Average Value
Number
Average Value
LOANS ORIGINATED
9
$293,541
6
$234,318
3
$88,050
1
$270,460
APPLICATIONS APPROVED, NOT ACCEPTED
1
$128,810
1
$190,470
0
$0
0
$0
APPLICATIONS DENIED
1
$199,750
3
$239,667
0
$0
0
$0
APPLICATIONS WITHDRAWN
1
$109,790
2
$202,385
0
$0
0
$0
FILES CLOSED FOR INCOMPLETENESS
0
$0
0
$0
0
$0
0
$0
Aggregated Statistics For Year 1999 (Based on 1 partial tract)
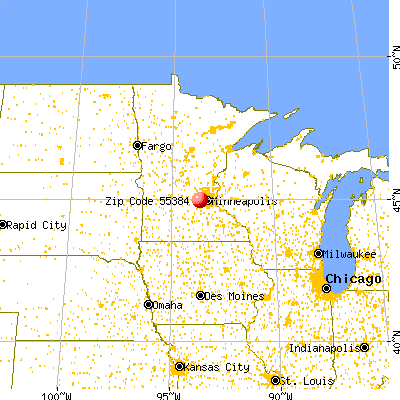


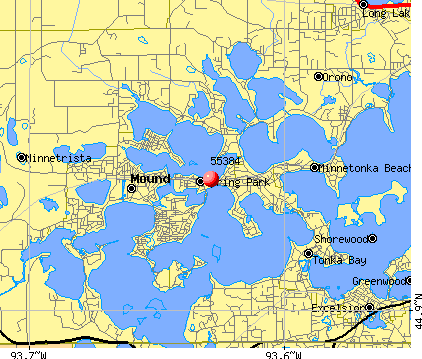 Nearest zip codes: 55364, 55331, 55356, 55386, 55391, 55375.