Estimated zip code population in 2022: 1,327 Zip code population in 2010: 1,170 Zip code population in 2000: 987
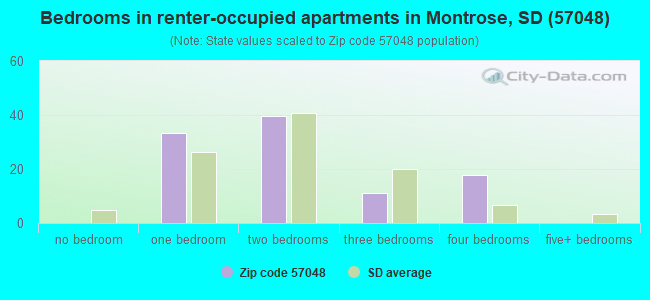
Houses and condos: 593 Renter-occupied apartments: 103
% of renters here:
19%
State:
30%
March 2022 cost of living index in zip code 57048: 77.5 (low, U.S. average is 100)
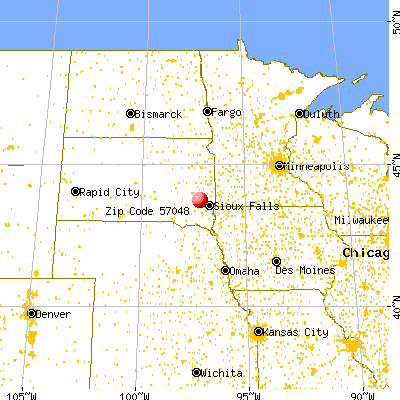
Land area: 127.7 sq. mi. Water area: 0.4 sq. mi.
Population density: 10 people per square mile
(very low).
OSM Map
General Map
Google Map
MSN Map
OSM Map
General Map
Google Map
MSN Map
OSM Map
General Map
Google Map
MSN Map
OSM Map
General Map
Google Map
MSN Map
Please wait while loading the map...
Real estate property taxes paid for housing units in 2022:
This zip code:
0.6% ($1,984)
South Dakota:
1.0% ($2,481)
Median real estate property taxes paid for housing units with mortgages in 2022: $1,957 (0.6%) Median real estate property taxes paid for housing units with no mortgage in 2022: $2,348 (0.9%)
Business Search- 14 Million verified businesses
Males: 636
(48.0%)
Females: 690
(52.0%)
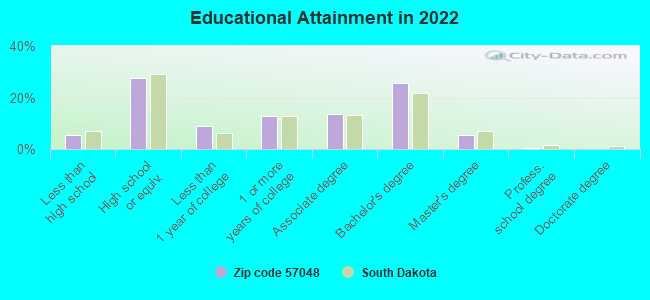
For population 25 years and over in 57048:
High school or higher: 93.5%
Bachelor's degree or higher: 31.1%
Graduate or professional degree: 5.7%
Unemployed: 3.1%
Mean travel time to work (commute): 34.4 minutes
For population 15 years and over in 57048:
Never married: 24.0%
Now married: 65.3%
Separated: 1.2%
Widowed: 3.3%
Divorced: 6.2%
Zip code 57048 compared to state average:
Black race population percentage significantly below state average.
Median age above state average.
Foreign-born population percentage significantly below state average.
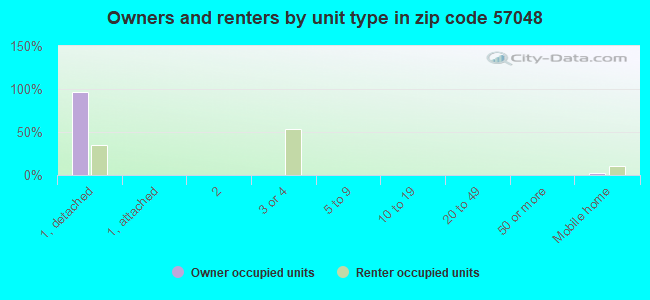
Renting percentage below state average.
Length of stay since moving in significantly above state average.
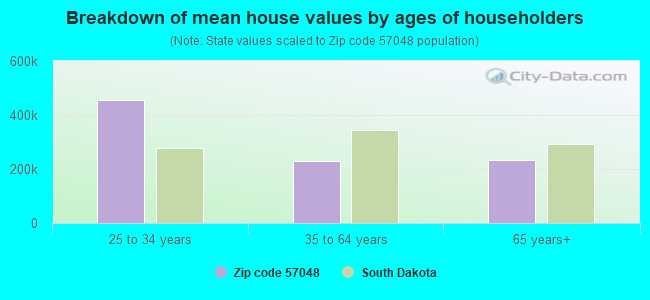
Estimated median house/condo value in 2022: $319,784
57048:
$319,784
South Dakota:
$245,000
According to our research of South Dakota and other state lists, there were 3 registered sex offenders living in 57048 zip code as of April 23, 2024. The ratio of all residents to sex offenders in zip code 57048 is 394 to 1. The ratio of registered sex offenders to all residents in this zip code is lower than the state average.
Median resident age:
This zip code:
42.5 years
South Dakota median age:
38.5 years
Average household size:
This zip code:
2.5 people
South Dakota:
2.4 people
Averages for the 2020 tax year for zip code 57048, filed in 2021:
Average Adjusted Gross Income (AGI) in 2020: $73,454 (Individual Income Tax Returns)
Here:
$73,454
State:
$75,230
Salary/wage: $58,468 (reported on 84.6% of returns)
Here:
$58,468
State:
$54,824
(% of AGI for various income ranges: 1286.7% for AGIs below $25k, 3653.3% for AGIs $25k-50k, 8210.0% for AGIs $50k-75k, 9240.0% for AGIs $75k-100k, 22465.0% for AGIs $100k-200k)
Taxable interest for individuals: $1,235 (reported on 38.5% of returns)
This zip code:
$1,235
South Dakota:
$2,207
(% of AGI for various income ranges: 7.8% for AGIs below $25k, 60.0% for AGIs $25k-50k, 20.0% for AGIs $50k-75k, 67.5% for AGIs $75k-100k, 248.3% for AGIs $100k-200k)
Ordinary dividends: $2,318 (reported on 21.2% of returns)
Here:
$2,318
State:
$6,303
(% of AGI for various income ranges: 43.3% for AGIs below $25k, 144.0% for AGIs $50k-75k, 240.0% for AGIs $100k-200k)
Net capital gain/loss in AGI: +$4,240 (reported on 19.2% of returns)
Here:
+$4,240
State:
+$27,098
(% of AGI for various income ranges: 124.4% for AGIs below $25k, 178.0% for AGIs $50k-75k, 371.7% for AGIs $100k-200k)
Profit/loss from business: +$9,011 (reported on 17.3% of returns)
Here:
+$9,011
State:
+$13,092
(% of AGI for various income ranges: 96.7% for AGIs below $25k, 438.0% for AGIs $50k-75k, 841.7% for AGIs $100k-200k)
Taxable individual retirement arrangement distribution: $8,320 (reported on 9.6% of returns)
57048:
$8,320
South Dakota:
$17,605
(% of AGI for various income ranges: 232.2% for AGIs $25k-50k, 517.5% for AGIs $75k-100k)
Earned income credit: $2,150 (reported on 7.7% of returns)
Here:
$2,150
State:
$2,165
(% of AGI for various income ranges: 95.6% for AGIs below $25k)
Percentage of individuals using paid preparers for their 2020 taxes: 94.2%
Here:
94%
State:
95%
(% for various income ranges: 92.3% for AGIs below $25k, 100.0% for AGIs $25k-50k, 100.0% for AGIs $50k-75k, 85.7% for AGIs $75k-100k, 90.9% for AGIs $100k-200k, 100.0% for AGIs over 200k)
Averages for the 2012 tax year for zip code 57048, filed in 2013:
Average Adjusted Gross Income (AGI) in 2012: $57,867 (Individual Income Tax Returns)
Here:
$57,867
State:
$58,425
Salary/wage: $40,621 (reported on 87.8% of returns)
Here:
$40,621
State:
$41,676
(% of AGI for various income ranges: 78.3% for AGIs below $25k, 79.9% for AGIs $25k-50k, 73.5% for AGIs $50k-75k, 75.1% for AGIs $75k-100k, 37.9% for AGIs $100k-200k)
Taxable interest for individuals: $900 (reported on 36.7% of returns)
This zip code:
$900
South Dakota:
$2,148
(% of AGI for various income ranges: 0.7% for AGIs below $25k, 1.6% for AGIs $25k-50k, 0.4% for AGIs $50k-75k, 0.3% for AGIs $75k-100k, 0.4% for AGIs $100k-200k)
Ordinary dividends: $1,222 (reported on 18.4% of returns)
Here:
$1,222
State:
$6,197
(% of AGI for various income ranges: 1.2% for AGIs below $25k, 0.5% for AGIs $50k-75k, 0.6% for AGIs $100k-200k)
Net capital gain/loss in AGI: +$2,840 (reported on 20.4% of returns)
Here:
+$2,840
State:
+$21,273
(% of AGI for various income ranges: 3.7% for AGIs $25k-50k, 0.3% for AGIs $75k-100k, 1.0% for AGIs $100k-200k)
Profit/loss from business: +$2,538 (reported on 16.3% of returns)
Here:
+$2,538
State:
+$11,552
Taxable individual retirement arrangement distribution: $4,675 (reported on 8.2% of returns)
57048:
$4,675
South Dakota:
$12,416
Total itemized deductions: $16,662 (15% of AGI, reported on 16.3% of returns)
Here:
$16,662
State:
$21,763
Here:
14.8% of AGI
State:
16.0% of AGI
(% of AGI for various income ranges: 18.2% for AGIs below $25k, 7.2% for AGIs $50k-75k, 5.3% for AGIs $100k-200k)
Charity contributions: $2,520 (reported on 10.2% of returns)
Here:
$2,520
State:
$5,927
(% of AGI for various income ranges: 1.6% for AGIs $25k-50k, 0.5% for AGIs $100k-200k)
Taxes paid: $3,112 (reported on 16.3% of returns)
57048:
$3,112
State:
$5,214
Earned income credit: $1,867 (reported on 12.2% of returns)
Here:
$1,867
State:
$2,081
(% of AGI for various income ranges: 3.7% for AGIs below $25k, 1.0% for AGIs $25k-50k)
Percentage of individuals using paid preparers for their 2012 taxes: 63.3%
Here:
63%
State:
55%
(% for various income ranges: 50.0% for AGIs below $25k, 58.3% for AGIs $25k-50k, 77.8% for AGIs $50k-75k, 83.3% for AGIs $75k-100k, 66.7% for AGIs $100k-200k)
Averages for the 2004 tax year for zip code 57048, filed in 2005:
Average Adjusted Gross Income (AGI) in 2004: $42,772 (Individual Income Tax Returns)
Here:
$42,772
State:
$41,242
Salary/wage: $35,654 (reported on 89.0% of returns)
Here:
$35,654
State:
$32,969
(% of AGI for various income ranges: 244.4% for AGIs below $10k, 73.4% for AGIs $10k-25k, 81.1% for AGIs $25k-50k, 84.6% for AGIs $50k-75k, 85.4% for AGIs $75k-100k, 31.3% for AGIs over 100k)
Taxable interest for individuals: $1,273 (reported on 48.7% of returns)
This zip code:
$1,273
South Dakota:
$2,098
(% of AGI for various income ranges: 4.4% for AGIs below $10k, 4.4% for AGIs $10k-25k, 2.1% for AGIs $25k-50k, 0.4% for AGIs $50k-75k, 0.1% for AGIs $75k-100k, 1.4% for AGIs over 100k)
Taxable dividends: $802 (reported on 22.4% of returns)
Here:
$802
State:
$2,577
(% of AGI for various income ranges: 0.8% for AGIs $10k-25k, 0.4% for AGIs $25k-50k, 0.3% for AGIs $50k-75k, 0.9% for AGIs over 100k)
Net capital gain/loss: +$5,511 (reported on 21.0% of returns)
Here:
+$5,511
State:
+$11,418
(% of AGI for various income ranges: 0.4% for AGIs $10k-25k, 3.1% for AGIs $25k-50k, 1.3% for AGIs $50k-75k, 8.2% for AGIs over 100k)
Profit/loss from business: +$6,869 (reported on 14.2% of returns)
Here:
+$6,869
State:
+$9,138
IRA payment deduction: $2,421 (reported on 4.4% of returns)
57048:
$2,421
South Dakota:
$3,029
Total itemized deductions: $15,372 (23% of AGI, reported on 18.2% of returns)
Here:
$15,372
State:
$17,139
Here:
22.9% of AGI
State:
19.0% of AGI
(% of AGI for various income ranges: 9.9% for AGIs $10k-25k, 4.0% for AGIs $25k-50k, 5.7% for AGIs $50k-75k, 8.5% for AGIs $75k-100k, 9.3% for AGIs over 100k)
Charity contributions deductions: $1,852 (3% of AGI, reported on 14.2% of returns)
Here:
$1,852
State:
$4,114
Here:
2.9% of AGI
State:
4.2% of AGI
Total tax: $4,722 (reported on 82.3% of returns)
57048:
$4,722
State:
$6,372
(% of AGI for various income ranges: 5.0% for AGIs $10k-25k, 6.9% for AGIs $25k-50k, 8.2% for AGIs $50k-75k, 10.4% for AGIs $75k-100k, 16.6% for AGIs over 100k)
Earned income credit: $1,600 (reported on 8.2% of returns)
Here:
$1,600
State:
$1,607
Percentage of individuals using paid preparers for their 2004 taxes: 69.0%
Here:
69%
State:
63%
(% for various income ranges: 55.0% for AGIs below $10k, 69.9% for AGIs $10k-25k, 70.3% for AGIs $25k-50k, 71.4% for AGIs $50k-75k, 56.0% for AGIs $75k-100k, 86.4% for AGIs over 100k)
Household received Food Stamps/SNAP in the past 12 months: 19 Household did not receive Food Stamps/SNAP in the past 12 months: 518
Women who had a birth in the past 12 months: 25 (23 now married, 0 unmarried) Women who did not have a birth in the past 12 months: 341 (186 now married, 156 unmarried)
Housing units in zip code 57048 with a mortgage: 280 (2 second mortgage) Median monthly owner costs for units with a mortgage: $1,869 Median monthly owner costs for units without a mortgage: $589
Residents with income below the poverty level in 2022:
This zip code:
11.9%
Whole state:
12.5%
Residents with income below 50% of the poverty level in 2022:
This zip code:
9.7%
Whole state:
6.8%
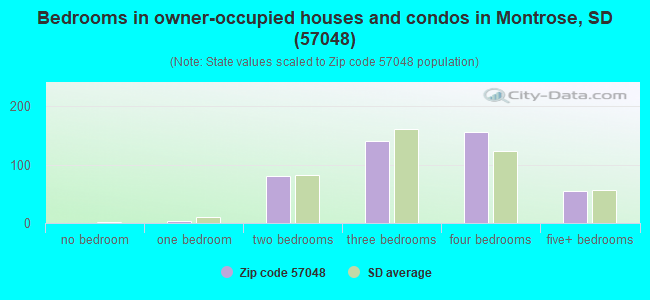
Median number of rooms in houses and condos:
Here:
7.3
State:
7.0
Median number of rooms in apartments:
Here:
3.6
State:
4.1
Notable locations in this zip code not listed on our city pages
Cemeteries: Ramsey Cemetery (1), Montrose Cemetery (2), Saint Patrick Cemetery (3), Saint Patricks Cemetery (4), Ramsey Cemetery (5), Pioneer Cemetery (6). Display/hide their locations on the map
Size of family households: 218 2-persons, 68 3-persons, 54 4-persons, 47 5-persons, 2 6-persons, 5 7-or-more-persons
Size of nonfamily households: 63 1-person, 68 2-persons
243 married couples with children.
56 single-parent households (27 men, 29 women).
97.1% of residents of 57048 zip code speak English at home.
1.2% of residents speak Spanish at home (100% very well).
0.6% of residents speak other Indo-European language at home (14% very well, 86% well).
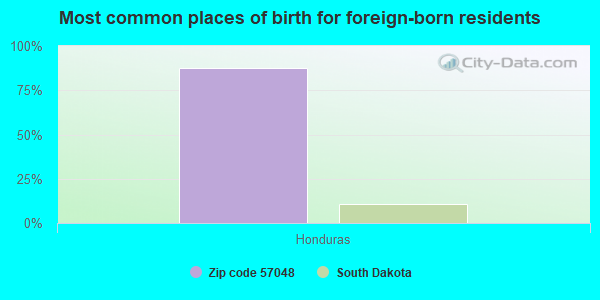
Foreign born population: 9 (0.7%) (100.0% of them are naturalized citizens)
This zip code:
0.7%
Whole state:
3.5%
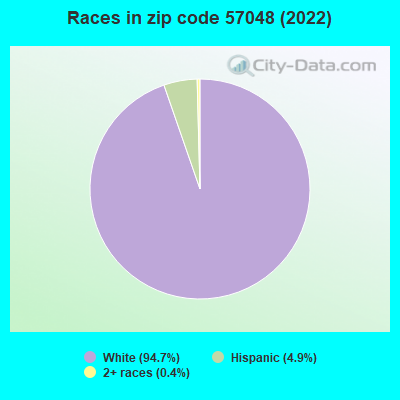
88%Honduras
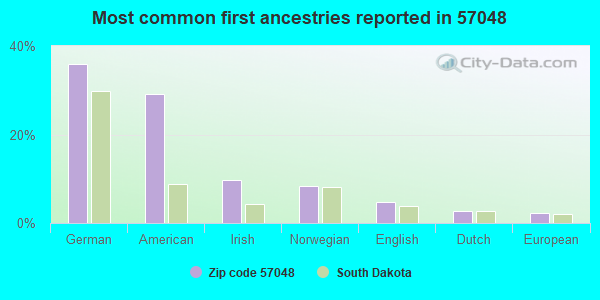
36%German
29%American
10%Irish
8%Norwegian
5%English
3%Dutch
2%European
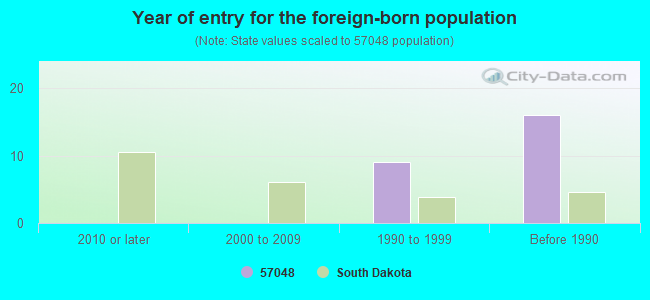
Year of entry for the foreign-born population
02010 or later
02000 to 2009
91990 to 1999
16Before 1990
Facilities with environmental interests located in this zip code:
MONTROSE ELEM (309 S CHURCH AVENUE in MONTROSE, SD)
(National Center for Education Statistics) - STATE ID-2 Organizations: MONTROSE SCHOOL DISTRICT 43-2 (SCHOOL DISTRICT)
MONTROSE HI SCH (309 S CHURCH AVENUE in MONTROSE, SD)
(National Center for Education Statistics) - STATE ID-1 Organizations: MONTROSE SCHOOL DISTRICT 43-2 (SCHOOL DISTRICT)
MONTROSE JR HI (309 S CHURCH AVENUE in MONTROSE, SD)
(National Center for Education Statistics) - STATE ID-3 Organizations: MONTROSE SCHOOL DISTRICT 43-2 (SCHOOL DISTRICT)
ORLAND COLONY ELEM (309 S CHURCH AVENUE in MONTROSE, SD)
(National Center for Education Statistics) - STATE ID-4 Organizations: MONTROSE SCHOOL DISTRICT 43-2 (SCHOOL DISTRICT)
MONTROSE - CITY OF (PO BOX 97 MCCOOK COUNTY in MONTROSE, SD)
National Pollutant Discharge Elimination System NON-MAJOR (Tracking pollutant discharge elimination systems) - permit Business SIC classification: SEWERAGE SYSTEMS Alternative names: CITY OF MONTROSE
MONTROSE SCHOOL DIST. 43-2 (112 CHURCH STREET in MONTROSE, SD)
ENFORCEMENT/COMPLIANCE ACTIVITY (Integrated Compliance Information System) Conditionally Exempt Small Quantity Generators, less than 100 kg/month of hazardous waste (Resource Conservation and Recovery Act (tracking hazardous waste)) - notification Organizations: MONTROSE SCHOOL DISTRICT #43-2 (CONTACT/OWNER)
Alternative names: MONTROSE SCHOOL DISTRICT #43-2
MONTROSE SCHOOL (RR 2 BOX 350 in MONTROSE, SD)
Conditionally Exempt Small Quantity Generators, less than 100 kg/month of hazardous waste (Resource Conservation and Recovery Act (tracking hazardous waste)) - notification
Housing units lacking complete plumbing facilities: 1.8% Housing units lacking complete kitchen facilities: 0.3%
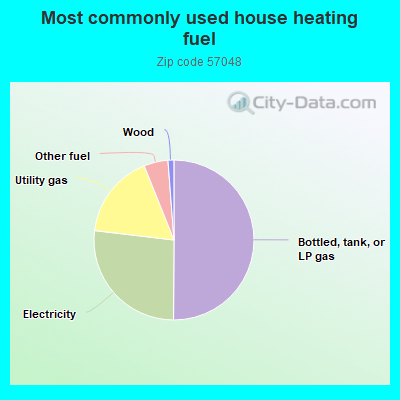
50.3%Bottled, tank, or LP gas
26.9%Electricity
17.1%Utility gas
4.9%Other fuel
1.2%Wood
Population in 1990: 958. Population change in the 1990s: +29 (+3.0%).
Place of birth for U.S.-born residents:
This state: 928
Northeast: 12
Midwest: 192
South: 37
West: 132
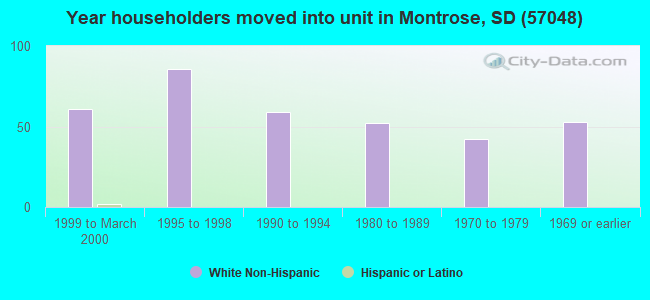
66% of the 57048 zip code residents lived in the same house 5 years ago. Out of people who lived in different houses, 37% lived in this county. Out of people who lived in different counties, 50% lived in South Dakota.
97% of the 57048 zip code residents lived in the same house 1 year ago. Out of people who lived in different houses, 33% moved from this county. Out of people who lived in different houses, 57% moved from different county within same state. Out of people who lived in different houses, 29% moved from different state.
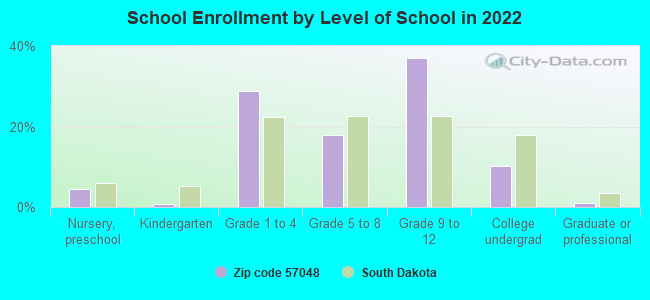
Private vs. public school enrollment:
Students in private schools in grades 1 to 8 (elementary and middle school): 9
Here:
7.2%
South Dakota:
11.9%
Students in private schools in grades 9 to 12 (high school):
Here:
0.0%
South Dakota:
7.2%
Students in private undergraduate colleges:
Here:
0.0%
South Dakota:
10.2%
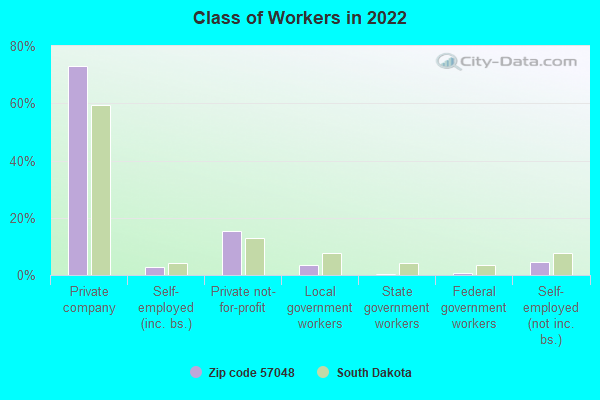
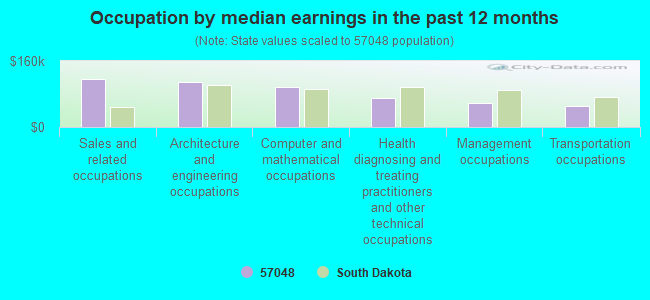
Occupation by median earnings in the past 12 months ($)
116,775Sales and related occupations
108,922Architecture and engineering occupations
95,777Computer and mathematical occupations
70,001Health diagnosing and treating practitioners and other technical occupations
57,802Management occupations
51,849Transportation occupations
Top industries in this zip code by the number of employees in 2005:
Construction: Water and Sewer Line and Related Structures Construction (5-9: 1)
Finance and Insurance: Commercial Banking (5-9: 1)
Professional, Scientific, and Technical Services: Veterinary Services (5-9: 1)
People in group quarters in 2010:
121 people in other noninstitutional facilities
Fatal accident statistics in 2013:
Fatal accident count: 1
Vehicles involved in fatal accidents: 1
Fatal accidents caused by drunken drivers: 0
Fatalities: 1
Persons involved in fatal accidents: 1
Pedestrians involved in fatal accidents: 0
Fatal accident statistics in 2012:
Fatal accident count: 1
Vehicles involved in fatal accidents: 1
Fatal accidents caused by drunken drivers: 1
Fatalities: 1
Persons involved in fatal accidents: 1
Pedestrians involved in fatal accidents: 0
2003 - 2018 National Fire Incident Reporting System (NFIRS) incidents
Based on the data from the years 2003 - 2018 the average number of fire incidents per year is 8. The highest number of fires - 17 took place in 2017, and the least - 1 in 2007. The data has a growing trend.
When looking into fire subcategories, the most reports belonged to: Outside Fires (49.6%), and Structure Fires (23.6%).
Fire incident types reported to NFIRS in Zip Code 57048


 Nearest zip codes: 57035, 57012, 57058, 57047, 57018, 57042.


 Based on the data from the years 2003 - 2018 the average number of fire incidents per year is 8. The highest number of fires - 17 took place in 2017, and the least - 1 in 2007. The data has a growing trend.
 When looking into fire subcategories, the most reports belonged to: Outside Fires (49.6%), and Structure Fires (23.6%).