Estimated zip code population in 2022: 2,331 Zip code population in 2010: 1,672 Zip code population in 2000: 1,554
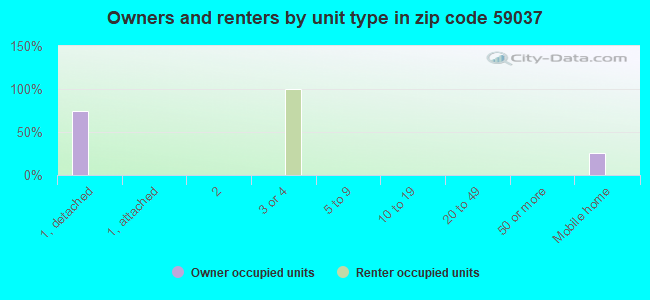
Houses and condos: 960 Renter-occupied apartments: 23
% of renters here:
3%
State:
31%
March 2022 cost of living index in zip code 59037: 85.1 (less than average, U.S. average is 100)
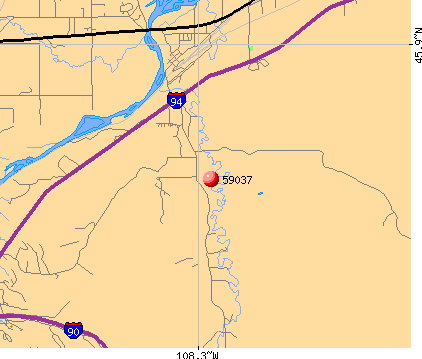
Land area: 187.7 sq. mi. Water area: 1.3 sq. mi.
Population density: 12 people per square mile
(very low).
OSM Map
General Map
Google Map
MSN Map
OSM Map
General Map
Google Map
MSN Map
OSM Map
General Map
Google Map
MSN Map
OSM Map
General Map
Google Map
MSN Map
Please wait while loading the map...
Real estate property taxes paid for housing units in 2022:
This zip code:
0.6% ($2,222)
Montana:
0.7% ($2,498)
Median real estate property taxes paid for housing units with mortgages in 2022: $2,226 (0.6%) Median real estate property taxes paid for housing units with no mortgage in 2022: $2,217 (0.7%)
Business Search- 14 Million verified businesses
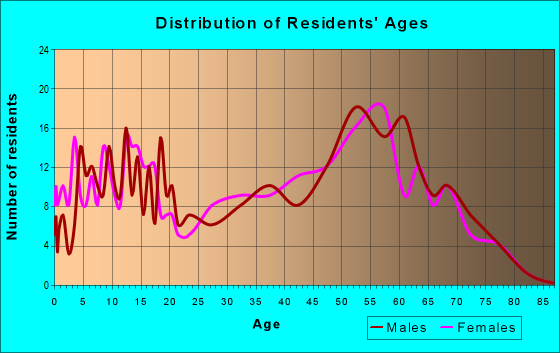
Males: 1,278
(54.9%)
Females: 1,052
(45.1%)
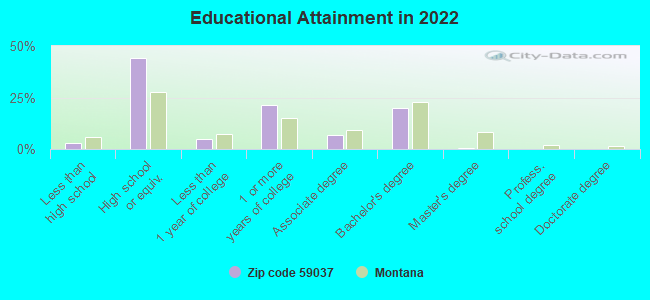
For population 25 years and over in 59037:
High school or higher: 96.4%
Bachelor's degree or higher: 20.3%
Graduate or professional degree: 0.7%
Unemployed: 0.9%
Mean travel time to work (commute): 34.7 minutes
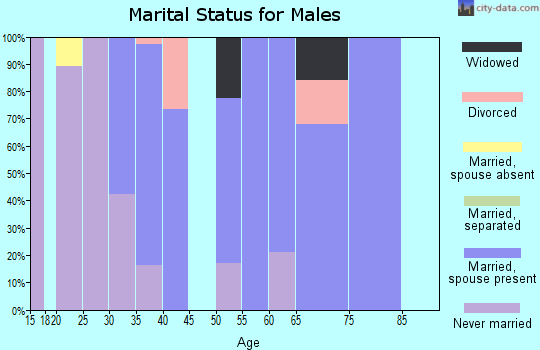
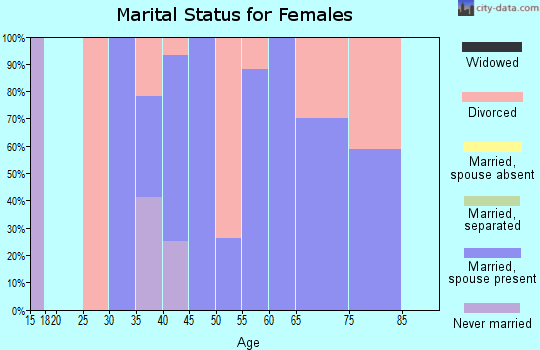
For population 15 years and over in 59037:
Never married: 23.3%
Now married: 55.8%
Separated: 0.0%
Widowed: 5.9%
Divorced: 14.9%
Zip code 59037 compared to state average:
Unemployed percentage significantly below state average.
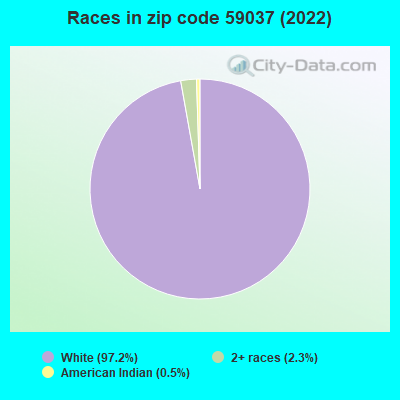
Black race population percentage significantly below state average.
Hispanic race population percentage significantly below state average.
Foreign-born population percentage significantly below state average.
Renting percentage significantly below state average.
Length of stay since moving in significantly above state average.
House age significantly below state average.
Percentage of population with a bachelor's degree or higher below state average.
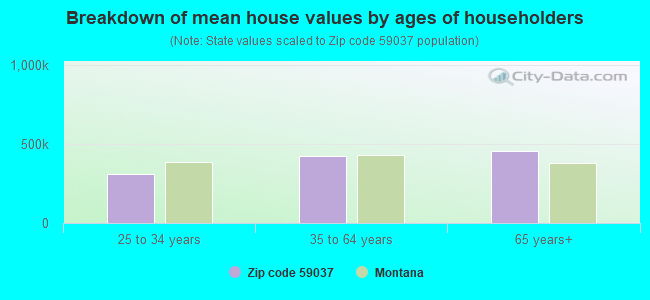
Estimated median house/condo value in 2022: $343,867
59037:
$343,867
Montana:
$366,400
According to our research of Montana and other state lists, there were 3 registered sex offenders living in 59037 zip code as of April 23, 2024. The ratio of all residents to sex offenders in zip code 59037 is 594 to 1. The ratio of registered sex offenders to all residents in this zip code is lower than the state average.
Median resident age:
This zip code:
39.1 years
Montana median age:
40.2 years
Average household size:
This zip code:
2.6 people
Montana:
2.4 people
Averages for the 2020 tax year for zip code 59037, filed in 2021:
Average Adjusted Gross Income (AGI) in 2020: $77,609 (Individual Income Tax Returns)
Here:
$77,609
State:
$70,533
Salary/wage: $62,322 (reported on 81.7% of returns)
Here:
$62,322
State:
$52,258
(% of AGI for various income ranges: 1416.0% for AGIs below $25k, 3700.0% for AGIs $25k-50k, 7324.4% for AGIs $50k-75k, 12063.3% for AGIs $75k-100k, 17010.0% for AGIs $100k-200k)
Taxable interest for individuals: $1,185 (reported on 35.5% of returns)
This zip code:
$1,185
Montana:
$1,928
(% of AGI for various income ranges: 32.0% for AGIs below $25k, 13.3% for AGIs $25k-50k, 91.1% for AGIs $50k-75k, 101.7% for AGIs $75k-100k, 73.0% for AGIs $100k-200k)
Ordinary dividends: $2,786 (reported on 23.7% of returns)
Here:
$2,786
State:
$7,554
(% of AGI for various income ranges: 11.3% for AGIs below $25k, 22.7% for AGIs $25k-50k, 57.8% for AGIs $50k-75k, 126.7% for AGIs $75k-100k, 190.0% for AGIs $100k-200k)
Net capital gain/loss in AGI: +$21,380 (reported on 21.5% of returns)
Here:
+$21,380
State:
+$26,730
(% of AGI for various income ranges: 6.7% for AGIs below $25k, 58.7% for AGIs $25k-50k, 77.8% for AGIs $50k-75k, 531.7% for AGIs $75k-100k, 794.0% for AGIs $100k-200k)
Profit/loss from business: +$10,465 (reported on 18.3% of returns)
Here:
+$10,465
State:
+$13,757
(% of AGI for various income ranges: 147.3% for AGIs below $25k, 230.0% for AGIs $25k-50k, 506.7% for AGIs $50k-75k, 757.0% for AGIs $100k-200k)
Taxable individual retirement arrangement distribution: $22,460 (reported on 10.8% of returns)
59037:
$22,460
Montana:
$19,575
(% of AGI for various income ranges: 100.0% for AGIs below $25k, 206.7% for AGIs $25k-50k, 824.4% for AGIs $50k-75k, 1044.0% for AGIs $100k-200k)
Total itemized deductions: $29,788 (reported on 8.6% of returns)
Here:
$29,788
State:
$33,125
(% of AGI for various income ranges: 862.2% for AGIs $50k-75k, 1607.0% for AGIs $100k-200k)
Charity contributions: $15,080 (reported on 5.4% of returns)
Here:
$15,080
State:
$12,481
(% of AGI for various income ranges: 754.0% for AGIs $100k-200k)
Taxes paid: $8,029 (reported on 7.5% of returns)
59037:
$8,029
State:
$7,689
(% of AGI for various income ranges: 213.3% for AGIs $50k-75k, 370.0% for AGIs $100k-200k)
Earned income credit: $2,000 (reported on 10.8% of returns)
Here:
$2,000
State:
$2,035
(% of AGI for various income ranges: 81.3% for AGIs below $25k, 52.0% for AGIs $25k-50k)
Percentage of individuals using paid preparers for their 2020 taxes: 96.8%
Here:
97%
State:
94%
(% for various income ranges: 96.0% for AGIs below $25k, 95.0% for AGIs $25k-50k, 100.0% for AGIs $50k-75k, 100.0% for AGIs $75k-100k, 94.1% for AGIs $100k-200k, 100.0% for AGIs over 200k)
Averages for the 2012 tax year for zip code 59037, filed in 2013:
Average Adjusted Gross Income (AGI) in 2012: $59,243 (Individual Income Tax Returns)
Here:
$59,243
State:
$53,401
Salary/wage: $47,529 (reported on 86.2% of returns)
Here:
$47,529
State:
$40,976
(% of AGI for various income ranges: 79.9% for AGIs below $25k, 77.9% for AGIs $25k-50k, 74.5% for AGIs $50k-75k, 77.3% for AGIs $75k-100k, 102.0% for AGIs $100k-200k)
Taxable interest for individuals: $1,174 (reported on 39.1% of returns)
This zip code:
$1,174
Montana:
$1,689
(% of AGI for various income ranges: 2.0% for AGIs below $25k, 0.6% for AGIs $25k-50k, 1.3% for AGIs $50k-75k, 0.3% for AGIs $75k-100k, 0.2% for AGIs $100k-200k, 1.2% for AGIs over 200k)
Ordinary dividends: $2,210 (reported on 23.0% of returns)
Here:
$2,210
State:
$5,585
(% of AGI for various income ranges: 1.1% for AGIs below $25k, 0.9% for AGIs $25k-50k, 1.9% for AGIs $50k-75k, 1.0% for AGIs $75k-100k, 0.6% for AGIs $100k-200k)
Net capital gain/loss in AGI: +$8,167 (reported on 20.7% of returns)
Here:
+$8,167
State:
+$14,401
(% of AGI for various income ranges: 1.4% for AGIs $50k-75k, 0.7% for AGIs $75k-100k, 10.0% for AGIs $100k-200k)
Profit/loss from business: +$10,350 (reported on 18.4% of returns)
Here:
+$10,350
State:
+$10,980
(% of AGI for various income ranges: 5.8% for AGIs below $25k, 3.7% for AGIs $25k-50k, 5.5% for AGIs $50k-75k, 2.1% for AGIs $75k-100k, 3.9% for AGIs $100k-200k)
Taxable individual retirement arrangement distribution: $14,012 (reported on 9.2% of returns)
59037:
$14,012
Montana:
$13,434
(% of AGI for various income ranges: 1.8% for AGIs below $25k, 3.8% for AGIs $25k-50k, 8.1% for AGIs $75k-100k)
Total itemized deductions: $20,863 (20% of AGI, reported on 34.5% of returns)
Here:
$20,863
State:
$21,750
Here:
19.6% of AGI
State:
20.5% of AGI
(% of AGI for various income ranges: 7.5% for AGIs below $25k, 11.2% for AGIs $25k-50k, 11.5% for AGIs $50k-75k, 12.9% for AGIs $75k-100k, 15.1% for AGIs $100k-200k, 10.5% for AGIs over 200k)
Charity contributions: $3,365 (reported on 26.4% of returns)
Here:
$3,365
State:
$3,989
(% of AGI for various income ranges: 1.3% for AGIs $25k-50k, 1.5% for AGIs $50k-75k, 1.0% for AGIs $75k-100k, 3.6% for AGIs $100k-200k)
Taxes paid: $7,593 (reported on 34.5% of returns)
59037:
$7,593
State:
$7,640
(% of AGI for various income ranges: 1.3% for AGIs below $25k, 2.5% for AGIs $25k-50k, 3.2% for AGIs $50k-75k, 4.1% for AGIs $75k-100k, 6.2% for AGIs $100k-200k, 6.1% for AGIs over 200k)
Earned income credit: $2,200 (reported on 13.8% of returns)
Here:
$2,200
State:
$2,015
(% of AGI for various income ranges: 5.5% for AGIs below $25k, 0.7% for AGIs $25k-50k)
Percentage of individuals using paid preparers for their 2012 taxes: 67.8%
Here:
68%
State:
57%
(% for various income ranges: 64.5% for AGIs below $25k, 65.0% for AGIs $25k-50k, 69.2% for AGIs $50k-75k, 72.7% for AGIs $75k-100k, 70.0% for AGIs $100k-200k, 100.0% for AGIs over 200k)
Averages for the 2004 tax year for zip code 59037, filed in 2005:
Average Adjusted Gross Income (AGI) in 2004: $39,883 (Individual Income Tax Returns)
Here:
$39,883
State:
$37,845
Salary/wage: $33,763 (reported on 84.1% of returns)
Here:
$33,763
State:
$31,190
(% of AGI for various income ranges: 119.6% for AGIs below $10k, 80.7% for AGIs $10k-25k, 79.3% for AGIs $25k-50k, 74.9% for AGIs $50k-75k, 76.9% for AGIs $75k-100k, 50.7% for AGIs over 100k)
Taxable interest for individuals: $1,056 (reported on 49.3% of returns)
This zip code:
$1,056
Montana:
$1,879
(% of AGI for various income ranges: 8.8% for AGIs below $10k, 2.6% for AGIs $10k-25k, 1.5% for AGIs $25k-50k, 0.7% for AGIs $50k-75k, 1.4% for AGIs $75k-100k, 0.7% for AGIs over 100k)
Taxable dividends: $1,097 (reported on 24.7% of returns)
Here:
$1,097
State:
$3,070
(% of AGI for various income ranges: 2.0% for AGIs below $10k, 0.7% for AGIs $10k-25k, 0.9% for AGIs $25k-50k, 1.0% for AGIs $50k-75k, 0.3% for AGIs $75k-100k, 0.3% for AGIs over 100k)
Net capital gain/loss: +$7,589 (reported on 23.2% of returns)
Here:
+$7,589
State:
+$10,237
(% of AGI for various income ranges: -6.3% for AGIs below $10k, 1.0% for AGIs $10k-25k, 1.7% for AGIs $25k-50k, 3.3% for AGIs $50k-75k, 6.5% for AGIs $75k-100k, 8.8% for AGIs over 100k)
Profit/loss from business: +$4,100 (reported on 19.9% of returns)
Here:
+$4,100
State:
+$8,849
(% of AGI for various income ranges: 5.1% for AGIs below $10k, 3.3% for AGIs $10k-25k, 2.0% for AGIs $25k-50k, 4.2% for AGIs $50k-75k, 0.8% for AGIs $75k-100k)
IRA payment deduction: $3,400 (reported on 4.0% of returns)
59037:
$3,400
Montana:
$2,958
Total itemized deductions: $15,434 (21% of AGI, reported on 34.0% of returns)
Here:
$15,434
State:
$17,258
Here:
21.4% of AGI
State:
23.1% of AGI
(% of AGI for various income ranges: 16.4% for AGIs below $10k, 10.9% for AGIs $10k-25k, 11.6% for AGIs $25k-50k, 14.8% for AGIs $50k-75k, 13.5% for AGIs $75k-100k, 13.4% for AGIs over 100k)
Charity contributions deductions: $2,206 (3% of AGI, reported on 28.4% of returns)
Here:
$2,206
State:
$2,921
Here:
2.8% of AGI
State:
3.7% of AGI
(% of AGI for various income ranges: 0.6% for AGIs $10k-25k, 1.1% for AGIs $25k-50k, 2.0% for AGIs $50k-75k, 1.0% for AGIs $75k-100k, 2.3% for AGIs over 100k)
Total tax: $5,462 (reported on 74.3% of returns)
59037:
$5,462
State:
$5,485
(% of AGI for various income ranges: 4.1% for AGIs below $10k, 4.0% for AGIs $10k-25k, 6.4% for AGIs $25k-50k, 8.3% for AGIs $50k-75k, 10.0% for AGIs $75k-100k, 18.3% for AGIs over 100k)
Earned income credit: $1,456 (reported on 13.7% of returns)
Here:
$1,456
State:
$1,604
Percentage of individuals using paid preparers for their 2004 taxes: 71.9%
Here:
72%
State:
63%
(% for various income ranges: 59.5% for AGIs below $10k, 66.1% for AGIs $10k-25k, 77.9% for AGIs $25k-50k, 77.9% for AGIs $50k-75k, 87.8% for AGIs $75k-100k, 81.6% for AGIs over 100k)
Household received Food Stamps/SNAP in the past 12 months: 67 Household did not receive Food Stamps/SNAP in the past 12 months: 839
Women who had a birth in the past 12 months: 77 (80 now married, 0 unmarried) Women who did not have a birth in the past 12 months: 369 (198 now married, 170 unmarried)
Housing units in zip code 59037 with a mortgage: 577 (10 second mortgage, 2 both second mortgage and home equity loan) Median monthly owner costs for units with a mortgage: $1,716 Median monthly owner costs for units without a mortgage: $605
Residents with income below the poverty level in 2022:
This zip code:
5.5%
Whole state:
12.1%
Residents with income below 50% of the poverty level in 2022:
This zip code:
2.1%
Whole state:
6.3%
Median number of rooms in houses and condos:
Here:
6.1
State:
6.4
Notable locations in this zip code not listed on our city pages
Creeks: Alkali Creek (A), Broken Leg Creek (B), Indian Creek (C), Girl Creek (D), Three Wolf Creek (E), Twelve Mile Creek (F), Pryor Creek (G). Display/hide their locations on the map
Size of family households: 184 2-persons, 201 3-persons, 181 4-persons, 57 5-persons
Size of nonfamily households: 141 1-person, 112 2-persons, 31 4-persons
429 married couples with children.
72 single-parent households (52 men, 20 women).
96.3% of residents of 59037 zip code speak English at home.
0.3% of residents speak Spanish at home (100% very well).
0.4% of residents speak other Indo-European language at home (100% very well).
0.7% of residents speak Asian or Pacific Island language at home (100% very well).
1.1% of residents speak other language at home (100% very well).
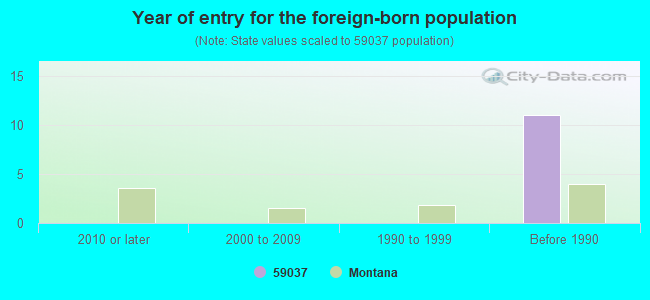
Foreign born population: 11 (0.5%) (100.0% of them are naturalized citizens)
This zip code:
0.5%
Whole state:
2.3%
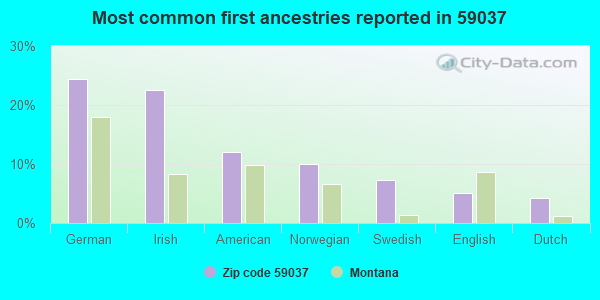
24%German
22%Irish
12%American
10%Norwegian
7%Swedish
5%English
4%Dutch
Year of entry for the foreign-born population
02010 or later
02000 to 2009
01990 to 1999
11Before 1990
Facilities with environmental interests located in this zip code:
COORS BREWING COMPANY (ROAD 4 SOUTH in HUNTLEY, MT)
AIR MINOR (AIRS/AFS) STATE MASTER (Montana air and water quality tracking) - MT-CEDARS-100021, AIR PROGRAM CRITERIA AND HAZARDOUS AIR POLLUTANT INVENTORY (Inventory of air pollution sources) Business SIC classification: FARM MACHINERY AND EQUIPMENT; GRAIN AND FIELD BEANS
KENT ANGELL SITE (1659 HEATH STREET in HUNTLEY, MT)
(Resource Conservation and Recovery Act (tracking hazardous waste))
LAMBRECHT AGGREGATE PIT PROJ (T3N R30E S34 NE in HUNTLEY, MT)
National Pollutant Discharge Elimination System NON-MAJOR (Tracking pollutant discharge elimination systems) - permit Business SIC classification: BRIDGE, TUNNEL, AND ELEVATED HIGHWAY CONSTRUCTION Alternative names: E H OFTEDAL & SONS INC
ACCELL TRANSMISSIONS (1613 NORTHERN AVENUE in HUNTLEY, MT)
ENFORCEMENT/COMPLIANCE ACTIVITY (Integrated Compliance Information System)
ADOLPH COORS COMPANY (ROAD 4 S HUNTLEY CEMENTARY OFF OF 312 in HUNTLEY, MT)
ENFORCEMENT/COMPLIANCE ACTIVITY (Integrated Compliance Information System)
DUCK'S PAINTING SHOP (1904 N 4TH ROAD in HUNTLEY, MT)
ENFORCEMENT/COMPLIANCE ACTIVITY (Integrated Compliance Information System)
G T AUTO SALVAGE (P.O. BOX 11 in HUNTLEY, MT)
ENFORCEMENT/COMPLIANCE ACTIVITY (Integrated Compliance Information System)
GOLF WEST (902 PRYOR CREEK ROAD in HUNTLEY, MT)
ENFORCEMENT/COMPLIANCE ACTIVITY (Integrated Compliance Information System)
HUNTLEY AUTO (837 W G ROAD in HUNTLEY, MT)
ENFORCEMENT/COMPLIANCE ACTIVITY (Integrated Compliance Information System)
K ENTERPRISES (1659 HEATH STREET in HUNTLEY, MT)
ENFORCEMENT/COMPLIANCE ACTIVITY (Integrated Compliance Information System)
MARTINSON'S RANCH CHOCOLATES OF MONTANA (2359 N 8TH RAOD in HUNTLEY, MT)
ENFORCEMENT/COMPLIANCE ACTIVITY (Integrated Compliance Information System)
MOORE MOTORS (113 NORTHERN AVENUE in HUNTLEY, MT)
ENFORCEMENT/COMPLIANCE ACTIVITY (Integrated Compliance Information System)
THOMAS N WELCH (6704 S 12TH ST in HUNTLEY, MT)
COMPLIANCE ACTIVITY (Tracking inspections of insecticide, fungicide, and rodenticide, and toxic substances)
Housing units lacking complete plumbing facilities: 2.6% Housing units lacking complete kitchen facilities: 2.6%
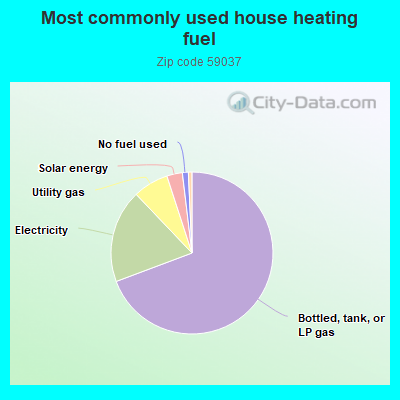
69.3%Bottled, tank, or LP gas
18.6%Electricity
7.1%Utility gas
3.1%Solar energy
1.2%No fuel used
0.7%Fuel oil, kerosene, etc.
Population in 1990: 1,006. Population change in the 1990s: +548 (+54.5%).
Place of birth for U.S.-born residents:
This state: 1,681
Northeast: 21
Midwest: 184
South: 91
West: 301
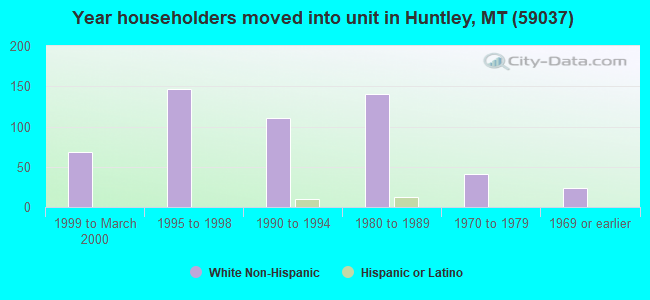
63% of the 59037 zip code residents lived in the same house 5 years ago. Out of people who lived in different houses, 75% lived in this county. Out of people who lived in different counties, 50% lived in Montana.
93% of the 59037 zip code residents lived in the same house 1 year ago. Out of people who lived in different houses, 30% moved from this county. Out of people who lived in different houses, 83% moved from different state.
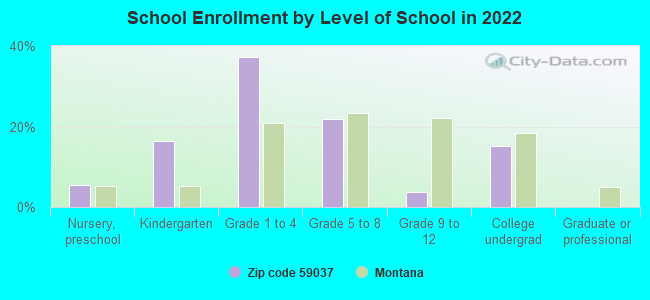
Private vs. public school enrollment:
Students in private schools in grades 1 to 8 (elementary and middle school):
Here:
0.0%
Montana:
15.3%
Students in private schools in grades 9 to 12 (high school):
Here:
0.0%
Montana:
12.2%
Students in private undergraduate colleges:
Here:
0.0%
Montana:
15.0%
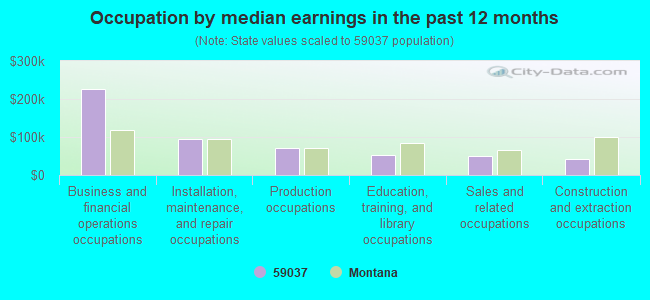
Occupation by median earnings in the past 12 months ($)
226,068Business and financial operations occupations
93,709Installation, maintenance, and repair occupations
70,231Production occupations
51,346Education, training, and library occupations
49,728Sales and related occupations
42,567Construction and extraction occupations
Top industries in this zip code by the number of employees in 2005:
Utilities: Electric Power Distribution (20-49 employees: 1 establishment)
Accommodation and Food Services: Full-Service Restaurants (10-19: 1)
Arts, Entertainment, and Recreation: Golf Courses and Country Clubs (10-19: 1)
Other Services (except Public Administration): General Automotive Repair (5-9: 1, 1-4: 1)
Construction: Other Heavy and Civil Engineering Construction (5-9: 1)
Accommodation and Food Services: Limited-Service Restaurants (5-9: 1)
Information: Newspaper Publishers (5-9: 1)
Fatal accident statistics in 2014:
Fatal accident count: 2
Vehicles involved in fatal accidents: 2
Fatal accidents caused by drunken drivers: 2
Fatalities: 4
Persons involved in fatal accidents: 4
Pedestrians involved in fatal accidents: 0
Fatal accident statistics in 2013:
Fatal accident count: 3
Vehicles involved in fatal accidents: 4
Fatal accidents caused by drunken drivers: 1
Fatalities: 3
Persons involved in fatal accidents: 4
Pedestrians involved in fatal accidents: 0
Home Mortgage Disclosure Act Aggregated Statistics For Year 2009 (Based on 2 partial tracts)
A) FHA, FSA/RHS & VA Home Purchase Loans
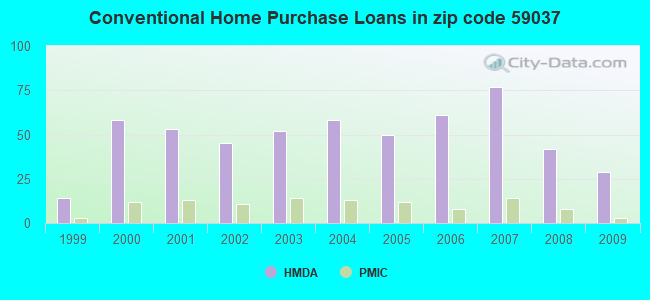
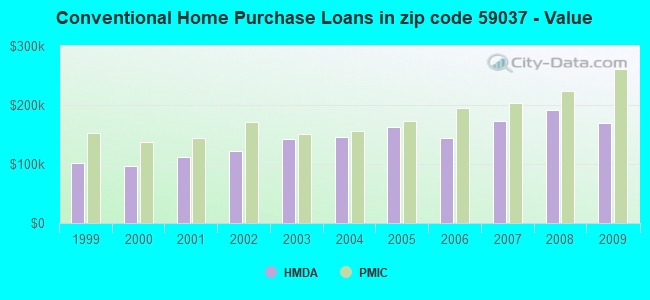
B) Conventional Home Purchase Loans
C) Refinancings
D) Home Improvement Loans
E) Loans on Dwellings For 5+ Families
F) Non-occupant Loans on < 5 Family Dwellings (A B C & D)
G) Loans On Manufactured Home Dwelling (A B C & D)
Number
Average Value
Number
Average Value
Number
Average Value
Number
Average Value
Number
Average Value
Number
Average Value
Number
Average Value
LOANS ORIGINATED
21
$195,025
29
$169,942
155
$184,972
13
$135,034
1
$67,910
3
$100,417
12
$69,910
APPLICATIONS APPROVED, NOT ACCEPTED
2
$143,735
1
$117,440
12
$193,900
1
$68,420
0
$0
1
$143,480
2
$105,185
APPLICATIONS DENIED
2
$262,195
6
$68,080
35
$190,395
5
$29,104
0
$0
1
$73,020
9
$66,889
APPLICATIONS WITHDRAWN
3
$188,580
3
$146,030
27
$190,378
0
$0
0
$0
0
$0
3
$127,990
FILES CLOSED FOR INCOMPLETENESS
1
$82,720
1
$65,360
4
$157,138
1
$130,200
0
$0
0
$0
0
$0
Aggregated Statistics For Year 2008 (Based on 2 partial tracts)
A) FHA, FSA/RHS & VA Home Purchase Loans
B) Conventional Home Purchase Loans
C) Refinancings
D) Home Improvement Loans
E) Loans on Dwellings For 5+ Families
F) Non-occupant Loans on < 5 Family Dwellings (A B C & D)
G) Loans On Manufactured Home Dwelling (A B C & D)
Number
Average Value
Number
Average Value
Number
Average Value
Number
Average Value
Number
Average Value
Number
Average Value
Number
Average Value
LOANS ORIGINATED
14
$205,662
42
$191,742
65
$172,426
16
$108,981
1
$25,530
4
$165,562
12
$78,037
APPLICATIONS APPROVED, NOT ACCEPTED
0
$0
4
$125,098
5
$244,986
1
$76,590
0
$0
0
$0
2
$75,825
APPLICATIONS DENIED
1
$171,560
7
$73,964
30
$180,855
5
$39,826
0
$0
1
$97,520
9
$64,222
APPLICATIONS WITHDRAWN
2
$147,820
6
$168,413
15
$159,239
3
$84,930
0
$0
1
$38,810
2
$95,480
FILES CLOSED FOR INCOMPLETENESS
0
$0
2
$45,955
6
$132,415
0
$0
0
$0
0
$0
1
$45,950
Aggregated Statistics For Year 2007 (Based on 2 partial tracts)
A) FHA, FSA/RHS & VA Home Purchase Loans
B) Conventional Home Purchase Loans
C) Refinancings
D) Home Improvement Loans
F) Non-occupant Loans on < 5 Family Dwellings (A B C & D)
G) Loans On Manufactured Home Dwelling (A B C & D)
Number
Average Value
Number
Average Value
Number
Average Value
Number
Average Value
Number
Average Value
Number
Average Value
LOANS ORIGINATED
6
$186,198
77
$173,684
66
$155,192
27
$57,111
7
$131,734
9
$119,310
APPLICATIONS APPROVED, NOT ACCEPTED
1
$154,710
3
$151,647
6
$148,925
3
$28,933
1
$212,920
1
$137,860
APPLICATIONS DENIED
1
$93,440
16
$157,903
34
$178,770
6
$49,613
3
$186,200
6
$85,270
APPLICATIONS WITHDRAWN
3
$130,713
4
$180,752
20
$170,515
4
$83,992
1
$49,020
2
$89,610
FILES CLOSED FOR INCOMPLETENESS
0
$0
2
$213,430
6
$201,517
1
$23,490
1
$73,530
0
$0
Aggregated Statistics For Year 2006 (Based on 2 partial tracts)
A) FHA, FSA/RHS & VA Home Purchase Loans
B) Conventional Home Purchase Loans
C) Refinancings
D) Home Improvement Loans
F) Non-occupant Loans on < 5 Family Dwellings (A B C & D)
G) Loans On Manufactured Home Dwelling (A B C & D)
Number
Average Value
Number
Average Value
Number
Average Value
Number
Average Value
Number
Average Value
Number
Average Value
LOANS ORIGINATED
9
$150,683
61
$143,746
56
$138,281
14
$42,344
6
$152,328
8
$83,994
APPLICATIONS APPROVED, NOT ACCEPTED
0
$0
6
$165,350
6
$138,798
2
$34,465
2
$179,475
2
$107,990
APPLICATIONS DENIED
2
$88,335
14
$114,630
23
$140,793
5
$64,234
4
$96,888
7
$68,786
APPLICATIONS WITHDRAWN
0
$0
8
$123,565
20
$156,320
1
$20,420
3
$115,907
1
$17,360
FILES CLOSED FOR INCOMPLETENESS
0
$0
2
$70,210
6
$147,053
0
$0
1
$41,870
1
$40,340
Aggregated Statistics For Year 2005 (Based on 2 partial tracts)
A) FHA, FSA/RHS & VA Home Purchase Loans
B) Conventional Home Purchase Loans
C) Refinancings
D) Home Improvement Loans
F) Non-occupant Loans on < 5 Family Dwellings (A B C & D)
G) Loans On Manufactured Home Dwelling (A B C & D)
Number
Average Value
Number
Average Value
Number
Average Value
Number
Average Value
Number
Average Value
Number
Average Value
LOANS ORIGINATED
10
$159,665
50
$162,350
68
$131,510
13
$51,295
7
$195,997
8
$106,141
APPLICATIONS APPROVED, NOT ACCEPTED
0
$0
6
$98,545
8
$122,671
1
$28,590
2
$126,375
4
$55,655
APPLICATIONS DENIED
0
$0
12
$120,629
22
$105,068
11
$43,123
2
$110,290
8
$70,782
APPLICATIONS WITHDRAWN
0
$0
7
$142,166
20
$143,478
5
$109,370
1
$225,690
1
$25,530
FILES CLOSED FOR INCOMPLETENESS
0
$0
2
$148,075
7
$133,267
0
$0
1
$93,950
0
$0
Aggregated Statistics For Year 2004 (Based on 2 partial tracts)
A) FHA, FSA/RHS & VA Home Purchase Loans
B) Conventional Home Purchase Loans
C) Refinancings
D) Home Improvement Loans
F) Non-occupant Loans on < 5 Family Dwellings (A B C & D)
G) Loans On Manufactured Home Dwelling (A B C & D)
Number
Average Value
Number
Average Value
Number
Average Value
Number
Average Value
Number
Average Value
Number
Average Value
LOANS ORIGINATED
9
$137,464
58
$146,217
79
$128,335
12
$46,039
6
$94,547
8
$86,291
APPLICATIONS APPROVED, NOT ACCEPTED
0
$0
5
$139,802
10
$82,002
2
$17,870
1
$43,400
2
$29,105
APPLICATIONS DENIED
1
$95,990
11
$102,491
36
$127,324
7
$67,619
2
$50,550
8
$58,910
APPLICATIONS WITHDRAWN
0
$0
6
$111,310
28
$119,991
3
$35,230
1
$40,850
3
$63,653
FILES CLOSED FOR INCOMPLETENESS
1
$55,660
2
$114,630
5
$100,996
0
$0
0
$0
1
$59,230
Aggregated Statistics For Year 2003 (Based on 2 partial tracts)
A) FHA, FSA/RHS & VA Home Purchase Loans
B) Conventional Home Purchase Loans
C) Refinancings
D) Home Improvement Loans
F) Non-occupant Loans on < 5 Family Dwellings (A B C & D)
Number
Average Value
Number
Average Value
Number
Average Value
Number
Average Value
Number
Average Value
LOANS ORIGINATED
12
$129,480
52
$143,017
175
$121,333
10
$18,382
7
$101,171
APPLICATIONS APPROVED, NOT ACCEPTED
0
$0
4
$123,438
22
$104,580
1
$7,660
0
$0
APPLICATIONS DENIED
0
$0
20
$92,240
35
$118,678
6
$12,765
2
$112,075
APPLICATIONS WITHDRAWN
1
$86,800
4
$112,715
46
$127,284
2
$24,255
0
$0
FILES CLOSED FOR INCOMPLETENESS
0
$0
1
$194,030
6
$177,433
0
$0
0
$0
Aggregated Statistics For Year 2002 (Based on 2 partial tracts)
A) FHA, FSA/RHS & VA Home Purchase Loans
B) Conventional Home Purchase Loans
C) Refinancings
D) Home Improvement Loans
F) Non-occupant Loans on < 5 Family Dwellings (A B C & D)
Number
Average Value
Number
Average Value
Number
Average Value
Number
Average Value
Number
Average Value
LOANS ORIGINATED
14
$119,006
45
$121,761
121
$113,910
12
$18,467
7
$78,049
APPLICATIONS APPROVED, NOT ACCEPTED
0
$0
11
$61,597
14
$99,640
1
$28,590
0
$0
APPLICATIONS DENIED
0
$0
20
$48,380
29
$86,661
4
$10,595
1
$63,830
APPLICATIONS WITHDRAWN
2
$102,375
5
$84,250
25
$123,606
0
$0
2
$121,780
FILES CLOSED FOR INCOMPLETENESS
1
$58,210
0
$0
5
$118,970
0
$0
0
$0
Aggregated Statistics For Year 2001 (Based on 2 partial tracts)
A) FHA, FSA/RHS & VA Home Purchase Loans
B) Conventional Home Purchase Loans
C) Refinancings
D) Home Improvement Loans
F) Non-occupant Loans on < 5 Family Dwellings (A B C & D)
Number
Average Value
Number
Average Value
Number
Average Value
Number
Average Value
Number
Average Value
LOANS ORIGINATED
9
$101,837
53
$111,532
91
$102,378
14
$26,041
7
$72,943
APPLICATIONS APPROVED, NOT ACCEPTED
0
$0
23
$50,372
14
$81,404
1
$4,600
1
$107,230
APPLICATIONS DENIED
1
$32,680
57
$39,056
37
$72,119
4
$20,552
1
$59,740
APPLICATIONS WITHDRAWN
1
$65,870
3
$67,060
31
$97,426
1
$5,620
1
$72,510
FILES CLOSED FOR INCOMPLETENESS
1
$55,140
1
$148,070
7
$91,909
1
$5,110
1
$62,290
Aggregated Statistics For Year 2000 (Based on 2 partial tracts)
A) FHA, FSA/RHS & VA Home Purchase Loans
B) Conventional Home Purchase Loans
C) Refinancings
D) Home Improvement Loans
F) Non-occupant Loans on < 5 Family Dwellings (A B C & D)
Number
Average Value
Number
Average Value
Number
Average Value
Number
Average Value
Number
Average Value
LOANS ORIGINATED
8
$109,205
58
$95,852
35
$77,640
18
$16,679
5
$37,172
APPLICATIONS APPROVED, NOT ACCEPTED
0
$0
12
$68,591
7
$67,837
2
$13,785
1
$36,760
APPLICATIONS DENIED
1
$39,830
30
$47,435
24
$70,931
2
$20,170
1
$54,120
APPLICATIONS WITHDRAWN
1
$49,530
6
$67,570
10
$86,240
1
$10,720
0
$0
FILES CLOSED FOR INCOMPLETENESS
0
$0
2
$41,615
4
$77,868
0
$0
0
$0
Aggregated Statistics For Year 1999 (Based on 1 partial tract)
A) FHA, FSA/RHS & VA Home Purchase Loans
B) Conventional Home Purchase Loans
C) Refinancings
D) Home Improvement Loans
F) Non-occupant Loans on < 5 Family Dwellings (A B C & D)
Detailed PMIC statistics for the following Tracts:0016.00
2002 - 2018 National Fire Incident Reporting System (NFIRS) incidents
Based on the data from the years 2002 - 2018 the average number of fire incidents per year is 11. The highest number of fire incidents - 29 took place in 2017, and the least - 3 in 2002. The data has a rising trend.
When looking into fire subcategories, the most reports belonged to: Outside Fires (60.4%), and Structure Fires (18.1%).
Fire incident types reported to NFIRS in Zip Code 59037


 Nearest zip codes: 59006, 59101, 59105, 59064, 59079, 59088.
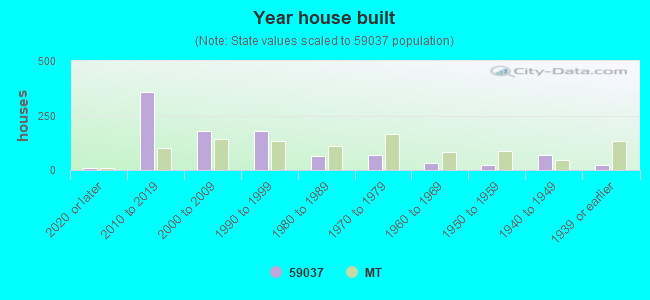


 Based on the data from the years 2002 - 2018 the average number of fire incidents per year is 11. The highest number of fire incidents - 29 took place in 2017, and the least - 3 in 2002. The data has a rising trend.
 When looking into fire subcategories, the most reports belonged to: Outside Fires (60.4%), and Structure Fires (18.1%).