Estimated zip code population in 2022: 25,904 Zip code population in 2010: 26,872 Zip code population in 2000: 24,226
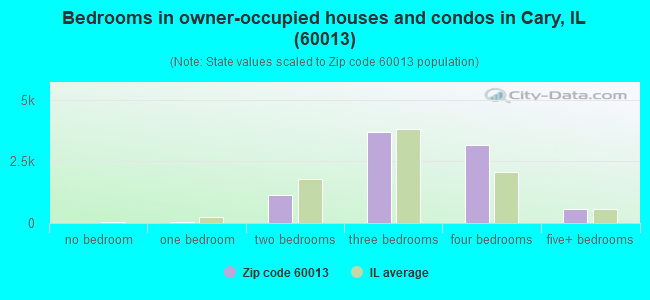
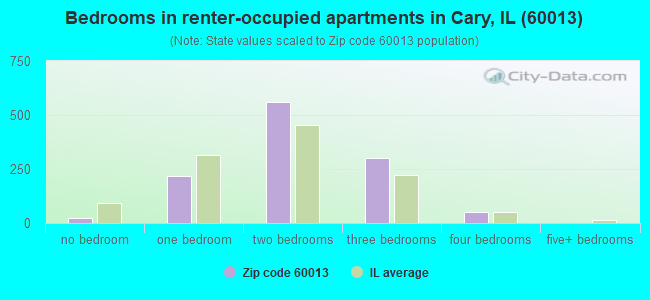
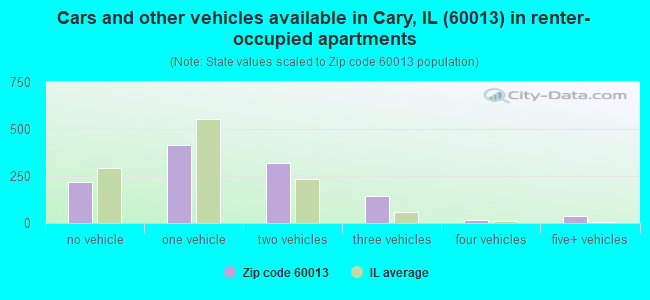
Houses and condos: 9,730 Renter-occupied apartments: 1,166
% of renters here:
12%
State:
33%
March 2022 cost of living index in zip code 60013: 100.4 (near average, U.S. average is 100)
Land area: 14.6 sq. mi. Water area: 0.8 sq. mi.
Population density: 1,775 people per square mile
(low).
OSM Map
General Map
Google Map
MSN Map
OSM Map
General Map
Google Map
MSN Map
OSM Map
General Map
Google Map
MSN Map
OSM Map
General Map
Google Map
MSN Map
Please wait while loading the map...
Real estate property taxes paid for housing units in 2022:
This zip code:
2.6% ($7,615)
Illinois:
2.0% ($4,912)
Median real estate property taxes paid for housing units with mortgages in 2022: $7,864 (2.6%) Median real estate property taxes paid for housing units with no mortgage in 2022: $6,797 (2.4%)
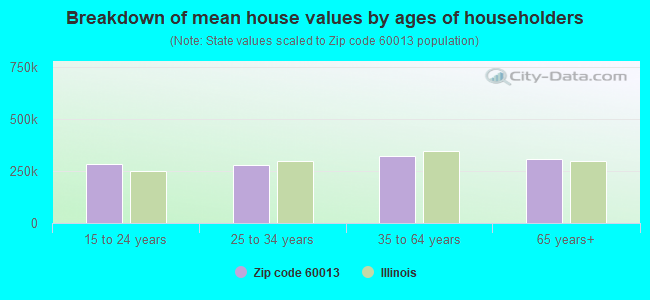
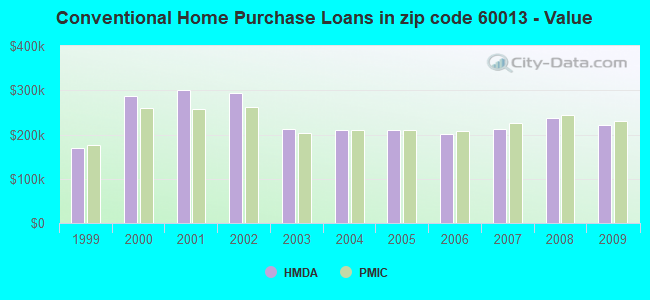
Estimated median house/condo value in 2022: $297,795
60013:
$297,795
Illinois:
$251,600
According to our research of Illinois and other state lists, there were 12 registered sex offenders living in 60013 zip code as of April 24, 2024. The ratio of all residents to sex offenders in zip code 60013 is 2,195 to 1. The ratio of registered sex offenders to all residents in this zip code is much lower than the state average.
Median resident age:
This zip code:
40.7 years
Illinois median age:
39.1 years
Average household size:
This zip code:
2.7 people
Illinois:
2.4 people
Averages for the 2020 tax year for zip code 60013, filed in 2021:
Average Adjusted Gross Income (AGI) in 2020: $93,129 (Individual Income Tax Returns)
Here:
$93,129
State:
$82,626
Salary/wage: $80,389 (reported on 85.3% of returns)
Here:
$80,389
State:
$66,640
(% of AGI for various income ranges: 1136.8% for AGIs below $25k, 3503.5% for AGIs $25k-50k, 6193.4% for AGIs $50k-75k, 9222.1% for AGIs $75k-100k, 18221.2% for AGIs $100k-200k, 73281.7% for AGIs over 200k)
Taxable interest for individuals: $1,256 (reported on 35.8% of returns)
This zip code:
$1,256
Illinois:
$2,376
(% of AGI for various income ranges: 16.1% for AGIs below $25k, 24.7% for AGIs $25k-50k, 34.0% for AGIs $50k-75k, 58.1% for AGIs $75k-100k, 95.3% for AGIs $100k-200k, 561.4% for AGIs over 200k)
Ordinary dividends: $5,674 (reported on 29.4% of returns)
Here:
$5,674
State:
$9,061
(% of AGI for various income ranges: 33.1% for AGIs below $25k, 51.7% for AGIs $25k-50k, 110.4% for AGIs $50k-75k, 130.1% for AGIs $75k-100k, 255.7% for AGIs $100k-200k, 3099.0% for AGIs over 200k)
Net capital gain/loss in AGI: +$12,376 (reported on 26.0% of returns)
Here:
+$12,376
State:
+$31,684
(% of AGI for various income ranges: 16.3% for AGIs below $25k, 29.6% for AGIs $25k-50k, 99.9% for AGIs $50k-75k, 187.6% for AGIs $75k-100k, 408.7% for AGIs $100k-200k, 7464.8% for AGIs over 200k)
Profit/loss from business: +$14,052 (reported on 14.1% of returns)
Here:
+$14,052
State:
+$12,175
(% of AGI for various income ranges: 90.2% for AGIs below $25k, 157.6% for AGIs $25k-50k, 132.7% for AGIs $50k-75k, 244.7% for AGIs $75k-100k, 378.5% for AGIs $100k-200k, 2402.1% for AGIs over 200k)
Taxable individual retirement arrangement distribution: $24,720 (reported on 11.3% of returns)
60013:
$24,720
Illinois:
$21,613
(% of AGI for various income ranges: 77.9% for AGIs below $25k, 134.3% for AGIs $25k-50k, 300.4% for AGIs $50k-75k, 413.1% for AGIs $75k-100k, 859.5% for AGIs $100k-200k, 2093.6% for AGIs over 200k)
Self-employed (Keogh) retirement plans: $20,644 (reported on 0.7% of returns)
60013:
$20,644
Illinois:
$30,962
(% of AGI for various income ranges: 32.7% for AGIs $100k-200k, 300.0% for AGIs over 200k)
Total itemized deductions: $28,467 (reported on 13.0% of returns)
Here:
$28,467
State:
$34,948
(% of AGI for various income ranges: 111.8% for AGIs below $25k, 220.6% for AGIs $25k-50k, 515.7% for AGIs $50k-75k, 568.9% for AGIs $75k-100k, 851.2% for AGIs $100k-200k, 3329.0% for AGIs over 200k)
Charity contributions: $6,891 (reported on 10.3% of returns)
Here:
$6,891
State:
$13,122
(% of AGI for various income ranges: 5.3% for AGIs below $25k, 21.0% for AGIs $25k-50k, 41.3% for AGIs $50k-75k, 60.3% for AGIs $75k-100k, 160.7% for AGIs $100k-200k, 1147.1% for AGIs over 200k)
Taxes paid: $8,948 (reported on 13.0% of returns)
60013:
$8,948
State:
$8,563
(% of AGI for various income ranges: 21.2% for AGIs below $25k, 71.5% for AGIs $25k-50k, 179.6% for AGIs $50k-75k, 228.3% for AGIs $75k-100k, 273.2% for AGIs $100k-200k, 885.0% for AGIs over 200k)
Earned income credit: $1,938 (reported on 7.4% of returns)
Here:
$1,938
State:
$2,311
(% of AGI for various income ranges: 45.3% for AGIs below $25k, 45.8% for AGIs $25k-50k, 0.9% for AGIs $50k-75k)
Percentage of individuals using paid preparers for their 2020 taxes: 92.8%
Here:
93%
State:
93%
(% for various income ranges: 90.7% for AGIs below $25k, 92.3% for AGIs $25k-50k, 93.9% for AGIs $50k-75k, 94.4% for AGIs $75k-100k, 93.4% for AGIs $100k-200k, 94.2% for AGIs over 200k)
Averages for the 2012 tax year for zip code 60013, filed in 2013:
Average Adjusted Gross Income (AGI) in 2012: $82,419 (Individual Income Tax Returns)
Here:
$82,419
State:
$68,058
Salary/wage: $74,273 (reported on 87.6% of returns)
Here:
$74,273
State:
$55,396
(% of AGI for various income ranges: 75.3% for AGIs below $25k, 78.4% for AGIs $25k-50k, 77.8% for AGIs $50k-75k, 79.9% for AGIs $75k-100k, 84.6% for AGIs $100k-200k, 73.7% for AGIs over 200k)
Taxable interest for individuals: $1,037 (reported on 41.5% of returns)
This zip code:
$1,037
Illinois:
$1,969
(% of AGI for various income ranges: 1.2% for AGIs below $25k, 0.8% for AGIs $25k-50k, 0.6% for AGIs $50k-75k, 0.4% for AGIs $75k-100k, 0.4% for AGIs $100k-200k, 0.5% for AGIs over 200k)
Ordinary dividends: $3,756 (reported on 31.4% of returns)
Here:
$3,756
State:
$7,786
(% of AGI for various income ranges: 2.5% for AGIs below $25k, 1.8% for AGIs $25k-50k, 1.1% for AGIs $50k-75k, 0.9% for AGIs $75k-100k, 0.9% for AGIs $100k-200k, 2.1% for AGIs over 200k)
Net capital gain/loss in AGI: +$7,620 (reported on 24.0% of returns)
Here:
+$7,620
State:
+$22,183
(% of AGI for various income ranges: 0.6% for AGIs $25k-50k, 0.5% for AGIs $50k-75k, 0.3% for AGIs $75k-100k, 0.8% for AGIs $100k-200k, 5.5% for AGIs over 200k)
Profit/loss from business: +$12,826 (reported on 13.8% of returns)
Here:
+$12,826
State:
+$12,903
(% of AGI for various income ranges: 6.2% for AGIs below $25k, 3.5% for AGIs $25k-50k, 2.7% for AGIs $50k-75k, 2.0% for AGIs $75k-100k, 2.0% for AGIs $100k-200k, 1.4% for AGIs over 200k)
Taxable individual retirement arrangement distribution: $18,002 (reported on 11.7% of returns)
60013:
$18,002
Illinois:
$17,929
(% of AGI for various income ranges: 5.0% for AGIs below $25k, 3.7% for AGIs $25k-50k, 3.7% for AGIs $50k-75k, 3.6% for AGIs $75k-100k, 2.6% for AGIs $100k-200k, 1.3% for AGIs over 200k)
Self-employment retirement plans: $15,462 (reported on 0.6% of returns)
60013:
$15,462
Illinois:
$24,666
Total itemized deductions: $26,372 (20% of AGI, reported on 53.7% of returns)
Here:
$26,372
State:
$26,433
Here:
20.1% of AGI
State:
19.2% of AGI
(% of AGI for various income ranges: 18.5% for AGIs below $25k, 17.3% for AGIs $25k-50k, 20.5% for AGIs $50k-75k, 19.9% for AGIs $75k-100k, 18.6% for AGIs $100k-200k, 13.6% for AGIs over 200k)
Charity contributions: $2,738 (reported on 46.6% of returns)
Here:
$2,738
State:
$4,525
(% of AGI for various income ranges: 0.9% for AGIs below $25k, 1.2% for AGIs $25k-50k, 1.5% for AGIs $50k-75k, 1.5% for AGIs $75k-100k, 1.7% for AGIs $100k-200k, 1.5% for AGIs over 200k)
Taxes paid: $13,331 (reported on 53.7% of returns)
60013:
$13,331
State:
$11,968
(% of AGI for various income ranges: 6.8% for AGIs below $25k, 7.1% for AGIs $25k-50k, 9.2% for AGIs $50k-75k, 9.5% for AGIs $75k-100k, 9.7% for AGIs $100k-200k, 7.7% for AGIs over 200k)
Earned income credit: $2,062 (reported on 8.4% of returns)
Here:
$2,062
State:
$2,349
(% of AGI for various income ranges: 3.9% for AGIs below $25k, 0.8% for AGIs $25k-50k)
Percentage of individuals using paid preparers for their 2012 taxes: 52.5%
Here:
53%
State:
57%
(% for various income ranges: 46.4% for AGIs below $25k, 54.2% for AGIs $25k-50k, 58.3% for AGIs $50k-75k, 54.9% for AGIs $75k-100k, 53.2% for AGIs $100k-200k, 60.7% for AGIs over 200k)
Averages for the 2004 tax year for zip code 60013, filed in 2005:
Average Adjusted Gross Income (AGI) in 2004: $69,683 (Individual Income Tax Returns)
Here:
$69,683
State:
$54,625
Salary/wage: $65,579 (reported on 89.1% of returns)
Here:
$65,579
State:
$46,811
(% of AGI for various income ranges: 117.2% for AGIs below $10k, 76.0% for AGIs $10k-25k, 81.4% for AGIs $25k-50k, 84.6% for AGIs $50k-75k, 87.5% for AGIs $75k-100k, 82.9% for AGIs over 100k)
Taxable interest for individuals: $1,218 (reported on 59.0% of returns)
This zip code:
$1,218
Illinois:
$2,101
(% of AGI for various income ranges: 6.1% for AGIs below $10k, 2.7% for AGIs $10k-25k, 1.6% for AGIs $25k-50k, 1.0% for AGIs $50k-75k, 0.8% for AGIs $75k-100k, 0.9% for AGIs over 100k)
Taxable dividends: $2,166 (reported on 37.2% of returns)
Here:
$2,166
State:
$4,306
(% of AGI for various income ranges: 5.4% for AGIs below $10k, 2.0% for AGIs $10k-25k, 1.5% for AGIs $25k-50k, 0.7% for AGIs $50k-75k, 0.7% for AGIs $75k-100k, 1.2% for AGIs over 100k)
Net capital gain/loss: +$4,755 (reported on 28.8% of returns)
Here:
+$4,755
State:
+$17,321
(% of AGI for various income ranges: -2.2% for AGIs below $10k, 0.6% for AGIs $10k-25k, 0.3% for AGIs $25k-50k, 0.2% for AGIs $50k-75k, 0.7% for AGIs $75k-100k, 3.2% for AGIs over 100k)
Profit/loss from business: +$12,944 (reported on 14.5% of returns)
Here:
+$12,944
State:
+$11,771
(% of AGI for various income ranges: 1.5% for AGIs below $10k, 4.9% for AGIs $10k-25k, 3.3% for AGIs $25k-50k, 3.2% for AGIs $50k-75k, 2.7% for AGIs $75k-100k, 2.3% for AGIs over 100k)
IRA payment deduction: $3,051 (reported on 3.0% of returns)
60013:
$3,051
Illinois:
$3,087
(% of AGI for various income ranges: 0.3% for AGIs below $10k, 0.1% for AGIs $10k-25k, 0.2% for AGIs $25k-50k, 0.2% for AGIs $50k-75k, 0.2% for AGIs $75k-100k, 0.1% for AGIs over 100k)
Self-employed pension: $10,868 (reported on 1.2% of returns)
Here:
$10,868
Illinois:
$16,965
(% of AGI for various income ranges: 0.1% for AGIs $25k-50k, 0.1% for AGIs $50k-75k, 0.1% for AGIs $75k-100k, 0.3% for AGIs over 100k)
Total itemized deductions: $21,183 (21% of AGI, reported on 60.6% of returns)
Here:
$21,183
State:
$20,239
Here:
20.9% of AGI
State:
19.5% of AGI
(% of AGI for various income ranges: 19.6% for AGIs below $10k, 21.5% for AGIs $10k-25k, 23.1% for AGIs $25k-50k, 22.7% for AGIs $50k-75k, 21.2% for AGIs $75k-100k, 15.7% for AGIs over 100k)
Charity contributions deductions: $2,470 (2% of AGI, reported on 56.1% of returns)
Here:
$2,470
State:
$3,719
Here:
2.4% of AGI
State:
3.4% of AGI
(% of AGI for various income ranges: 0.9% for AGIs below $10k, 1.4% for AGIs $10k-25k, 1.7% for AGIs $25k-50k, 1.9% for AGIs $50k-75k, 2.1% for AGIs $75k-100k, 2.1% for AGIs over 100k)
Total tax: $11,337 (reported on 80.8% of returns)
60013:
$11,337
State:
$9,882
(% of AGI for various income ranges: 3.0% for AGIs below $10k, 4.5% for AGIs $10k-25k, 6.8% for AGIs $25k-50k, 8.2% for AGIs $50k-75k, 9.1% for AGIs $75k-100k, 17.1% for AGIs over 100k)
Earned income credit: $1,494 (reported on 5.3% of returns)
Here:
$1,494
State:
$1,788
Percentage of individuals using paid preparers for their 2004 taxes: 53.5%
Here:
53%
State:
61%
(% for various income ranges: 41.2% for AGIs below $10k, 55.7% for AGIs $10k-25k, 59.0% for AGIs $25k-50k, 57.0% for AGIs $50k-75k, 55.4% for AGIs $75k-100k, 54.9% for AGIs over 100k)
Likely homosexual households (counted as self-reported same-sex unmarried-partner households)
Lesbian couples: 0.0% of all households
Gay men: 0.0% of all households
Household received Food Stamps/SNAP in the past 12 months: 411 Household did not receive Food Stamps/SNAP in the past 12 months: 9,124
Women who had a birth in the past 12 months: 235 (214 now married, 20 unmarried) Women who did not have a birth in the past 12 months: 5,816 (2,359 now married, 3,455 unmarried)
Housing units in zip code 60013 with a mortgage: 6,129 (623 second mortgage, 3 home equity loan, 492 both second mortgage and home equity loan) Houses without a mortgage: 158
Median monthly owner costs for units with a mortgage: $2,087 Median monthly owner costs for units without a mortgage: $904
Residents with income below the poverty level in 2022:
This zip code:
4.4%
Whole state:
11.9%
Residents with income below 50% of the poverty level in 2022:
This zip code:
1.5%
Whole state:
5.7%
Median number of rooms in houses and condos:
Here:
7.3
State:
6.4
Median number of rooms in apartments:
Here:
4.4
State:
4.1
Notable locations in this zip code not listed on our city pages
Notable locations in zip code 60013: Alexander Industrial Park (A), Three Oaks Industrial Park (B), Todec Industrial Park (C), Cary Country Club (D), Beems Resort (E), Cary Village Hall (F), Cary Fire Protection District Station 2 (G), Cary Fire Protection District Station 1 (H). Display/hide their locations on the map
Shopping Centers: Cary Commons Shopping Center (1), Cary Square Shopping Center (2), Country Commons Shopping Center (3). Display/hide their locations on the map
Churches in zip code 60013 include: Cary United Methodist Church (A), Cary-Grove Evangelical Free Church (B), Holy Cross Lutheran Church (C), Saint Barnabas Lutheran Church (D), Saints Peter and Paul Catholic Church (E), Trinity Baptist Community Church (F). Display/hide their locations on the map
Parks in zip code 60013 include: Highlands Park (1), Jaycee Park (2), Killarney Park (3), Trout Valley Park (4), Cary Junior High Prairie Nature Preserve (5), Oakwood Hills Fen Nature Preserve (6), Candlewood Park (7), Hillhurst Park (8), Hillside Prairie Park (9). Display/hide their locations on the map
4,013 married couples with children.
1,117 single-parent households (139 men, 978 women).
87.2% of residents of 60013 zip code speak English at home.
8.2% of residents speak Spanish at home (78% very well, 7% well, 9% not well, 6% not at all).
3.2% of residents speak other Indo-European language at home (66% very well, 22% well, 11% not well, 2% not at all).
0.7% of residents speak Asian or Pacific Island language at home (77% very well, 12% well, 11% not well).
0.1% of residents speak other language at home (100% very well).
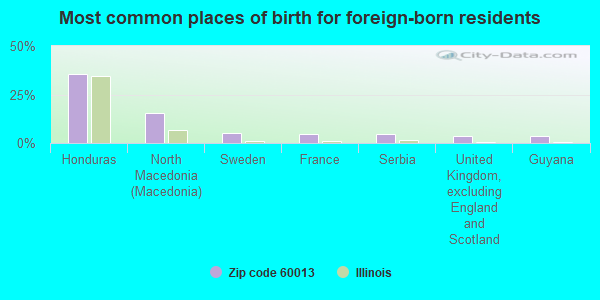
Foreign born population: 2,064 (8.0%) (66.5% of them are naturalized citizens)
This zip code:
8.0%
Whole state:
14.4%
36%Honduras
16%North Macedonia (Macedonia)
5%Sweden
4%France
4%Serbia
3%United Kingdom, excluding England and Scotland
3%Guyana
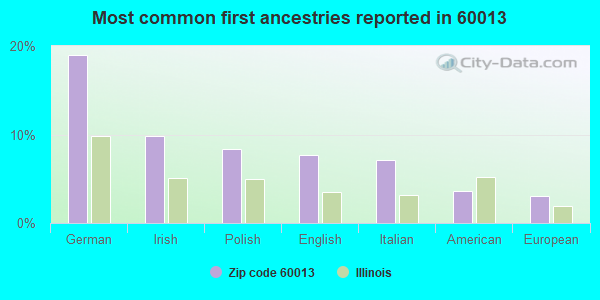
19%German
10%Irish
8%Polish
8%English
7%Italian
4%American
3%European
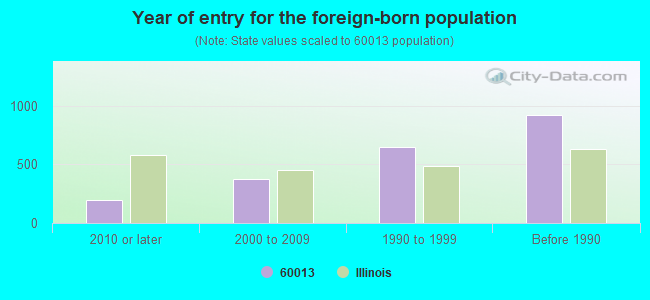
Year of entry for the foreign-born population
1982010 or later
3762000 to 2009
6501990 to 1999
923Before 1990
Major facilities with environmental interests located in this zip code:
CRAFT CONCRETE PRODUCTS INC (134 S HIGHWAY 14 in CARY, IL)
STATE MASTER (Illinois EPA Project) - AIR PROGRAM STATE MASTER (Illinois EPA Project) - National Pollutant Discharge Elimination System Permit AIR MINOR (AIRS/AFS) National Pollutant Discharge Elimination System NON-MAJOR (Tracking pollutant discharge elimination systems) - permit Business SIC classification: CONCRETE PRODUCTS, EXCEPT BLOCK AND BRICK Organizations: CRAFT CONCRETE PRODUCTS, INC. (CONTACT/OWNER)
AMPAC FLEXICON LLC (165 CHICAGO STREET in CARY, IL)
STATE MASTER (Illinois EPA Project) - HAZARDOUS WASTE PROGRAM, AIR PROGRAM AIR MAJOR (AIRS/AFS) CRITERIA AND HAZARDOUS AIR POLLUTANT INVENTORY (Inventory of air pollution sources) HAZARDOUS WASTE BIENNIAL REPORTER (Resource Conservation and Recovery Act (tracking hazardous waste)) Large Quantity Generators, more that 1000 kg of hazardous waste/month (Resource Conservation and Recovery Act (tracking hazardous waste)) - notification TRI REPORTER (Tracking of toxic chemicals releasing facilities) Business SIC classification: PACKAGING PAPER AND PLASTICS FILM, COATED AND LAMINATED; COMMERCIAL PRINTING Business NAICS classification: COMMERCIAL FLEXOGRAPHIC PRINTING.
CRESWELL INC (150 CHICAGO ST in CARY, IL)
STATE MASTER (Illinois EPA Project) - HAZARDOUS WASTE PROGRAM AIR MINOR (AIRS/AFS) (Resource Conservation and Recovery Act (tracking hazardous waste)) Business SIC classification: ELECTRONIC COMPONENTS Organizations: BANK ONE (CONTACT/OWNER)
Alternative names: C R I
MEAD COMPU/CHEM INC (8807 CARY-ALGONQUIN ROAD in CARY, IL)
STATE MASTER (Illinois EPA Project) - SOLID WASTE PROGRAM (Resource Conservation and Recovery Act (tracking hazardous waste)) Organizations: THE MEAD CORPORATION (CONTACT/OWNER)
NEW AGE CIRCUITS INC (770 INDUSTRIAL DR UNIT F in CARY, IL)
STATE MASTER (Illinois EPA Project) - SOLID WASTE PROGRAM, HAZARDOUS WASTE PROGRAM Small Quantity Generators, between 100 kg and 1000 kg of hazardous waste/month (Resource Conservation and Recovery Act (tracking hazardous waste)) - notification Small Quantity Generators, between 100 kg and 1000 kg of hazardous waste/month (Resource Conservation and Recovery Act (tracking hazardous waste)) Business NAICS classification: CURRENT-CARRYING WIRING DEVICE MANUFACTURING. Organizations: CIRCUITECH INC (CONTACT/OWNER)
Alternative names: CIRCUITECH INC
PROPOINT (700 INDUSTRIAL DR. in CARY, IL)
STATE MASTER (Illinois EPA Project) - HAZARDOUS WASTE PROGRAM Small Quantity Generators, between 100 kg and 1000 kg of hazardous waste/month (Resource Conservation and Recovery Act (tracking hazardous waste)) - notification TRI REPORTER (Tracking of toxic chemicals releasing facilities) Business SIC classification: MISCELLANEOUS FABRICATED WIRE PRODUCTS Organizations: PROPOINT INC (CONTACT/OWNER)
Alternative names: HALSTEAD ENTS INCORPORATED PROPOINT
LOWE ENTERPRISES INC (3410 NORTHWEST HWY. in CARY, IL)
STATE MASTER (Illinois EPA Project) - AIR PROGRAM AIR MINOR (AIRS/AFS) CRITERIA AND HAZARDOUS AIR POLLUTANT INVENTORY (Inventory of air pollution sources) Business SIC classification: ASPHALT PAVING MIXTURES AND BLOCKS; CONCRETE PRODUCTS, EXCEPT BLOCK AND BRICK
MUELLER TANK & TRAILER REPAIR (RT. 31 - 1ST FARM PLACE N. OF in CARY, IL)
STATE MASTER (Illinois EPA Project) - National Pollutant Discharge Elimination System Permit National Pollutant Discharge Elimination System NON-MAJOR (Tracking pollutant discharge elimination systems) - permit
DEMICHEL CLEANERS (39 W MAIN in CARY, IL)
STATE MASTER (Illinois EPA Project) - HAZARDOUS WASTE PROGRAM Small Quantity Generators, between 100 kg and 1000 kg of hazardous waste/month (Resource Conservation and Recovery Act (tracking hazardous waste)) - notification Organizations: BICOURARIS JIM (CONTACT/OWNER)
CTI IND (675 INDUSTRIAL DR in CARY, IL)
STATE MASTER (Illinois EPA Project) - HAZARDOUS WASTE PROGRAM Small Quantity Generators, between 100 kg and 1000 kg of hazardous waste/month (Resource Conservation and Recovery Act (tracking hazardous waste)) - notification Organizations: DAVIS JOHN C (CONTACT/OWNER)
CONTAINER TECHNOLOGIES LAMINATION DIV (740 INDUSTRIAL DRIVE in CARY, IL)
STATE MASTER (Illinois EPA Project) - AIR PROGRAM AIR MINOR (AIRS/AFS)
COFFMAN MFG CORP (305 CARY POINT DR in CARY, IL)
STATE MASTER (Illinois EPA Project) - HAZARDOUS WASTE PROGRAM Small Quantity Generators, between 100 kg and 1000 kg of hazardous waste/month (Resource Conservation and Recovery Act (tracking hazardous waste)) - notification Organizations: COFFMAN MANUFACTURING CORP (CONTACT/OWNER)
14 CLEANERS (708 NORTHWEST HWY in CARY, IL)
STATE MASTER (Illinois EPA Project) - HAZARDOUS WASTE PROGRAM Small Quantity Generators, between 100 kg and 1000 kg of hazardous waste/month (Resource Conservation and Recovery Act (tracking hazardous waste)) - notification Organizations: HANG JONG K (CONTACT/OWNER)
Housing units lacking complete plumbing facilities: 0.3% Housing units lacking complete kitchen facilities: 0.5%
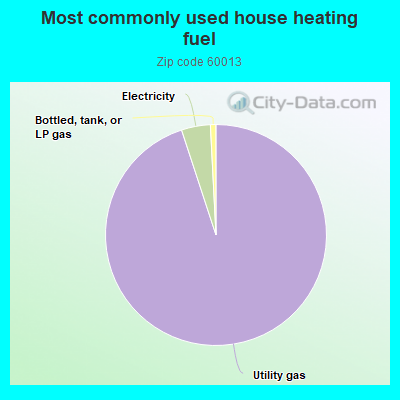
94.3%Utility gas
4.2%Electricity
0.8%Bottled, tank, or LP gas
Population in 1990: 17,521. Population change in the 1990s: +6,705 (+38.3%).
Place of birth for U.S.-born residents:
This state: 18,934
Northeast: 698
Midwest: 2,408
South: 936
West: 676
63% of the 60013 zip code residents lived in the same house 5 years ago. Out of people who lived in different houses, 40% lived in this county. Out of people who lived in different counties, 50% lived in Illinois.
93% of the 60013 zip code residents lived in the same house 1 year ago. Out of people who lived in different houses, 56% moved from this county. Out of people who lived in different houses, 36% moved from different county within same state. Out of people who lived in different houses, 7% moved from different state. Out of people who lived in different houses, 2% moved from abroad.
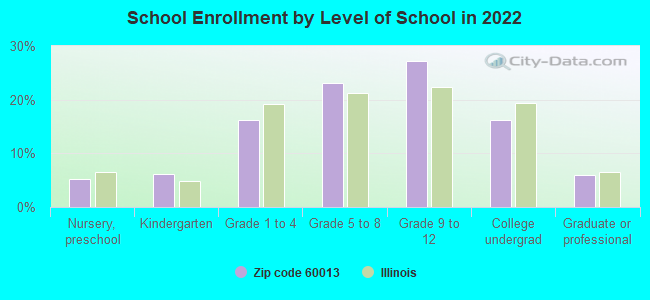
Private vs. public school enrollment:
Students in private schools in grades 1 to 8 (elementary and middle school): 316
Here:
12.8%
Illinois:
13.3%
Students in private schools in grades 9 to 12 (high school): 83
Here:
4.9%
Illinois:
9.9%
Students in private undergraduate colleges: 198
Here:
19.6%
Illinois:
27.4%
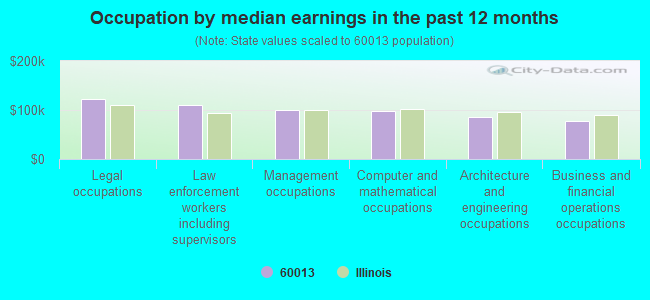
Occupation by median earnings in the past 12 months ($)
122,416Legal occupations
109,944Law enforcement workers including supervisors
99,904Management occupations
98,452Computer and mathematical occupations
85,400Architecture and engineering occupations
77,835Business and financial operations occupations
Companies with federal contracts located in this zip code:
RANGE MANAGEMENT SERVICES INC (720 INDUSTRIAL DR STE 113 in CARY, IL) : $212,064 in 3 contractsfrom 1999 to 2000
$82,946 with Army for Hazardous Substance Removal, Cleanup, and Disposal Services and Operational Support. Taking place in NY. Signed on 2000-10-25. Completion date: 2000-11-03.
$77,850, same as above.Signed on 1999-10-30. Completion date: 1999-11-08.
$51,268, same as above.Signed on 2000-05-16. Completion date: 2001-03-31.
CASWELL INTERNATIONAL CORPORAT (720 INDUSTRIAL DR, STE 112 in CARY, IL; small business) : $140,857 in 5 contractsfrom 2000 to 2002
Contracts for Miscellaneous Items, Armament Training Devices by Navy, Air Force Signed by year:2000: $189,182; 2001: $0; 2002: -$48,325; 2003: $0; 2004: $0; 2005: $0; 2006: $0.
Biggest contracts:
$84,867 with Navy for Miscellaneous Items. Signed on 2000-09-27. Completion date: 2000-11-27.
$55,990 with Air Force for Miscellaneous Items. Taking place in WI. Signed on 2000-03-06. Completion date: 2000-04-30.
$48,325 with Air Force for Armament Training Devices. Signed on 2000-09-15. Completion date: 2000-11-15.
$0, same as above.Signed on 2002-02-05. Completion date: 2002-02-05.
NEIWEEM INDUSTRIES, INC (21 GREENVIEW RD in OAKWOOD HILLS, IL; small business)
$54,625 with Navy for Fencing, Fences, Gates and Components. Signed on 2001-01-18. Completion date: 2001-05-31.
CALCO CONTROLS INC (316 CARY POINT DR in CARY, IL; small business) : $48,679 in 2 contractsin 2005
$34,082 with Navy for Miscellaneous Items. Signed on 2005-08-04. Completion date: 2005-09-30.
$14,597 with Navy for Motors, Electrical. Signed on 2005-08-20. Completion date: 2005-10-31.
PARCON RESEARCH (258 CHARLOTTE CT in CARY, IL; small business)
$17,510 with Army for Storage Tanks. Signed on 2005-03-22. Completion date: 2007-09-30.
METO-GRAFICS, INC (169 S NORTHWEST HIGHWAY in CARY, IL; small business)
$4,004 with Navy for Miscellaneous Communication Equipment. Signed on 2004-06-30. Completion date: 2004-08-20.
DURAFLEX, INC (6305 LONDONDERRY DR in CARY, IL; small business)
$1,118 with Navy for Hose, Pipe, Tube, Lubrication, and Railing Fittings. Signed on 2005-04-25. Completion date: 2005-05-31.
SCHNABEL FOUNDATION COMPANY (210 CLEVELAND ST in CARY, IL) : -$1,116,047 in 13 contractsin 2000
Contracts for Maintenance, Repair or Alteration of Real Property -- Other Non-Building Facilities by U.S. Army Corps of Engineers - civil program financing only Signed by year:2000: -$1,116,047; 2001: $0; 2002: $0; 2003: $0; 2004: $0; 2005: $0; 2006: $0.
Biggest contracts:
$112,000 with U.S. Army Corps of Engineers - civil program financing only for Maintenance, Repair or Alteration of Real Property -- Other Non-Building Facilities. Taking place in KY. Signed on 2000-03-31. Completion date: 2000-01-13.
$79,010, same as above.Signed on 2000-08-10. Completion date: 2000-01-13.
$74,398, same as above.Signed on 2000-02-14. Completion date: 1999-06-29.
$51,183, same as above.Signed on 2000-02-14. Completion date: 1999-06-29.
Top industries in this zip code by the number of employees in 2005:
Management of Companies and Enterprises: Corporate, Subsidiary, and Regional Managing Offices (100-249 employees: 1 establishment, 50-99 employees: 1 establishment, 10-19 employees: 1 establishment, 5-9 employees: 1 establishment)
2002 - 2018 National Fire Incident Reporting System (NFIRS) incidents
According to the data from the years 2002 - 2018 the average number of fire incidents per year is 41. The highest number of fire incidents - 84 took place in 2012, and the least - 9 in 2006. The data has an increasing trend.
When looking into fire subcategories, the most incidents belonged to: Structure Fires (56.8%), and Outside Fires (29.0%).
Fire incident types reported to NFIRS in Zip Code 60013


 Nearest zip codes: 60021, 60042, 60156, 60014, 60012, 60102.


 According to the data from the years 2002 - 2018 the average number of fire incidents per year is 41. The highest number of fire incidents - 84 took place in 2012, and the least - 9 in 2006. The data has an increasing trend.
 When looking into fire subcategories, the most incidents belonged to: Structure Fires (56.8%), and Outside Fires (29.0%).