Estimated zip code population in 2022: 5,155 Zip code population in 2010: 5,431 Zip code population in 2000: 5,645
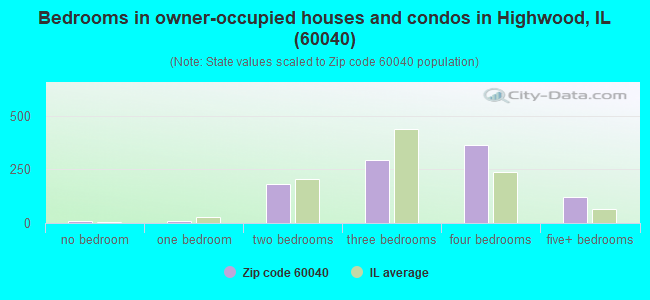
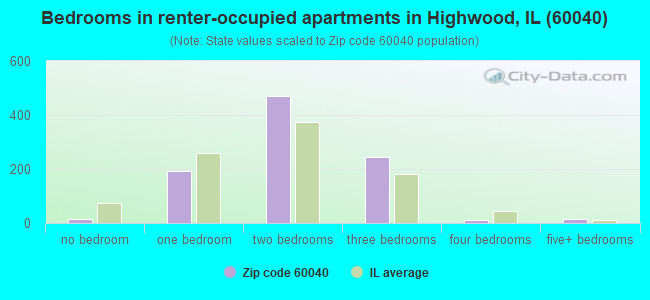
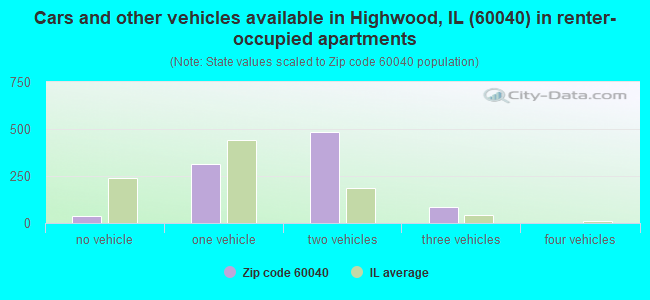
Houses and condos: 1,998 Renter-occupied apartments: 950
% of renters here:
49%
State:
33%
March 2022 cost of living index in zip code 60040: 104.0 (near average, U.S. average is 100)
Land area: 0.7 sq. mi. Water area: 0.0 sq. mi.
Population density: 7,322 people per square mile
(high).
OSM Map
General Map
Google Map
MSN Map
OSM Map
General Map
Google Map
MSN Map
OSM Map
General Map
Google Map
MSN Map
OSM Map
General Map
Google Map
MSN Map
Please wait while loading the map...
Real estate property taxes paid for housing units in 2022:
This zip code:
1.8% ($9,718)
Illinois:
2.0% ($4,912)
Median real estate property taxes paid for housing units with mortgages in 2022: $8,599 (1.8%) Median real estate property taxes paid for housing units with no mortgage in 2022: $9,944 (1.6%)
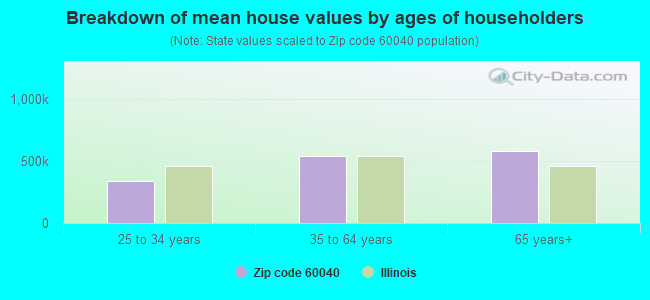
Estimated median house/condo value in 2022: $529,086
60040:
$529,086
Illinois:
$251,600
According to our research of Illinois and other state lists, there were 3 registered sex offenders living in 60040 zip code as of April 24, 2024. The ratio of all residents to sex offenders in zip code 60040 is 1,818 to 1. The ratio of registered sex offenders to all residents in this zip code is lower than the state average.
Median resident age:
This zip code:
36.7 years
Illinois median age:
39.1 years
Average household size:
This zip code:
2.6 people
Illinois:
2.4 people
Averages for the 2020 tax year for zip code 60040, filed in 2021:
Average Adjusted Gross Income (AGI) in 2020: $79,969 (Individual Income Tax Returns)
Here:
$79,969
State:
$82,626
Salary/wage: $59,024 (reported on 83.1% of returns)
Here:
$59,024
State:
$66,640
(% of AGI for various income ranges: 1392.8% for AGIs below $25k, 4252.8% for AGIs $25k-50k, 6677.5% for AGIs $50k-75k, 9461.7% for AGIs $75k-100k, 18536.2% for AGIs $100k-200k, 84436.0% for AGIs over 200k)
Taxable interest for individuals: $2,999 (reported on 26.9% of returns)
This zip code:
$2,999
Illinois:
$2,376
(% of AGI for various income ranges: 17.5% for AGIs below $25k, 14.7% for AGIs $25k-50k, 57.5% for AGIs $50k-75k, 47.5% for AGIs $75k-100k, 368.5% for AGIs $100k-200k, 2318.0% for AGIs over 200k)
Ordinary dividends: $9,741 (reported on 21.7% of returns)
Here:
$9,741
State:
$9,061
(% of AGI for various income ranges: 23.9% for AGIs below $25k, 27.9% for AGIs $25k-50k, 145.0% for AGIs $50k-75k, 312.5% for AGIs $75k-100k, 828.5% for AGIs $100k-200k, 6366.0% for AGIs over 200k)
Net capital gain/loss in AGI: +$52,052 (reported on 20.1% of returns)
Here:
+$52,052
State:
+$31,684
(% of AGI for various income ranges: 16.1% for AGIs below $25k, 32.8% for AGIs $25k-50k, 144.2% for AGIs $50k-75k, 275.0% for AGIs $75k-100k, 874.6% for AGIs $100k-200k, 47922.0% for AGIs over 200k)
Profit/loss from business: +$14,523 (reported on 17.3% of returns)
Here:
+$14,523
State:
+$12,175
(% of AGI for various income ranges: 203.0% for AGIs below $25k, 188.3% for AGIs $25k-50k, 229.6% for AGIs $50k-75k, 210.0% for AGIs $75k-100k, 713.8% for AGIs $100k-200k, 4782.0% for AGIs over 200k)
Taxable individual retirement arrangement distribution: $25,968 (reported on 7.6% of returns)
60040:
$25,968
Illinois:
$21,613
(% of AGI for various income ranges: 23.4% for AGIs below $25k, 83.6% for AGIs $25k-50k, 120.4% for AGIs $50k-75k, 394.2% for AGIs $75k-100k, 926.2% for AGIs $100k-200k, 4864.0% for AGIs over 200k)
Total itemized deductions: $32,095 (reported on 8.8% of returns)
Here:
$32,095
State:
$34,948
(% of AGI for various income ranges: 191.3% for AGIs $25k-50k, 260.4% for AGIs $50k-75k, 619.2% for AGIs $75k-100k, 1166.2% for AGIs $100k-200k, 6556.0% for AGIs over 200k)
Charity contributions: $8,017 (reported on 7.2% of returns)
Here:
$8,017
State:
$13,122
(% of AGI for various income ranges: 22.1% for AGIs $25k-50k, 50.8% for AGIs $75k-100k, 158.5% for AGIs $100k-200k, 2144.0% for AGIs over 200k)
Taxes paid: $10,177 (reported on 8.8% of returns)
60040:
$10,177
State:
$8,563
(% of AGI for various income ranges: 58.9% for AGIs $25k-50k, 70.8% for AGIs $50k-75k, 232.5% for AGIs $75k-100k, 370.0% for AGIs $100k-200k, 2064.0% for AGIs over 200k)
Earned income credit: $2,104 (reported on 11.2% of returns)
Here:
$2,104
State:
$2,311
(% of AGI for various income ranges: 61.5% for AGIs below $25k, 45.5% for AGIs $25k-50k)
Percentage of individuals using paid preparers for their 2020 taxes: 89.6%
Here:
90%
State:
93%
(% for various income ranges: 86.7% for AGIs below $25k, 87.9% for AGIs $25k-50k, 93.9% for AGIs $50k-75k, 94.4% for AGIs $75k-100k, 92.0% for AGIs $100k-200k, 94.1% for AGIs over 200k)
Averages for the 2012 tax year for zip code 60040, filed in 2013:
Average Adjusted Gross Income (AGI) in 2012: $63,428 (Individual Income Tax Returns)
Here:
$63,428
State:
$68,058
Salary/wage: $50,326 (reported on 85.7% of returns)
Here:
$50,326
State:
$55,396
(% of AGI for various income ranges: 83.9% for AGIs below $25k, 85.3% for AGIs $25k-50k, 76.7% for AGIs $50k-75k, 75.2% for AGIs $75k-100k, 69.4% for AGIs $100k-200k, 53.9% for AGIs over 200k)
Taxable interest for individuals: $2,733 (reported on 29.4% of returns)
This zip code:
$2,733
Illinois:
$1,969
(% of AGI for various income ranges: 1.0% for AGIs below $25k, 0.5% for AGIs $25k-50k, 1.1% for AGIs $50k-75k, 0.6% for AGIs $75k-100k, 0.9% for AGIs $100k-200k, 1.9% for AGIs over 200k)
Ordinary dividends: $7,690 (reported on 20.8% of returns)
Here:
$7,690
State:
$7,786
(% of AGI for various income ranges: 1.3% for AGIs below $25k, 0.8% for AGIs $25k-50k, 2.6% for AGIs $50k-75k, 2.3% for AGIs $75k-100k, 3.0% for AGIs $100k-200k, 3.3% for AGIs over 200k)
Net capital gain/loss in AGI: +$21,687 (reported on 15.9% of returns)
Here:
+$21,687
State:
+$22,183
(% of AGI for various income ranges: 2.4% for AGIs $100k-200k, 12.3% for AGIs over 200k)
Profit/loss from business: +$12,848 (reported on 11.0% of returns)
Here:
+$12,848
State:
+$12,903
(% of AGI for various income ranges: 4.9% for AGIs below $25k, 2.5% for AGIs $25k-50k, 2.8% for AGIs $50k-75k, 1.7% for AGIs $75k-100k, 2.2% for AGIs $100k-200k, 1.5% for AGIs over 200k)
Taxable individual retirement arrangement distribution: $18,570 (reported on 9.4% of returns)
60040:
$18,570
Illinois:
$17,929
(% of AGI for various income ranges: 1.9% for AGIs below $25k, 1.6% for AGIs $25k-50k, 2.8% for AGIs $50k-75k, 3.4% for AGIs $75k-100k, 6.9% for AGIs $100k-200k, 1.7% for AGIs over 200k)
Self-employment retirement plans: $16,533 (reported on 1.2% of returns)
60040:
$16,533
Illinois:
$24,666
Total itemized deductions: $27,829 (17% of AGI, reported on 25.3% of returns)
Here:
$27,829
State:
$26,433
Here:
16.7% of AGI
State:
19.2% of AGI
(% of AGI for various income ranges: 8.9% for AGIs below $25k, 6.5% for AGIs $25k-50k, 10.7% for AGIs $50k-75k, 15.6% for AGIs $75k-100k, 19.2% for AGIs $100k-200k, 9.6% for AGIs over 200k)
Charity contributions: $3,306 (reported on 20.0% of returns)
Here:
$3,306
State:
$4,525
(% of AGI for various income ranges: 0.3% for AGIs below $25k, 0.4% for AGIs $25k-50k, 1.1% for AGIs $50k-75k, 1.6% for AGIs $75k-100k, 1.6% for AGIs $100k-200k, 1.1% for AGIs over 200k)
Taxes paid: $14,394 (reported on 25.3% of returns)
60040:
$14,394
State:
$11,968
(% of AGI for various income ranges: 3.4% for AGIs below $25k, 2.3% for AGIs $25k-50k, 4.5% for AGIs $50k-75k, 7.5% for AGIs $75k-100k, 9.7% for AGIs $100k-200k, 6.0% for AGIs over 200k)
Earned income credit: $2,064 (reported on 11.4% of returns)
Here:
$2,064
State:
$2,349
(% of AGI for various income ranges: 3.0% for AGIs below $25k, 0.6% for AGIs $25k-50k)
Percentage of individuals using paid preparers for their 2012 taxes: 72.7%
Here:
73%
State:
57%
(% for various income ranges: 72.9% for AGIs below $25k, 73.2% for AGIs $25k-50k, 68.0% for AGIs $50k-75k, 78.6% for AGIs $75k-100k, 70.6% for AGIs $100k-200k, 72.7% for AGIs over 200k)
Averages for the 2004 tax year for zip code 60040, filed in 2005:
Average Adjusted Gross Income (AGI) in 2004: $53,414 (Individual Income Tax Returns)
Here:
$53,414
State:
$54,625
Salary/wage: $44,253 (reported on 82.5% of returns)
Here:
$44,253
State:
$46,811
(% of AGI for various income ranges: 92.4% for AGIs below $10k, 80.6% for AGIs $10k-25k, 79.1% for AGIs $25k-50k, 78.2% for AGIs $50k-75k, 76.5% for AGIs $75k-100k, 58.1% for AGIs over 100k)
Taxable interest for individuals: $3,162 (reported on 45.7% of returns)
This zip code:
$3,162
Illinois:
$2,101
(% of AGI for various income ranges: 13.6% for AGIs below $10k, 2.4% for AGIs $10k-25k, 1.9% for AGIs $25k-50k, 2.9% for AGIs $50k-75k, 1.3% for AGIs $75k-100k, 2.9% for AGIs over 100k)
Taxable dividends: $5,120 (reported on 28.9% of returns)
Here:
$5,120
State:
$4,306
(% of AGI for various income ranges: 4.8% for AGIs below $10k, 1.6% for AGIs $10k-25k, 1.1% for AGIs $25k-50k, 3.2% for AGIs $50k-75k, 2.8% for AGIs $75k-100k, 3.4% for AGIs over 100k)
Net capital gain/loss: +$12,170 (reported on 23.4% of returns)
Here:
+$12,170
State:
+$17,321
(% of AGI for various income ranges: -2.3% for AGIs below $10k, 0.6% for AGIs $10k-25k, -0.3% for AGIs $25k-50k, -0.1% for AGIs $50k-75k, 2.5% for AGIs $75k-100k, 10.1% for AGIs over 100k)
Profit/loss from business: +$18,939 (reported on 12.0% of returns)
Here:
+$18,939
State:
+$11,771
(% of AGI for various income ranges: 9.0% for AGIs below $10k, 4.6% for AGIs $10k-25k, 3.0% for AGIs $25k-50k, 4.7% for AGIs $50k-75k, 2.1% for AGIs $75k-100k, 4.7% for AGIs over 100k)
IRA payment deduction: $3,532 (reported on 2.5% of returns)
60040:
$3,532
Illinois:
$3,087
Self-employed pension: $12,529 (reported on 0.9% of returns)
Here:
$12,529
Illinois:
$16,965
Total itemized deductions: $24,641 (22% of AGI, reported on 31.9% of returns)
Here:
$24,641
State:
$20,239
Here:
22.2% of AGI
State:
19.5% of AGI
(% of AGI for various income ranges: 27.5% for AGIs below $10k, 10.5% for AGIs $10k-25k, 11.1% for AGIs $25k-50k, 19.2% for AGIs $50k-75k, 19.1% for AGIs $75k-100k, 14.6% for AGIs over 100k)
Charity contributions deductions: $3,164 (3% of AGI, reported on 28.4% of returns)
Here:
$3,164
State:
$3,719
Here:
2.7% of AGI
State:
3.4% of AGI
(% of AGI for various income ranges: 1.2% for AGIs below $10k, 0.6% for AGIs $10k-25k, 0.8% for AGIs $25k-50k, 1.7% for AGIs $50k-75k, 1.9% for AGIs $75k-100k, 2.1% for AGIs over 100k)
Total tax: $11,005 (reported on 66.7% of returns)
60040:
$11,005
State:
$9,882
(% of AGI for various income ranges: 2.9% for AGIs below $10k, 3.4% for AGIs $10k-25k, 6.5% for AGIs $25k-50k, 9.6% for AGIs $50k-75k, 10.4% for AGIs $75k-100k, 20.0% for AGIs over 100k)
Earned income credit: $1,395 (reported on 9.0% of returns)
Here:
$1,395
State:
$1,788
Percentage of individuals using paid preparers for their 2004 taxes: 70.7%
Here:
71%
State:
61%
(% for various income ranges: 62.9% for AGIs below $10k, 74.5% for AGIs $10k-25k, 71.5% for AGIs $25k-50k, 73.8% for AGIs $50k-75k, 64.2% for AGIs $75k-100k, 70.4% for AGIs over 100k)
Household received Food Stamps/SNAP in the past 12 months: 139 Household did not receive Food Stamps/SNAP in the past 12 months: 1,779
Women who had a birth in the past 12 months: 10 (10 now married, 0 unmarried) Women who did not have a birth in the past 12 months: 1,065 (512 now married, 550 unmarried)
Housing units in zip code 60040 with a mortgage: 559 (120 second mortgage, 6 home equity loan, 114 both second mortgage and home equity loan) Median monthly owner costs for units with a mortgage: $2,910 Median monthly owner costs for units without a mortgage: $1,406
Residents with income below the poverty level in 2022:
This zip code:
14.3%
Whole state:
11.9%
Residents with income below 50% of the poverty level in 2022:
This zip code:
10.3%
Whole state:
5.7%
Median number of rooms in houses and condos:
Here:
7.9
State:
6.4
Median number of rooms in apartments:
Here:
4.2
State:
4.1
Notable locations in this zip code not listed on our city pages
In group quarters: 90 (-1 institutionalized population)
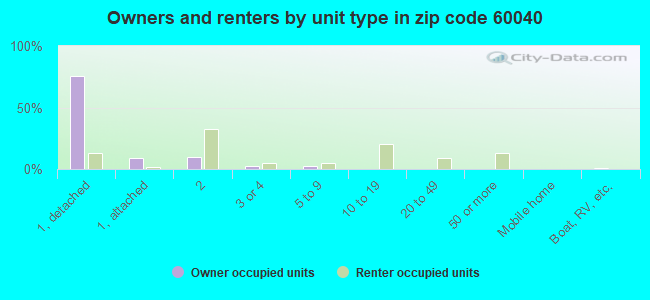
Size of family households: 631 2-persons, 300 3-persons, 280 4-persons, 49 5-persons, 132 6-persons
Size of nonfamily households: 354 1-person, 94 2-persons, 86 3-persons
942 married couples with children.
253 single-parent households (92 men, 161 women).
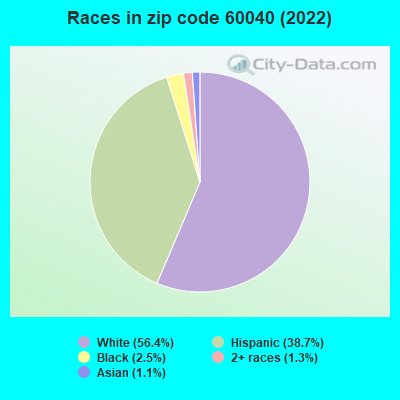
59.5% of residents of 60040 zip code speak English at home.
33.9% of residents speak Spanish at home (47% very well, 30% well, 20% not well, 3% not at all).
5.4% of residents speak other Indo-European language at home (78% very well, 15% well, 3% not well, 3% not at all).
0.9% of residents speak Asian or Pacific Island language at home (100% very well).
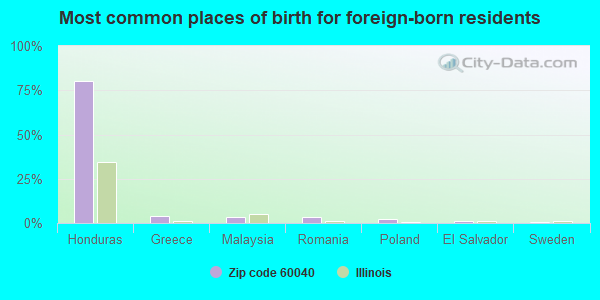
Foreign born population: 1,197 (23.2%) (33.0% of them are naturalized citizens)
This zip code:
23.2%
Whole state:
14.4%
80%Honduras
4%Greece
4%Malaysia
3%Romania
3%Poland
1%El Salvador
1%Sweden
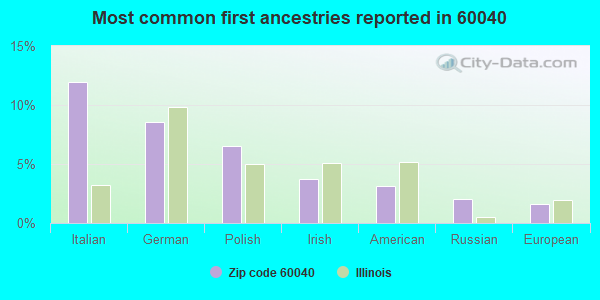
12%Italian
9%German
7%Polish
4%Irish
3%American
2%Russian
2%European
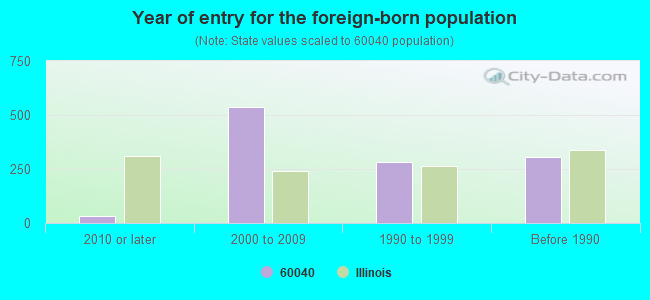
Year of entry for the foreign-born population
332010 or later
5352000 to 2009
2811990 to 1999
307Before 1990
Facilities with environmental interests located in this zip code:
MOBIL OIL CORP (1000 SHERIDAN AVENUE in HIGHWOOD, IL)
STATE MASTER (Illinois EPA Project) - SOLID WASTE PROGRAM, HAZARDOUS WASTE PROGRAM, AIR PROGRAM AIR MINOR (AIRS/AFS) Small Quantity Generators, between 100 kg and 1000 kg of hazardous waste/month (Resource Conservation and Recovery Act (tracking hazardous waste)) - notification Business SIC classification: GASOLINE SERVICE STATIONS Organizations: MOBIL OIL CORPORATION (CONTACT/OWNER)
Alternative names: EXXON MOBIL OIL CORPORATION STA 05 H3E, MOBIL OIL CORP SS H3E
COMED-HIGHWOOD (514 SHERIDAN RD-B in HIGHWOOD, IL)
STATE MASTER (Illinois EPA Project) - HAZARDOUS WASTE PROGRAM Large Quantity Generators, more that 1000 kg of hazardous waste/month (Resource Conservation and Recovery Act (tracking hazardous waste)) Organizations: COM ED (CONTACT/OPERATOR)
Alternative names: COM ED
22 CLEANERS (848 SHERIDAN RD in HIGHWOOD, IL)
STATE MASTER (Illinois EPA Project) - HAZARDOUS WASTE PROGRAM Small Quantity Generators, between 100 kg and 1000 kg of hazardous waste/month (Resource Conservation and Recovery Act (tracking hazardous waste)) - notification Organizations: YU YONG S (CONTACT/OWNER)
GREEN CLEANERS (754 SHERIDAN RD in HIGHWOOD, IL)
STATE MASTER (Illinois EPA Project) - AIR PROGRAM AIR MINOR (AIRS/AFS) Business SIC classification: DRYCLEANING PLANTS, EXCEPT RUG CLEANING Alternative names: HAE J KIM
HECKY S BARBECUE (412 SHERIDAN ROAD in HIGHWOOD, IL)
STATE MASTER (Illinois EPA Project) - AIR PROGRAM AIR MINOR (AIRS/AFS) Business SIC classification: NONCLASSIFIABLE ESTABLISHMENTS Alternative names: HECKYS BARBECUE
HIGHWOOD WTP (WALKER AVENUE in HIGHWOOD, IL)
STATE MASTER (Illinois EPA Project) - National Pollutant Discharge Elimination System Permit National Pollutant Discharge Elimination System NON-MAJOR (Tracking pollutant discharge elimination systems) - permit Business SIC classification: WATER SUPPLY Alternative names: HIGHWOOD WTP, CITY OF
MIDWEST YOUNG ARTISTS (BLDG 33 - LYSTER RD in HIGHWOOD, IL)
STATE MASTER (Illinois EPA Project) - HAZARDOUS WASTE PROGRAM Small Quantity Generators, between 100 kg and 1000 kg of hazardous waste/month (Resource Conservation and Recovery Act (tracking hazardous waste)) - notification Organizations: SKOKIE VALLEY YOUTH SYMPHONY (CONTACT/OWNER)
CLARK 1507 (341 WAUKEGAN AVE in HIGHWOOD, IL)
STATE MASTER (Illinois EPA Project) - SOLID WASTE PROGRAM Small Quantity Generators, between 100 kg and 1000 kg of hazardous waste/month (Resource Conservation and Recovery Act (tracking hazardous waste)) - notification Organizations: CLARK REFINING & MARKETING INC (CONTACT/OWNER)
Alternative names: CLARK #1507
HIGHWOOD HIGHLAND PARK SCHOOL (240 PRAIRIE AVE in HIGHWOOD, IL)
(Integrated Compliance Information System) - ICIS-05-1985-0087, FORMAL ENFORCEMENT ACTION Business SIC classification: ELEMENTARY AND SECONDARY SCHOOLS
HIGHWOOD WATER FILTRATION PLT (EAST WALKER AVE in HIGHWOOD, IL)
(Resource Conservation and Recovery Act (tracking hazardous waste)) Organizations: CITY OF HIGHWOOD (CONTACT/OWNER)
POPS HIGHWOOD (214 GREEN BAY ROAD in HIGHWOOD, IL)
Small Quantity Generators, between 100 kg and 1000 kg of hazardous waste/month (Resource Conservation and Recovery Act (tracking hazardous waste)) - notification Organizations: MAZZACCO MRS A FRANCES (CONTACT/OWNER)
Alternative names: 214 GREEN BAY RD
ROCKS ANN TRUCKING INC (333 HIGHWOOD AVE in HIGHWOOD, IL)
TRANSPORTER (Resource Conservation and Recovery Act (tracking hazardous waste)) Organizations: SLAYTON FRED (CONTACT/OWNER)
Housing units lacking complete plumbing facilities: 1.4% Housing units lacking complete kitchen facilities: 0.7%
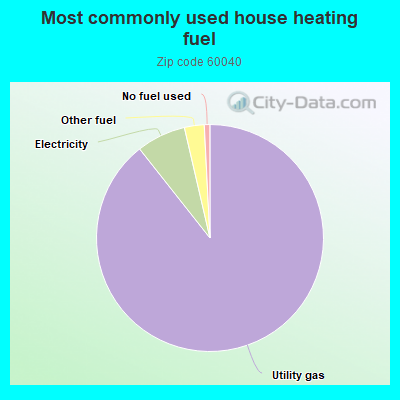
89.0%Utility gas
7.0%Electricity
2.8%Other fuel
0.8%No fuel used
Population in 1990: 3,956. Population change in the 1990s: +1,689 (+42.7%).
Place of birth for U.S.-born residents:
This state: 3,001
Northeast: 177
Midwest: 232
South: 180
West: 347
48% of the 60040 zip code residents lived in the same house 5 years ago. Out of people who lived in different houses, 71% lived in this county. Out of people who lived in different counties, 50% lived in Illinois.
85% of the 60040 zip code residents lived in the same house 1 year ago. Out of people who lived in different houses, 74% moved from this county. Out of people who lived in different houses, 17% moved from different county within same state. Out of people who lived in different houses, 3% moved from different state. Out of people who lived in different houses, 2% moved from abroad.
Private vs. public school enrollment:
Students in private schools in grades 1 to 8 (elementary and middle school): 52
Here:
10.8%
Illinois:
13.3%
Students in private schools in grades 9 to 12 (high school): 44
Here:
19.0%
Illinois:
9.9%
Students in private undergraduate colleges: 42
Here:
17.0%
Illinois:
27.4%
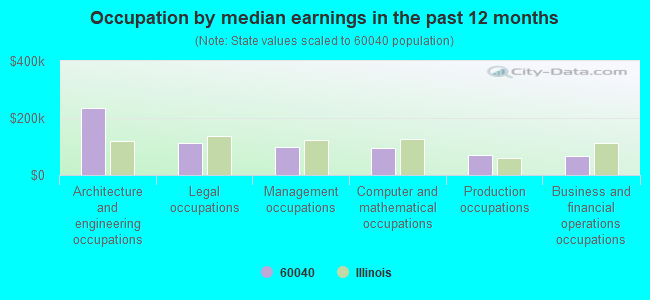
Occupation by median earnings in the past 12 months ($)
233,393Architecture and engineering occupations
113,226Legal occupations
99,378Management occupations
95,245Computer and mathematical occupations
68,756Production occupations
67,086Business and financial operations occupations
Companies with federal contracts located in this zip code:
HOTEL IMPERIAL LTD (700 SHERIDAN RD in HIGHWOOD, IL; small business) : $118,168 in 9 contractsfrom 2003 to 2005
Contracts for Lodging - Hotel/Motel by Army Signed by year:2000: $0; 2001: $0; 2002: $0; 2003: $110,630; 2004: $3,588; 2005: $3,950; 2006: $0.
Biggest contracts:
$48,328 with Army for Lodging - Hotel/Motel. Signed on 2003-04-11. Completion date: 2003-03-03.
$37,841, same as above.Signed on 2003-02-19. Completion date: 2003-03-03.
$12,166, same as above.Signed on 2003-11-26. Completion date: 2003-12-14.
$6,624, same as above.Signed on 2003-02-26. Completion date: 2003-03-03.
Top industries in this zip code by the number of employees in 2005:
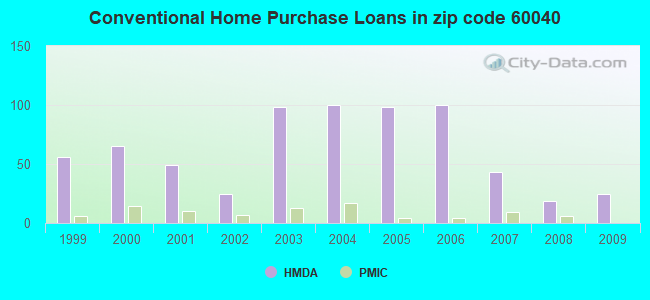
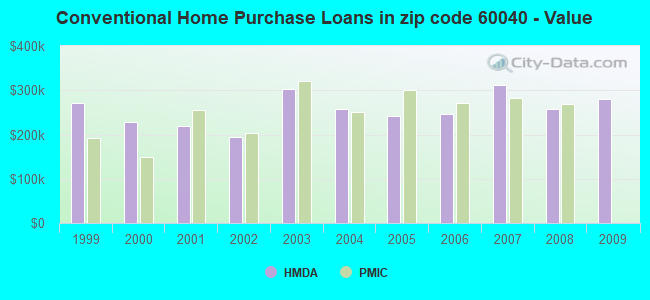
Detailed PMIC statistics for the following Tracts:8652.00
2002 - 2018 National Fire Incident Reporting System (NFIRS) incidents
According to the data from the years 2002 - 2018 the average number of fires per year is 23. The highest number of reported fire incidents - 80 took place in 2013, and the least - 3 in 2012. The data has a declining trend.
When looking into fire subcategories, the most reports belonged to: Structure Fires (81.8%), and Outside Fires (12.6%).
Fire incident types reported to NFIRS in Zip Code 60040
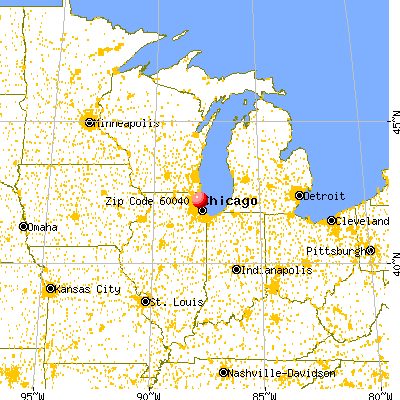


 Nearest zip codes: 60035, 60045, 60015, 60062, 60022, 60044.
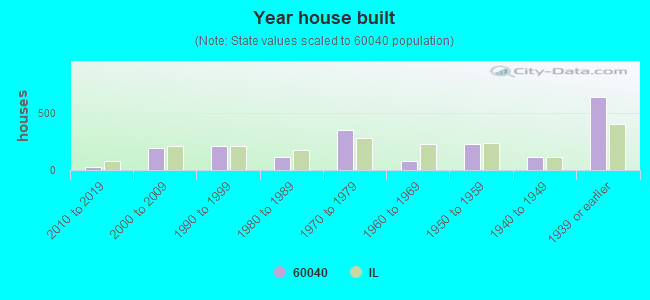


 According to the data from the years 2002 - 2018 the average number of fires per year is 23. The highest number of reported fire incidents - 80 took place in 2013, and the least - 3 in 2012. The data has a declining trend.
 When looking into fire subcategories, the most reports belonged to: Structure Fires (81.8%), and Outside Fires (12.6%).