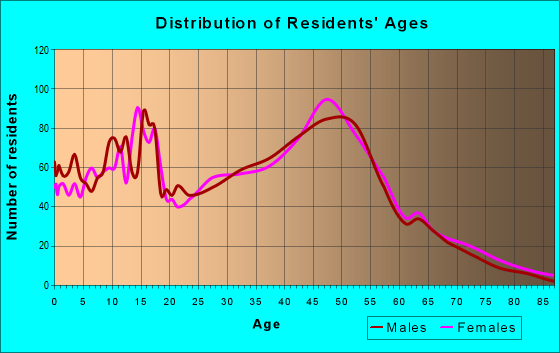
Estimated zip code population in 2022: 8,470 Zip code population in 2010: 8,547 Zip code population in 2000: 8,877
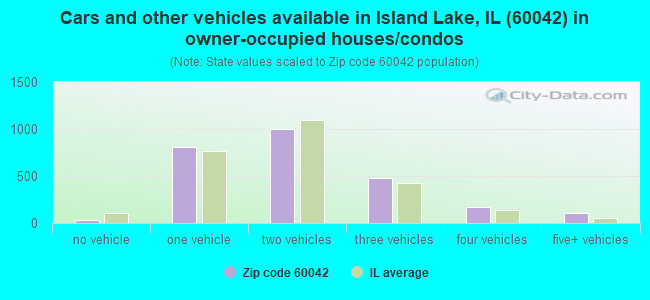
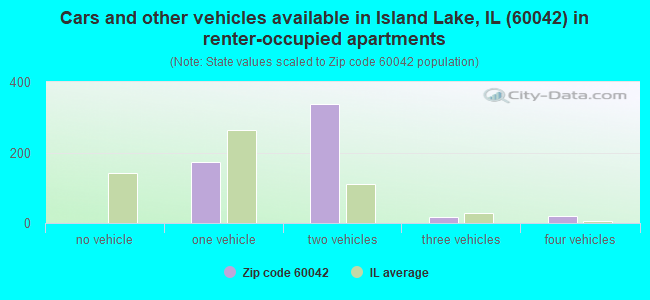
Houses and condos: 3,336 Renter-occupied apartments: 571
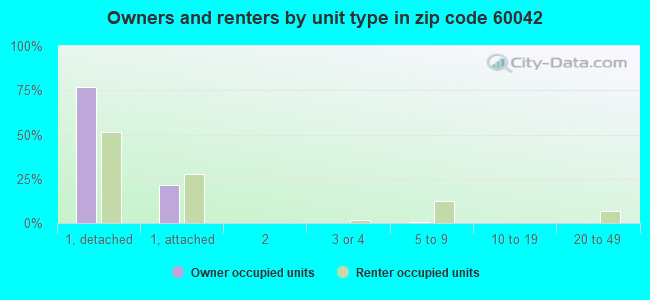
% of renters here:
18%
State:
33%
March 2022 cost of living index in zip code 60042: 98.3 (near average, U.S. average is 100)
Land area: 4.6 sq. mi. Water area: 0.5 sq. mi.
Population density: 1,849 people per square mile
(low).
OSM Map
General Map
Google Map
MSN Map
OSM Map
General Map
Google Map
MSN Map
OSM Map
General Map
Google Map
MSN Map
OSM Map
General Map
Google Map
MSN Map
Please wait while loading the map...
Real estate property taxes paid for housing units in 2022:
This zip code:
2.4% ($5,654)
Illinois:
2.0% ($4,912)
Median real estate property taxes paid for housing units with mortgages in 2022: $6,222 (2.5%) Median real estate property taxes paid for housing units with no mortgage in 2022: $4,254 (2.0%)
Averages for the 2020 tax year for zip code 60042, filed in 2021:
Average Adjusted Gross Income (AGI) in 2020: $64,028 (Individual Income Tax Returns)
Here:
$64,028
State:
$82,626
Salary/wage: $58,612 (reported on 86.4% of returns)
Here:
$58,612
State:
$66,640
(% of AGI for various income ranges: 1149.7% for AGIs below $25k, 3607.9% for AGIs $25k-50k, 6595.8% for AGIs $50k-75k, 9627.1% for AGIs $75k-100k, 17282.1% for AGIs $100k-200k, 64335.0% for AGIs over 200k)
Taxable interest for individuals: $670 (reported on 25.8% of returns)
This zip code:
$670
Illinois:
$2,376
(% of AGI for various income ranges: 11.6% for AGIs below $25k, 13.4% for AGIs $25k-50k, 17.5% for AGIs $50k-75k, 48.2% for AGIs $75k-100k, 33.8% for AGIs $100k-200k, 277.5% for AGIs over 200k)
Ordinary dividends: $2,729 (reported on 19.5% of returns)
Here:
$2,729
State:
$9,061
(% of AGI for various income ranges: 18.7% for AGIs below $25k, 28.7% for AGIs $25k-50k, 66.0% for AGIs $50k-75k, 71.1% for AGIs $75k-100k, 136.3% for AGIs $100k-200k, 1640.0% for AGIs over 200k)
Net capital gain/loss in AGI: +$4,810 (reported on 16.0% of returns)
Here:
+$4,810
State:
+$31,684
(% of AGI for various income ranges: 4.9% for AGIs below $25k, 26.0% for AGIs $25k-50k, 31.4% for AGIs $50k-75k, 86.1% for AGIs $75k-100k, 290.2% for AGIs $100k-200k, 3065.0% for AGIs over 200k)
Profit/loss from business: +$8,789 (reported on 13.3% of returns)
Here:
+$8,789
State:
+$12,175
(% of AGI for various income ranges: 130.4% for AGIs below $25k, 183.8% for AGIs $25k-50k, 141.8% for AGIs $50k-75k, 161.3% for AGIs $75k-100k, 138.1% for AGIs $100k-200k, 1122.5% for AGIs over 200k)
Taxable individual retirement arrangement distribution: $17,315 (reported on 8.8% of returns)
60042:
$17,315
Illinois:
$21,613
(% of AGI for various income ranges: 59.3% for AGIs below $25k, 116.4% for AGIs $25k-50k, 181.2% for AGIs $50k-75k, 226.8% for AGIs $75k-100k, 413.3% for AGIs $100k-200k, 3337.5% for AGIs over 200k)
Total itemized deductions: $23,995 (reported on 9.2% of returns)
Here:
$23,995
State:
$34,948
(% of AGI for various income ranges: 48.1% for AGIs below $25k, 114.3% for AGIs $25k-50k, 376.8% for AGIs $50k-75k, 562.4% for AGIs $75k-100k, 541.2% for AGIs $100k-200k, 3880.0% for AGIs over 200k)
Charity contributions: $5,043 (reported on 6.6% of returns)
Here:
$5,043
State:
$13,122
(% of AGI for various income ranges: 14.5% for AGIs $25k-50k, 30.5% for AGIs $50k-75k, 60.0% for AGIs $75k-100k, 109.4% for AGIs $100k-200k, 1040.0% for AGIs over 200k)
Taxes paid: $8,874 (reported on 9.2% of returns)
60042:
$8,874
State:
$8,563
(% of AGI for various income ranges: 15.4% for AGIs below $25k, 42.4% for AGIs $25k-50k, 150.9% for AGIs $50k-75k, 222.4% for AGIs $75k-100k, 209.2% for AGIs $100k-200k, 1065.0% for AGIs over 200k)
Earned income credit: $1,996 (reported on 10.1% of returns)
Here:
$1,996
State:
$2,311
(% of AGI for various income ranges: 58.9% for AGIs below $25k, 44.6% for AGIs $25k-50k)
Percentage of individuals using paid preparers for their 2020 taxes: 91.9%
Here:
92%
State:
93%
(% for various income ranges: 90.3% for AGIs below $25k, 90.1% for AGIs $25k-50k, 92.1% for AGIs $50k-75k, 94.1% for AGIs $75k-100k, 95.1% for AGIs $100k-200k, 92.3% for AGIs over 200k)
Averages for the 2012 tax year for zip code 60042, filed in 2013:
Average Adjusted Gross Income (AGI) in 2012: $54,444 (Individual Income Tax Returns)
Here:
$54,444
State:
$68,058
Salary/wage: $51,666 (reported on 88.3% of returns)
Here:
$51,666
State:
$55,396
(% of AGI for various income ranges: 75.0% for AGIs below $25k, 82.6% for AGIs $25k-50k, 84.2% for AGIs $50k-75k, 86.6% for AGIs $75k-100k, 87.1% for AGIs $100k-200k, 75.8% for AGIs over 200k)
Taxable interest for individuals: $493 (reported on 31.0% of returns)
This zip code:
$493
Illinois:
$1,969
(% of AGI for various income ranges: 0.8% for AGIs below $25k, 0.2% for AGIs $25k-50k, 0.4% for AGIs $50k-75k, 0.2% for AGIs $75k-100k, 0.2% for AGIs $100k-200k, 0.2% for AGIs over 200k)
Ordinary dividends: $1,774 (reported on 19.6% of returns)
Here:
$1,774
State:
$7,786
(% of AGI for various income ranges: 1.2% for AGIs below $25k, 0.6% for AGIs $25k-50k, 0.5% for AGIs $50k-75k, 0.7% for AGIs $75k-100k, 0.6% for AGIs $100k-200k, 0.7% for AGIs over 200k)
Net capital gain/loss in AGI: +$783 (reported on 13.8% of returns)
Here:
+$783
State:
+$22,183
(% of AGI for various income ranges: 0.1% for AGIs $100k-200k, 2.5% for AGIs over 200k)
Profit/loss from business: +$9,141 (reported on 13.5% of returns)
Here:
+$9,141
State:
+$12,903
(% of AGI for various income ranges: 10.6% for AGIs below $25k, 3.7% for AGIs $25k-50k, 1.7% for AGIs $50k-75k, 0.7% for AGIs $75k-100k, 1.6% for AGIs $100k-200k)
Taxable individual retirement arrangement distribution: $13,205 (reported on 8.6% of returns)
60042:
$13,205
Illinois:
$17,929
(% of AGI for various income ranges: 3.1% for AGIs below $25k, 1.9% for AGIs $25k-50k, 2.1% for AGIs $50k-75k, 1.9% for AGIs $75k-100k, 2.7% for AGIs $100k-200k)
Total itemized deductions: $19,463 (23% of AGI, reported on 47.3% of returns)
Here:
$19,463
State:
$26,433
Here:
22.9% of AGI
State:
19.2% of AGI
(% of AGI for various income ranges: 16.4% for AGIs below $25k, 14.1% for AGIs $25k-50k, 18.2% for AGIs $50k-75k, 19.0% for AGIs $75k-100k, 18.2% for AGIs $100k-200k, 10.8% for AGIs over 200k)
Charity contributions: $1,841 (reported on 38.2% of returns)
Here:
$1,841
State:
$4,525
(% of AGI for various income ranges: 0.9% for AGIs below $25k, 0.9% for AGIs $25k-50k, 1.2% for AGIs $50k-75k, 1.3% for AGIs $75k-100k, 1.7% for AGIs $100k-200k, 1.1% for AGIs over 200k)
Taxes paid: $9,046 (reported on 47.3% of returns)
60042:
$9,046
State:
$11,968
(% of AGI for various income ranges: 5.5% for AGIs below $25k, 5.9% for AGIs $25k-50k, 8.1% for AGIs $50k-75k, 8.9% for AGIs $75k-100k, 8.9% for AGIs $100k-200k, 6.9% for AGIs over 200k)
Earned income credit: $2,023 (reported on 12.1% of returns)
Here:
$2,023
State:
$2,349
(% of AGI for various income ranges: 4.6% for AGIs below $25k, 0.8% for AGIs $25k-50k)
Percentage of individuals using paid preparers for their 2012 taxes: 54.8%
Here:
55%
State:
57%
(% for various income ranges: 50.3% for AGIs below $25k, 54.7% for AGIs $25k-50k, 58.1% for AGIs $50k-75k, 60.0% for AGIs $75k-100k, 56.4% for AGIs $100k-200k, 66.7% for AGIs over 200k)
Averages for the 2004 tax year for zip code 60042, filed in 2005:
Average Adjusted Gross Income (AGI) in 2004: $50,589 (Individual Income Tax Returns)
Here:
$50,589
State:
$54,625
Salary/wage: $48,746 (reported on 90.8% of returns)
Here:
$48,746
State:
$46,811
(% of AGI for various income ranges: 107.1% for AGIs below $10k, 77.0% for AGIs $10k-25k, 87.8% for AGIs $25k-50k, 90.9% for AGIs $50k-75k, 91.9% for AGIs $75k-100k, 81.4% for AGIs over 100k)
Taxable interest for individuals: $716 (reported on 47.8% of returns)
This zip code:
$716
Illinois:
$2,101
(% of AGI for various income ranges: 4.6% for AGIs below $10k, 1.4% for AGIs $10k-25k, 0.6% for AGIs $25k-50k, 0.4% for AGIs $50k-75k, 0.3% for AGIs $75k-100k, 0.9% for AGIs over 100k)
Taxable dividends: $1,218 (reported on 23.9% of returns)
Here:
$1,218
State:
$4,306
(% of AGI for various income ranges: 2.3% for AGIs below $10k, 1.1% for AGIs $10k-25k, 0.4% for AGIs $25k-50k, 0.3% for AGIs $50k-75k, 0.3% for AGIs $75k-100k, 1.0% for AGIs over 100k)
Net capital gain/loss: +$3,592 (reported on 16.3% of returns)
Here:
+$3,592
State:
+$17,321
(% of AGI for various income ranges: -1.0% for AGIs below $10k, -0.1% for AGIs $10k-25k, -0.1% for AGIs $25k-50k, 0.6% for AGIs $50k-75k, 0.6% for AGIs $75k-100k, 3.4% for AGIs over 100k)
Profit/loss from business: +$8,040 (reported on 13.8% of returns)
Here:
+$8,040
State:
+$11,771
(% of AGI for various income ranges: 5.9% for AGIs below $10k, 7.7% for AGIs $10k-25k, 2.8% for AGIs $25k-50k, 1.8% for AGIs $50k-75k, 0.9% for AGIs $75k-100k, 2.0% for AGIs over 100k)
IRA payment deduction: $2,862 (reported on 2.7% of returns)
60042:
$2,862
Illinois:
$3,087
(% of AGI for various income ranges: 0.2% for AGIs $10k-25k, 0.3% for AGIs $25k-50k, 0.1% for AGIs $50k-75k, 0.1% for AGIs $75k-100k, 0.2% for AGIs over 100k)
Self-employed pension: $9,833 (reported on 0.3% of returns)
Here:
$9,833
Illinois:
$16,965
Total itemized deductions: $16,472 (24% of AGI, reported on 58.2% of returns)
Here:
$16,472
State:
$20,239
Here:
23.8% of AGI
State:
19.5% of AGI
(% of AGI for various income ranges: 23.0% for AGIs below $10k, 21.0% for AGIs $10k-25k, 21.6% for AGIs $25k-50k, 20.3% for AGIs $50k-75k, 18.7% for AGIs $75k-100k, 15.4% for AGIs over 100k)
Charity contributions deductions: $1,597 (2% of AGI, reported on 51.0% of returns)
Here:
$1,597
State:
$3,719
Here:
2.2% of AGI
State:
3.4% of AGI
(% of AGI for various income ranges: 0.8% for AGIs below $10k, 1.1% for AGIs $10k-25k, 1.5% for AGIs $25k-50k, 1.7% for AGIs $50k-75k, 1.7% for AGIs $75k-100k, 1.6% for AGIs over 100k)
Total tax: $6,238 (reported on 81.9% of returns)
60042:
$6,238
State:
$9,882
(% of AGI for various income ranges: 3.5% for AGIs below $10k, 4.4% for AGIs $10k-25k, 7.0% for AGIs $25k-50k, 8.5% for AGIs $50k-75k, 9.8% for AGIs $75k-100k, 15.5% for AGIs over 100k)
Earned income credit: $1,578 (reported on 8.1% of returns)
Here:
$1,578
State:
$1,788
Percentage of individuals using paid preparers for their 2004 taxes: 56.4%
Here:
56%
State:
61%
(% for various income ranges: 44.0% for AGIs below $10k, 58.7% for AGIs $10k-25k, 60.1% for AGIs $25k-50k, 56.5% for AGIs $50k-75k, 59.2% for AGIs $75k-100k, 59.9% for AGIs over 100k)
Likely homosexual households (counted as self-reported same-sex unmarried-partner households)
Lesbian couples: 0.0% of all households
Gay men: 0.2% of all households
Household received Food Stamps/SNAP in the past 12 months: 152 Household did not receive Food Stamps/SNAP in the past 12 months: 2,976
Women who had a birth in the past 12 months: 102 (91 now married, 10 unmarried) Women who did not have a birth in the past 12 months: 1,835 (883 now married, 945 unmarried)
Housing units in zip code 60042 with a mortgage: 1,759 (140 second mortgage, 103 both second mortgage and home equity loan) Median monthly owner costs for units with a mortgage: $1,796 Median monthly owner costs for units without a mortgage: $682
Residents with income below the poverty level in 2022:
This zip code:
9.5%
Whole state:
11.9%
Residents with income below 50% of the poverty level in 2022:
This zip code:
6.8%
Whole state:
5.7%
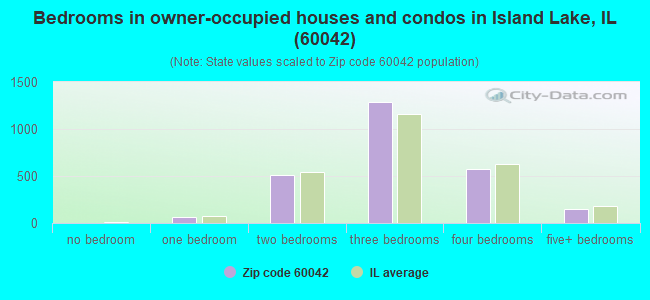
Median number of rooms in houses and condos:
Here:
6.1
State:
6.4
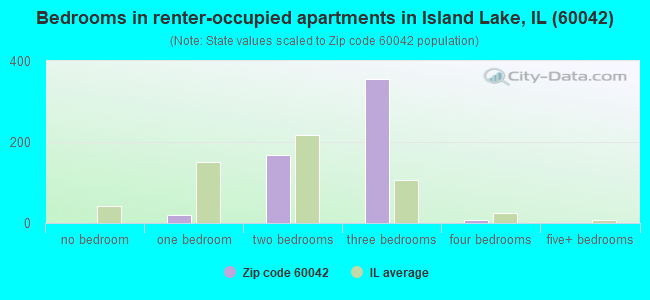
Median number of rooms in apartments:
Here:
5.0
State:
4.1
Notable locations in this zip code not listed on our city pages
In group quarters: 75 (-1 institutionalized population)
Size of family households: 818 2-persons, 440 3-persons, 460 4-persons, 241 5-persons, 99 6-persons, 48 7-or-more-persons
Size of nonfamily households: 675 1-person, 347 2-persons, 30 3-persons
1,360 married couples with children.
258 single-parent households (135 men, 123 women).
78.9% of residents of 60042 zip code speak English at home.
15.6% of residents speak Spanish at home (71% very well, 22% well, 6% not well, 2% not at all).
2.9% of residents speak other Indo-European language at home (81% very well, 16% well, 3% not well).
1.8% of residents speak Asian or Pacific Island language at home (52% very well, 13% well, 35% not well).
0.4% of residents speak other language at home (100% very well).
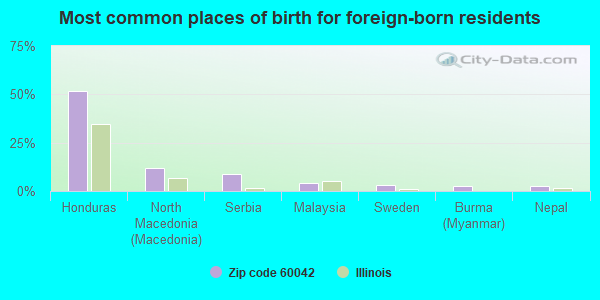
Foreign born population: 1,221 (14.4%) (54.6% of them are naturalized citizens)
This zip code:
14.4%
Whole state:
14.4%
52%Honduras
12%North Macedonia (Macedonia)
9%Serbia
4%Malaysia
3%Sweden
3%Burma (Myanmar)
3%Nepal
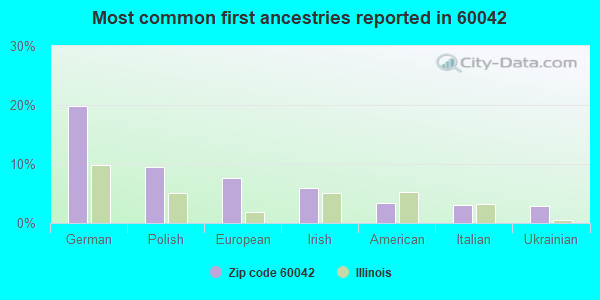
20%German
10%Polish
8%European
6%Irish
3%American
3%Italian
3%Ukrainian
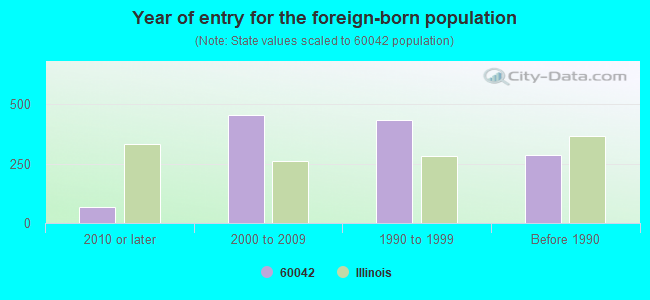
Year of entry for the foreign-born population
682010 or later
4552000 to 2009
4351990 to 1999
286Before 1990
Facilities with environmental interests located in this zip code:
ISLAND LAKE FOODS (ROUTE 176 in ISLAND LAKE, IL)
STATE MASTER (Illinois EPA Project) - AIR PROGRAM AIR MINOR (AIRS/AFS) CRITERIA AND HAZARDOUS AIR POLLUTANT INVENTORY (Inventory of air pollution sources) Business SIC classification: GROCERY STORES
JANET DRIVE ELEVATED TANK (JANET DRIVE in ISLAND LAKE, IL)
STATE MASTER (Illinois EPA Project) - HAZARDOUS WASTE PROGRAM HAZARDOUS WASTE BIENNIAL REPORTER (Resource Conservation and Recovery Act (tracking hazardous waste)) Large Quantity Generators, more that 1000 kg of hazardous waste/month (Resource Conservation and Recovery Act (tracking hazardous waste)) - notification Organizations: VILLAGE OF ISLAND LAKE (CONTACT/OWNER)
J&L OIL INC (226 E STATE RD in ISLAND LAKE, IL)
STATE MASTER (Illinois EPA Project) - SOLID WASTE PROGRAM, AIR PROGRAM AIR MINOR (AIRS/AFS) CRITERIA AND HAZARDOUS AIR POLLUTANT INVENTORY (Inventory of air pollution sources) Business SIC classification: GASOLINE SERVICE STATIONS
CRYSTAL VALLEY RV (RTE 176 & DARRELL RD in ISLAND LAKE, IL)
STATE MASTER (Illinois EPA Project) - HAZARDOUS WASTE PROGRAM, SOLID WASTE PROGRAM Conditionally Exempt Small Quantity Generators, less than 100 kg/month of hazardous waste (Resource Conservation and Recovery Act (tracking hazardous waste)) Organizations: JIM EBEL (CONTACT/OPERATOR)
, FREEDOM ROADS (CONTACT/OWNER)
KEMPER VALVE & FITTINGS CORP (3001 DARRELL RD in ISLAND LAKE, IL)
STATE MASTER (Illinois EPA Project) - SOLID WASTE PROGRAM Small Quantity Generators, between 100 kg and 1000 kg of hazardous waste/month (Resource Conservation and Recovery Act (tracking hazardous waste)) - notification Organizations: JACKSON KEMPER ENTERPRISES (CONTACT/OWNER)
CUSTOM CLASSICS (518 E BURNETT RD in ISLAND LAKE, IL)
STATE MASTER (Illinois EPA Project) - HAZARDOUS WASTE PROGRAM Conditionally Exempt Small Quantity Generators, less than 100 kg/month of hazardous waste (Resource Conservation and Recovery Act (tracking hazardous waste)) - notification Organizations: REEHOFF BRYAN G (CONTACT/OWNER)
COTTON CREEK SCHOOL (545 NEWPORT CT in ISLAND LAKE, IL)
(National Center for Education Statistics) - STATE ID-3404911802007 Organizations: WAUCONDA COMM UNIT S DIST 118 (SCHOOL DISTRICT)
NORTHERN MORAINE WW REC DIST (420 TIMBER TRAIL in ISLAND LAKE, IL)
National Pollutant Discharge Elimination System MAJOR (Tracking pollutant discharge elimination systems) - permit National Pollutant Discharge Elimination System NON-MAJOR (Tracking pollutant discharge elimination systems) - permit Business SIC classification: SEWERAGE SYSTEMS Alternative names: ISLAND LAKE SCHOOL DISTRICT WASTE WATER TREATMENT FACILITY, ISLAND LAKE SD WWTF, ISLAND LAKE SD WWTP
NORTHERN MORAINE WRD (PO BOX 240 in ISLAND LAKE, IL)
National Pollutant Discharge Elimination System NON-MAJOR (Tracking pollutant discharge elimination systems) - permit Alternative names: NORTHERN MORAINE WW RECLAMATN
AMRICHS ISLAND LAKE AUTO SC (128 E STATE RD in ISLAND LAKE, IL)
Conditionally Exempt Small Quantity Generators, less than 100 kg/month of hazardous waste (Resource Conservation and Recovery Act (tracking hazardous waste)) - notification Organizations: AMRICHS ISLAND LAKE AUTO SVC (CONTACT/OWNER)
ISLAND LAKE CLEANERS (125 10 E ST RD in ISLAND LAKE, IL)
Small Quantity Generators, between 100 kg and 1000 kg of hazardous waste/month (Resource Conservation and Recovery Act (tracking hazardous waste)) - notification Organizations: CHOE WON SIK (CONTACT/OWNER)
COLONIAL SERVICES (229 W STATE RD in ISLAND LAKE, IL)
Conditionally Exempt Small Quantity Generators, less than 100 kg/month of hazardous waste (Resource Conservation and Recovery Act (tracking hazardous waste)) - notification
Housing units lacking complete plumbing facilities: 0.5% Housing units lacking complete kitchen facilities: 0.5%
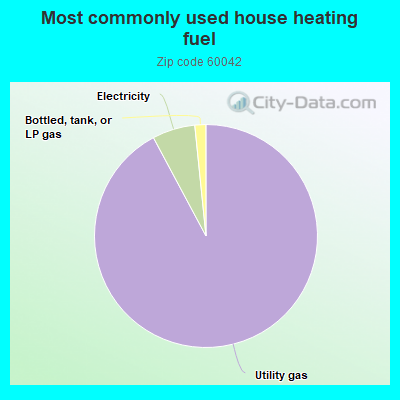
92.2%Utility gas
6.2%Electricity
1.6%Bottled, tank, or LP gas
Population in 1990: 3,919. Population change in the 1990s: +4,958 (+126.5%).
Place of birth for U.S.-born residents:
This state: 5,952
Northeast: 93
Midwest: 795
South: 88
West: 235
58% of the 60042 zip code residents lived in the same house 5 years ago. Out of people who lived in different houses, 26% lived in this county. Out of people who lived in different counties, 50% lived in Illinois.
89% of the 60042 zip code residents lived in the same house 1 year ago. Out of people who lived in different houses, 35% moved from this county. Out of people who lived in different houses, 63% moved from different county within same state. Out of people who lived in different houses, 3% moved from different state. Out of people who lived in different houses, 1% moved from abroad.
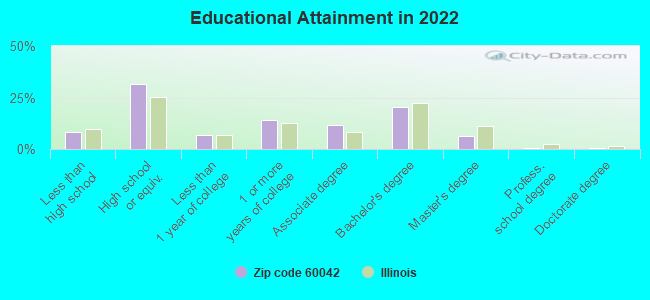
Private vs. public school enrollment:
Students in private schools in grades 1 to 8 (elementary and middle school): 15
Here:
2.7%
Illinois:
13.3%
Students in private schools in grades 9 to 12 (high school): 7
Here:
1.9%
Illinois:
9.9%
Students in private undergraduate colleges: 27
Here:
10.6%
Illinois:
27.4%
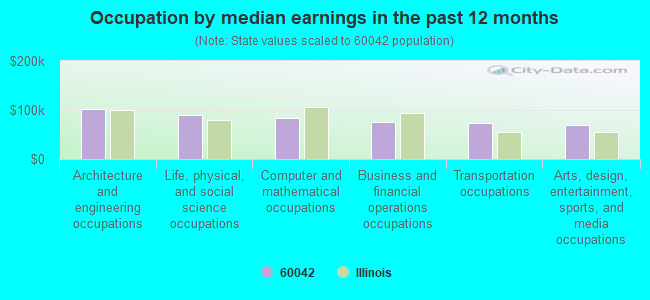
Occupation by median earnings in the past 12 months ($)
101,219Architecture and engineering occupations
89,642Life, physical, and social science occupations
83,094Computer and mathematical occupations
76,094Business and financial operations occupations
73,174Transportation occupations
70,389Arts, design, entertainment, sports, and media occupations
Top industries in this zip code by the number of employees in 2005:
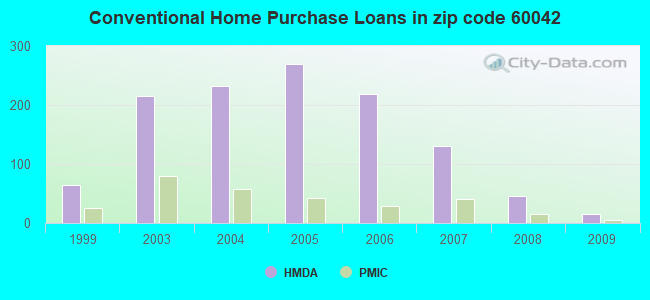
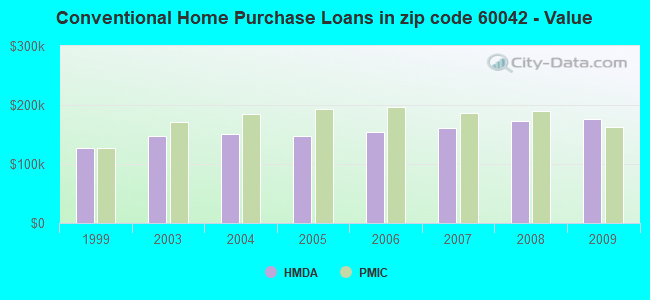
Detailed PMIC statistics for the following Tracts:8642.03
, 8708.12
2002 - 2018 National Fire Incident Reporting System (NFIRS) incidents
Based on the data from the years 2002 - 2018 the average number of fire incidents per year is 25. The highest number of reported fire incidents - 36 took place in 2003, and the least - 14 in 2010. The data has a decreasing trend.
When looking into fire subcategories, the most incidents belonged to: Structure Fires (47.1%), and Outside Fires (36.0%).
Fire incident types reported to NFIRS in Zip Code 60042


 Nearest zip codes: 60084, 60013, 60051, 60021, 60041, 60050.
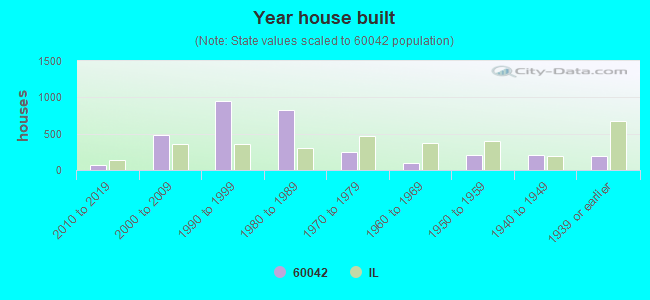


 Based on the data from the years 2002 - 2018 the average number of fire incidents per year is 25. The highest number of reported fire incidents - 36 took place in 2003, and the least - 14 in 2010. The data has a decreasing trend.
 When looking into fire subcategories, the most incidents belonged to: Structure Fires (47.1%), and Outside Fires (36.0%).