Estimated zip code population in 2022: 5,233 Zip code population in 2010: 5,696 Zip code population in 2000: 5,077
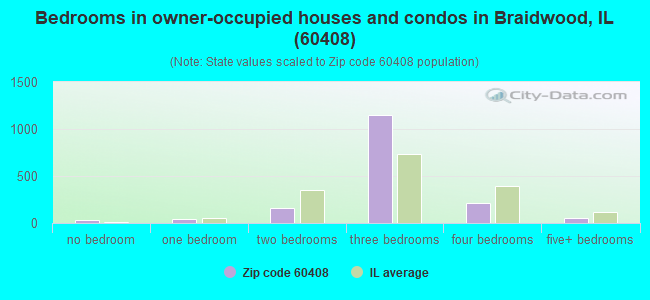
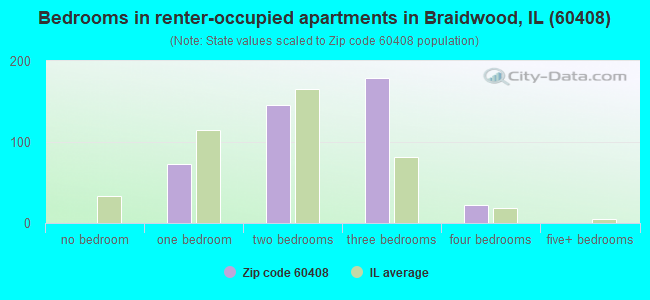
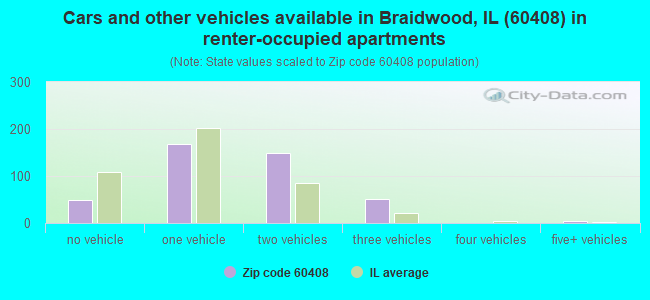
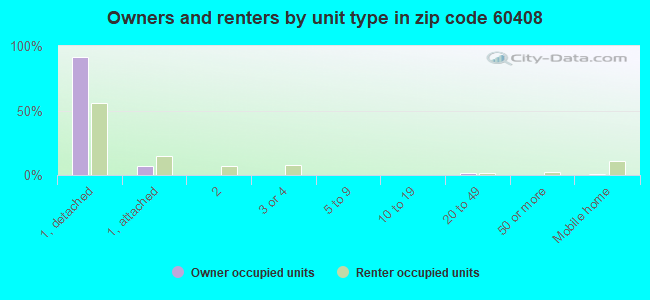
Houses and condos: 2,133 Renter-occupied apartments: 431
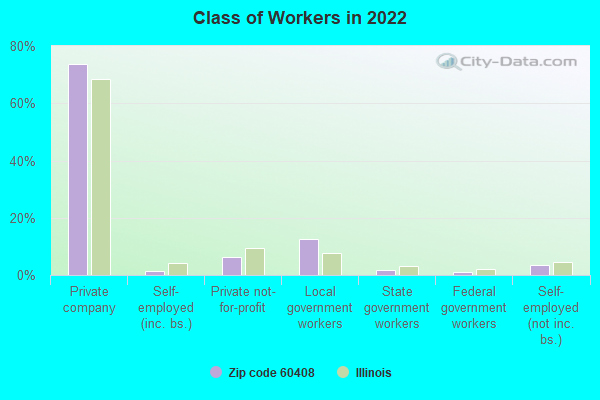
% of renters here:
21%
State:
33%
March 2022 cost of living index in zip code 60408: 99.2 (near average, U.S. average is 100)
Land area: 7.5 sq. mi. Water area: 0.2 sq. mi.
Population density: 699 people per square mile
(low).
OSM Map
General Map
Google Map
MSN Map
OSM Map
General Map
Google Map
MSN Map
OSM Map
General Map
Google Map
MSN Map
OSM Map
General Map
Google Map
MSN Map
Please wait while loading the map...
Real estate property taxes paid for housing units in 2022:
This zip code:
1.8% ($3,802)
Illinois:
2.0% ($4,912)
Median real estate property taxes paid for housing units with mortgages in 2022: $3,856 (1.7%) Median real estate property taxes paid for housing units with no mortgage in 2022: $3,654 (1.8%)
Business Search- 14 Million verified businesses
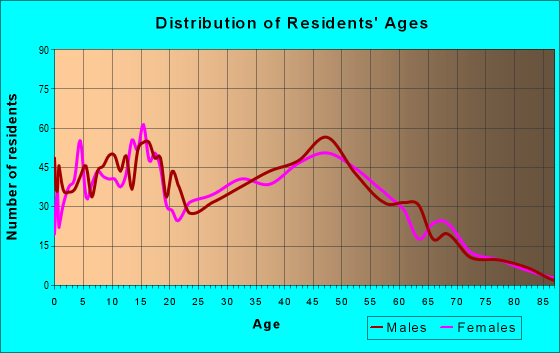
Males: 2,595
(49.6%)
Females: 2,638
(50.4%)
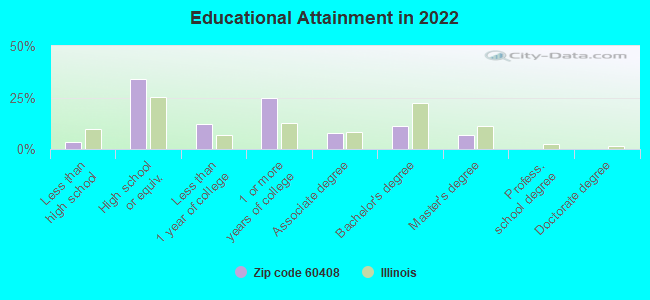
For population 25 years and over in 60408:
High school or higher: 95.9%
Bachelor's degree or higher: 17.9%
Graduate or professional degree: 6.7%
Unemployed: 3.2%
Mean travel time to work (commute): 27.8 minutes
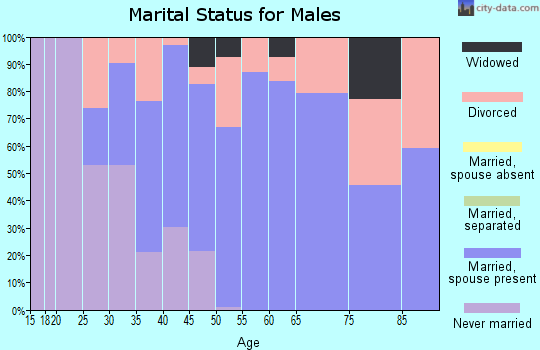
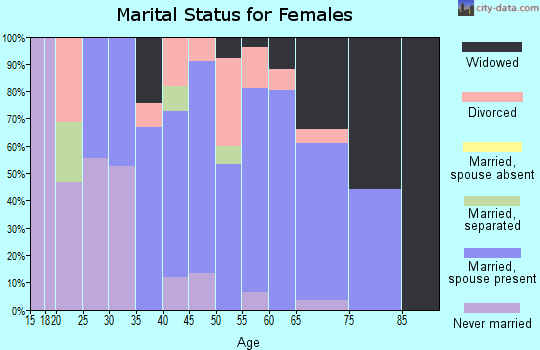
For population 15 years and over in 60408:
Never married: 31.4%
Now married: 56.7%
Separated: 0.2%
Widowed: 3.2%
Divorced: 8.5%
Zip code 60408 compared to state average:
Black race population percentage significantly below state average.
Hispanic race population percentage significantly below state average.
Foreign-born population percentage significantly below state average.
Renting percentage below state average.
Length of stay since moving in significantly above state average.
House age below state average.
Percentage of population with a bachelor's degree or higher below state average.
Averages for the 2020 tax year for zip code 60408, filed in 2021:
Average Adjusted Gross Income (AGI) in 2020: $62,120 (Individual Income Tax Returns)
Here:
$62,120
State:
$82,626
Salary/wage: $56,525 (reported on 83.0% of returns)
Here:
$56,525
State:
$66,640
(% of AGI for various income ranges: 1063.3% for AGIs below $25k, 3211.5% for AGIs $25k-50k, 5666.8% for AGIs $50k-75k, 8514.3% for AGIs $75k-100k, 14247.0% for AGIs $100k-200k, 39790.0% for AGIs over 200k)
Taxable interest for individuals: $933 (reported on 20.5% of returns)
This zip code:
$933
Illinois:
$2,376
(% of AGI for various income ranges: 9.8% for AGIs below $25k, 11.0% for AGIs $25k-50k, 38.9% for AGIs $50k-75k, 20.0% for AGIs $75k-100k, 47.0% for AGIs $100k-200k, 185.0% for AGIs over 200k)
Ordinary dividends: $2,368 (reported on 14.5% of returns)
Here:
$2,368
State:
$9,061
(% of AGI for various income ranges: 16.7% for AGIs below $25k, 27.7% for AGIs $25k-50k, 28.6% for AGIs $50k-75k, 39.6% for AGIs $75k-100k, 127.5% for AGIs $100k-200k)
Net capital gain/loss in AGI: +$4,479 (reported on 11.7% of returns)
Here:
+$4,479
State:
+$31,684
(% of AGI for various income ranges: 10.3% for AGIs below $25k, 18.3% for AGIs $25k-50k, 29.7% for AGIs $50k-75k, 45.4% for AGIs $75k-100k, 271.0% for AGIs $100k-200k)
Profit/loss from business: +$7,159 (reported on 10.2% of returns)
Here:
+$7,159
State:
+$12,175
(% of AGI for various income ranges: 109.0% for AGIs below $25k, 130.0% for AGIs $25k-50k, 88.1% for AGIs $50k-75k, 77.5% for AGIs $75k-100k, 50.7% for AGIs $100k-200k)
Taxable individual retirement arrangement distribution: $19,342 (reported on 8.5% of returns)
60408:
$19,342
Illinois:
$21,613
(% of AGI for various income ranges: 44.8% for AGIs below $25k, 68.8% for AGIs $25k-50k, 142.4% for AGIs $50k-75k, 261.4% for AGIs $75k-100k, 689.0% for AGIs $100k-200k)
Total itemized deductions: $24,600 (reported on 5.7% of returns)
Here:
$24,600
State:
$34,948
(% of AGI for various income ranges: 111.0% for AGIs below $25k, 160.5% for AGIs $50k-75k, 327.1% for AGIs $75k-100k, 440.0% for AGIs $100k-200k)
Charity contributions: $5,117 (reported on 4.2% of returns)
Here:
$5,117
State:
$13,122
(% of AGI for various income ranges: 30.8% for AGIs $50k-75k, 37.9% for AGIs $75k-100k, 98.5% for AGIs $100k-200k)
Taxes paid: $7,650 (reported on 5.7% of returns)
60408:
$7,650
State:
$8,563
(% of AGI for various income ranges: 23.7% for AGIs below $25k, 57.6% for AGIs $50k-75k, 107.9% for AGIs $75k-100k, 141.8% for AGIs $100k-200k)
Earned income credit: $2,182 (reported on 12.0% of returns)
Here:
$2,182
State:
$2,311
(% of AGI for various income ranges: 73.7% for AGIs below $25k, 57.7% for AGIs $25k-50k)
Percentage of individuals using paid preparers for their 2020 taxes: 94.7%
Here:
95%
State:
93%
(% for various income ranges: 92.6% for AGIs below $25k, 95.2% for AGIs $25k-50k, 95.6% for AGIs $50k-75k, 94.4% for AGIs $75k-100k, 96.3% for AGIs $100k-200k, 100.0% for AGIs over 200k)
Averages for the 2012 tax year for zip code 60408, filed in 2013:
Average Adjusted Gross Income (AGI) in 2012: $53,841 (Individual Income Tax Returns)
Here:
$53,841
State:
$68,058
Salary/wage: $48,707 (reported on 87.6% of returns)
Here:
$48,707
State:
$55,396
(% of AGI for various income ranges: 70.5% for AGIs below $25k, 76.4% for AGIs $25k-50k, 76.3% for AGIs $50k-75k, 81.6% for AGIs $75k-100k, 86.1% for AGIs $100k-200k, 59.8% for AGIs over 200k)
Taxable interest for individuals: $505 (reported on 29.8% of returns)
This zip code:
$505
Illinois:
$1,969
(% of AGI for various income ranges: 0.6% for AGIs below $25k, 0.6% for AGIs $25k-50k, 0.3% for AGIs $50k-75k, 0.2% for AGIs $75k-100k, 0.2% for AGIs $100k-200k)
Ordinary dividends: $1,778 (reported on 16.7% of returns)
Here:
$1,778
State:
$7,786
(% of AGI for various income ranges: 1.0% for AGIs below $25k, 0.5% for AGIs $25k-50k, 1.0% for AGIs $50k-75k, 0.2% for AGIs $75k-100k, 0.5% for AGIs $100k-200k)
Profit/loss from business: +$5,508 (reported on 9.5% of returns)
Here:
+$5,508
State:
+$12,903
(% of AGI for various income ranges: 4.8% for AGIs below $25k, 0.4% for AGIs $25k-50k, 1.6% for AGIs $50k-75k, 1.1% for AGIs $75k-100k)
Taxable individual retirement arrangement distribution: $14,230 (reported on 8.4% of returns)
60408:
$14,230
Illinois:
$17,929
(% of AGI for various income ranges: 2.8% for AGIs below $25k, 2.5% for AGIs $25k-50k, 1.6% for AGIs $50k-75k, 2.5% for AGIs $75k-100k, 2.5% for AGIs $100k-200k)
Total itemized deductions: $18,171 (21% of AGI, reported on 38.2% of returns)
Here:
$18,171
State:
$26,433
Here:
20.8% of AGI
State:
19.2% of AGI
(% of AGI for various income ranges: 8.4% for AGIs below $25k, 11.4% for AGIs $25k-50k, 14.1% for AGIs $50k-75k, 13.7% for AGIs $75k-100k, 14.2% for AGIs $100k-200k, 8.1% for AGIs over 200k)
Charity contributions: $1,840 (reported on 29.8% of returns)
Here:
$1,840
State:
$4,525
(% of AGI for various income ranges: 0.5% for AGIs below $25k, 0.8% for AGIs $25k-50k, 1.1% for AGIs $50k-75k, 0.9% for AGIs $75k-100k, 1.3% for AGIs $100k-200k, 0.9% for AGIs over 200k)
Taxes paid: $7,055 (reported on 38.2% of returns)
60408:
$7,055
State:
$11,968
(% of AGI for various income ranges: 2.1% for AGIs below $25k, 3.5% for AGIs $25k-50k, 4.7% for AGIs $50k-75k, 5.4% for AGIs $75k-100k, 6.2% for AGIs $100k-200k, 4.8% for AGIs over 200k)
Earned income credit: $2,247 (reported on 13.8% of returns)
Here:
$2,247
State:
$2,349
(% of AGI for various income ranges: 5.9% for AGIs below $25k, 0.9% for AGIs $25k-50k)
Percentage of individuals using paid preparers for their 2012 taxes: 62.2%
Here:
62%
State:
57%
(% for various income ranges: 54.7% for AGIs below $25k, 62.1% for AGIs $25k-50k, 65.9% for AGIs $50k-75k, 66.7% for AGIs $75k-100k, 71.8% for AGIs $100k-200k, 66.7% for AGIs over 200k)
Averages for the 2004 tax year for zip code 60408, filed in 2005:
Average Adjusted Gross Income (AGI) in 2004: $45,292 (Individual Income Tax Returns)
Here:
$45,292
State:
$54,625
Salary/wage: $42,262 (reported on 90.3% of returns)
Here:
$42,262
State:
$46,811
(% of AGI for various income ranges: 94.2% for AGIs below $10k, 70.0% for AGIs $10k-25k, 81.5% for AGIs $25k-50k, 87.4% for AGIs $50k-75k, 88.7% for AGIs $75k-100k, 81.8% for AGIs over 100k)
Taxable interest for individuals: $657 (reported on 44.8% of returns)
This zip code:
$657
Illinois:
$2,101
(% of AGI for various income ranges: 2.4% for AGIs below $10k, 2.3% for AGIs $10k-25k, 0.8% for AGIs $25k-50k, 0.5% for AGIs $50k-75k, 0.3% for AGIs $75k-100k, 0.4% for AGIs over 100k)
Taxable dividends: $736 (reported on 20.5% of returns)
Here:
$736
State:
$4,306
(% of AGI for various income ranges: 2.2% for AGIs below $10k, 1.1% for AGIs $10k-25k, 0.4% for AGIs $25k-50k, 0.2% for AGIs $50k-75k, 0.2% for AGIs $75k-100k, 0.1% for AGIs over 100k)
Net capital gain/loss: +$2,278 (reported on 12.9% of returns)
Here:
+$2,278
State:
+$17,321
(% of AGI for various income ranges: -1.2% for AGIs below $10k, 0.1% for AGIs $10k-25k, -0.2% for AGIs $25k-50k, 0.7% for AGIs $50k-75k, 0.5% for AGIs $75k-100k, 1.8% for AGIs over 100k)
Profit/loss from business: +$3,861 (reported on 9.6% of returns)
Here:
+$3,861
State:
+$11,771
(% of AGI for various income ranges: -3.9% for AGIs below $10k, 1.1% for AGIs $10k-25k, 1.8% for AGIs $25k-50k, 0.2% for AGIs $50k-75k, 0.2% for AGIs $75k-100k, 1.7% for AGIs over 100k)
IRA payment deduction: $3,167 (reported on 1.2% of returns)
60408:
$3,167
Illinois:
$3,087
Total itemized deductions: $15,261 (22% of AGI, reported on 41.5% of returns)
Here:
$15,261
State:
$20,239
Here:
22.3% of AGI
State:
19.5% of AGI
(% of AGI for various income ranges: 8.3% for AGIs below $10k, 10.3% for AGIs $10k-25k, 13.1% for AGIs $25k-50k, 15.5% for AGIs $50k-75k, 14.4% for AGIs $75k-100k, 13.9% for AGIs over 100k)
Charity contributions deductions: $1,651 (2% of AGI, reported on 36.9% of returns)
Here:
$1,651
State:
$3,719
Here:
2.3% of AGI
State:
3.4% of AGI
(% of AGI for various income ranges: 1.0% for AGIs $10k-25k, 1.1% for AGIs $25k-50k, 1.5% for AGIs $50k-75k, 1.4% for AGIs $75k-100k, 1.5% for AGIs over 100k)
Total tax: $5,313 (reported on 77.7% of returns)
60408:
$5,313
State:
$9,882
(% of AGI for various income ranges: 1.9% for AGIs below $10k, 3.6% for AGIs $10k-25k, 6.4% for AGIs $25k-50k, 8.1% for AGIs $50k-75k, 10.0% for AGIs $75k-100k, 14.6% for AGIs over 100k)
Earned income credit: $1,549 (reported on 11.3% of returns)
Here:
$1,549
State:
$1,788
Percentage of individuals using paid preparers for their 2004 taxes: 69.0%
Here:
69%
State:
61%
(% for various income ranges: 58.2% for AGIs below $10k, 68.6% for AGIs $10k-25k, 69.8% for AGIs $25k-50k, 73.6% for AGIs $50k-75k, 70.5% for AGIs $75k-100k, 78.7% for AGIs over 100k)
Household received Food Stamps/SNAP in the past 12 months: 185 Household did not receive Food Stamps/SNAP in the past 12 months: 1,874
Women who had a birth in the past 12 months: 27 (27 now married, 0 unmarried) Women who did not have a birth in the past 12 months: 1,124 (522 now married, 599 unmarried)
Housing units in zip code 60408 with a mortgage: 1,061 (59 second mortgage, 5 home equity loan, 16 both second mortgage and home equity loan) Houses without a mortgage: 14
Median monthly owner costs for units with a mortgage: $1,414 Median monthly owner costs for units without a mortgage: $669
Residents with income below the poverty level in 2022:
This zip code:
7.3%
Whole state:
11.9%
Residents with income below 50% of the poverty level in 2022:
This zip code:
2.4%
Whole state:
5.7%
Median number of rooms in houses and condos:
Here:
6.1
State:
6.4
Median number of rooms in apartments:
Here:
4.9
State:
4.1
Notable locations in this zip code not listed on our city pages
Churches in zip code 60408 include: First Presbyterian Church (A), Immaculate Conception Church (B), Main Street Baptist Church (C). Display/hide their locations on the map
In group quarters: 13 (-1 institutionalized population)
Size of family households: 656 2-persons, 436 3-persons, 208 4-persons, 103 5-persons, 43 6-persons, 15 7-or-more-persons
Size of nonfamily households: 440 1-person, 141 2-persons, 27 4-persons
913 married couples with children.
140 single-parent households (72 men, 68 women).
96.5% of residents of 60408 zip code speak English at home.
1.6% of residents speak Spanish at home (89% very well, 11% well).
1.0% of residents speak other Indo-European language at home (32% very well, 68% well).
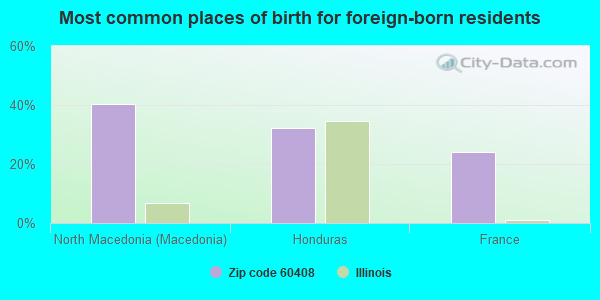
Foreign born population: 62 (1.2%) (59.9% of them are naturalized citizens)
This zip code:
1.2%
Whole state:
14.4%
40%North Macedonia (Macedonia)
32%Honduras
24%France
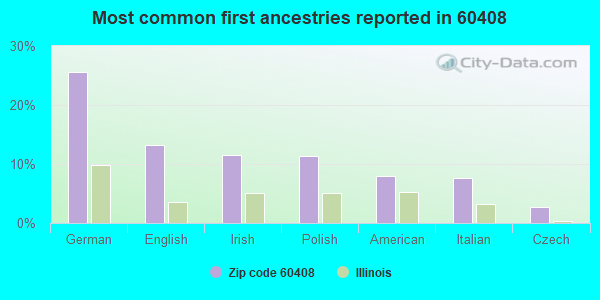
26%German
13%English
12%Irish
11%Polish
8%American
8%Italian
3%Czech
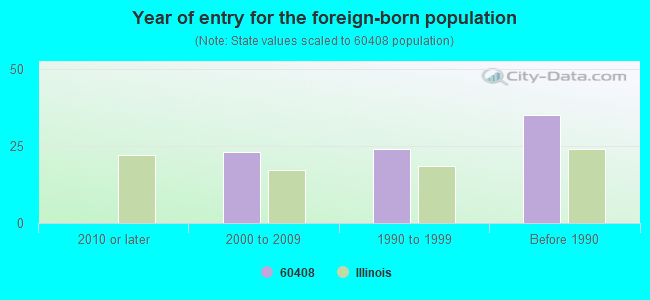
Year of entry for the foreign-born population
02010 or later
232000 to 2009
241990 to 1999
35Before 1990
Facilities with environmental interests located in this zip code:
K & J OIL CO (105 N FRONT ST in BRAIDWOOD, IL)
STATE MASTER (Illinois EPA Project) - AIR PROGRAM AIR MINOR (AIRS/AFS) Business SIC classification: GASOLINE SERVICE STATIONS
KENNEDY & CO (242 N FRONT ST in BRAIDWOOD, IL)
STATE MASTER (Illinois EPA Project) - HAZARDOUS WASTE PROGRAM Small Quantity Generators, between 100 kg and 1000 kg of hazardous waste/month (Resource Conservation and Recovery Act (tracking hazardous waste)) - notification Organizations: KENNEDY KEN (CONTACT/OWNER)
REED-CUSTER HIGH SCHOOL (249 COMET DR in BRAIDWOOD, IL)
(Geographic Names Information System) (National Center for Education Statistics) - STATE ID-56099255U0001 Organizations: REED CUSTER C U SCH DIST 255U (SCHOOL DISTRICT)
REED-CUSTER INTERMEDIATE SCHOOL (162 S SCHOOL ST in BRAIDWOOD, IL)
(National Center for Education Statistics) - STATE ID-56099255U2001 Organizations: REED CUSTER C U SCH DIST 255U (SCHOOL DISTRICT)
REED-CUSTER MIDDLE SCHOOL (407 S COMET DRIVE in BRAIDWOOD, IL)
(National Center for Education Statistics) - STATE ID-56099255U1001 Organizations: REED CUSTER C U SCH DIST 255U (SCHOOL DISTRICT)
ILL BELL TEL CO BRAIDWOOD C D O (RAILROAD AVE N OF MAIN ST in BRAIDWOOD, IL)
Large Quantity Generators, more that 1000 kg of hazardous waste/month (Resource Conservation and Recovery Act (tracking hazardous waste)) - notification
HILEMAN MOTOR MART (500 S WASHINGTON in BRAIDWOOD, IL)
National Pollutant Discharge Elimination System NON-MAJOR (Tracking pollutant discharge elimination systems) - permit
Housing units lacking complete kitchen facilities: 0.3%
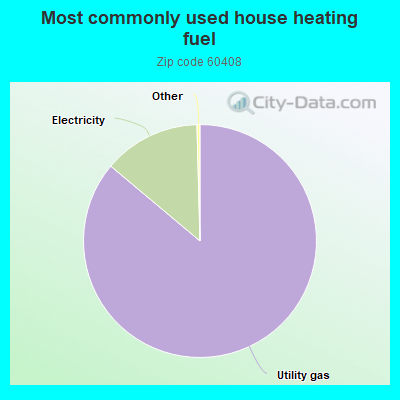
86.2%Utility gas
13.5%Electricity
Population in 1990: 3,814. Population change in the 1990s: +1,263 (+33.1%).
Place of birth for U.S.-born residents:
This state: 4,473
Northeast: 65
Midwest: 335
South: 107
West: 145
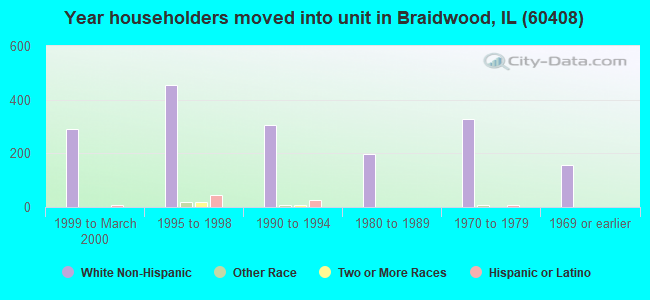
63% of the 60408 zip code residents lived in the same house 5 years ago. Out of people who lived in different houses, 62% lived in this county. Out of people who lived in different counties, 50% lived in Illinois.
95% of the 60408 zip code residents lived in the same house 1 year ago. Out of people who lived in different houses, 37% moved from this county. Out of people who lived in different houses, 57% moved from different county within same state. Out of people who lived in different houses, 9% moved from different state.
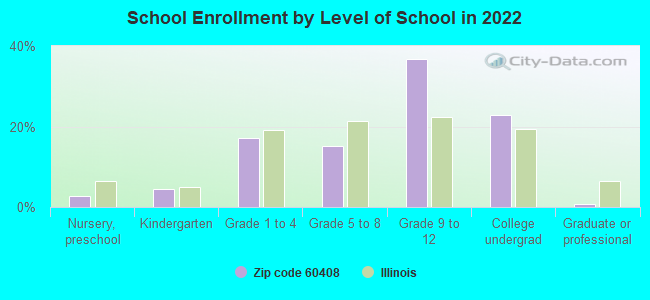
Private vs. public school enrollment:
Students in private schools in grades 1 to 8 (elementary and middle school):
Here:
0.0%
Illinois:
13.3%
Students in private schools in grades 9 to 12 (high school):
Here:
0.0%
Illinois:
9.9%
Students in private undergraduate colleges: 40
Here:
14.2%
Illinois:
27.4%
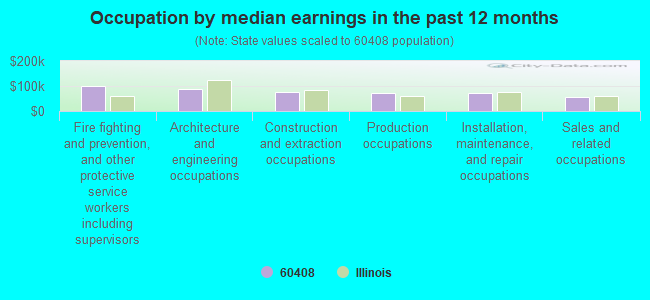
Occupation by median earnings in the past 12 months ($)
99,327Fire fighting and prevention, and other protective service workers including supervisors
86,105Architecture and engineering occupations
74,532Construction and extraction occupations
72,034Production occupations
71,907Installation, maintenance, and repair occupations
57,850Sales and related occupations
Top industries in this zip code by the number of employees in 2005:
Administrative and Support and Waste Management and Remediation Services: Security Guards and Patrol Services (100-249 employees: 1 establishment)
Accommodation and Food Services: Limited-Service Restaurants (20-49: 1, 5-9: 1)
Accommodation and Food Services: Full-Service Restaurants (5-9: 2, 1-4: 2)
Accommodation and Food Services: Drinking Places (Alcoholic Beverages) (10-19: 1)
People in group quarters in 2010:
8 people in group homes intended for adults
Fatal accident statistics in 2010:
Fatal accident count: 1
Vehicles involved in fatal accidents: 1
Fatal accidents caused by drunken drivers: 0
Fatalities: 1
Persons involved in fatal accidents: 1
Pedestrians involved in fatal accidents: 0
Home Mortgage Disclosure Act Aggregated Statistics For Year 2009 (Based on 2 partial tracts)
A) FHA, FSA/RHS & VA Home Purchase Loans
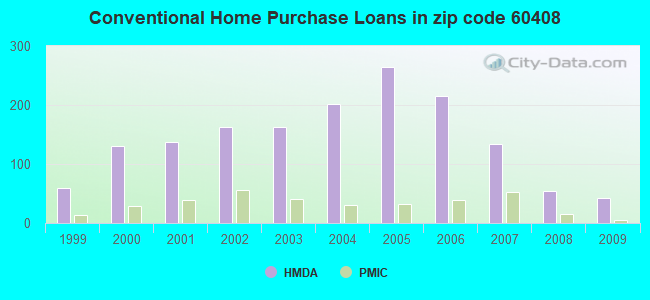
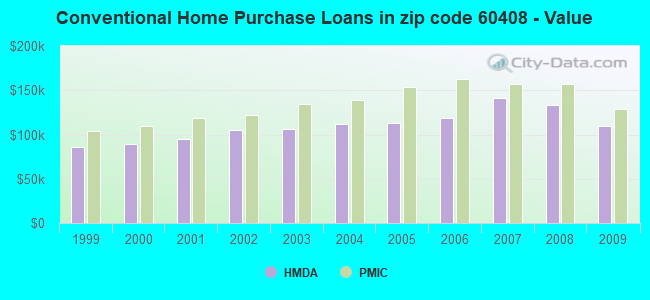
B) Conventional Home Purchase Loans
C) Refinancings
D) Home Improvement Loans
F) Non-occupant Loans on < 5 Family Dwellings (A B C & D)
G) Loans On Manufactured Home Dwelling (A B C & D)
Number
Average Value
Number
Average Value
Number
Average Value
Number
Average Value
Number
Average Value
Number
Average Value
LOANS ORIGINATED
32
$139,170
43
$109,678
239
$146,288
6
$9,708
17
$98,834
11
$68,325
APPLICATIONS APPROVED, NOT ACCEPTED
0
$0
0
$0
17
$150,031
2
$82,810
0
$0
0
$0
APPLICATIONS DENIED
5
$107,138
6
$48,353
56
$143,938
2
$9,710
3
$124,120
7
$63,637
APPLICATIONS WITHDRAWN
2
$165,620
1
$74,240
43
$151,222
0
$0
2
$211,880
0
$0
FILES CLOSED FOR INCOMPLETENESS
0
$0
2
$127,355
13
$138,206
0
$0
0
$0
1
$91,380
Aggregated Statistics For Year 2008 (Based on 2 partial tracts)
A) FHA, FSA/RHS & VA Home Purchase Loans
B) Conventional Home Purchase Loans
C) Refinancings
D) Home Improvement Loans
E) Loans on Dwellings For 5+ Families
F) Non-occupant Loans on < 5 Family Dwellings (A B C & D)
G) Loans On Manufactured Home Dwelling (A B C & D)
Number
Average Value
Number
Average Value
Number
Average Value
Number
Average Value
Number
Average Value
Number
Average Value
Number
Average Value
LOANS ORIGINATED
31
$158,139
54
$133,616
186
$149,542
16
$41,191
1
$549,400
23
$197,104
14
$62,821
APPLICATIONS APPROVED, NOT ACCEPTED
1
$214,730
8
$131,496
15
$136,150
1
$29,700
0
$0
3
$206,357
0
$0
APPLICATIONS DENIED
9
$143,156
17
$156,683
94
$141,256
27
$58,337
0
$0
6
$75,385
5
$32,438
APPLICATIONS WITHDRAWN
5
$168,818
9
$136,810
43
$156,641
3
$192,650
0
$0
0
$0
1
$62,820
FILES CLOSED FOR INCOMPLETENESS
0
$0
1
$196,460
9
$162,066
2
$79,955
0
$0
1
$260,420
0
$0
Aggregated Statistics For Year 2007 (Based on 2 partial tracts)
A) FHA, FSA/RHS & VA Home Purchase Loans
B) Conventional Home Purchase Loans
C) Refinancings
D) Home Improvement Loans
F) Non-occupant Loans on < 5 Family Dwellings (A B C & D)
G) Loans On Manufactured Home Dwelling (A B C & D)
Number
Average Value
Number
Average Value
Number
Average Value
Number
Average Value
Number
Average Value
Number
Average Value
LOANS ORIGINATED
16
$161,122
134
$141,394
210
$129,525
34
$70,245
38
$127,536
22
$71,076
APPLICATIONS APPROVED, NOT ACCEPTED
0
$0
16
$125,713
27
$133,680
2
$21,700
0
$0
3
$111,553
APPLICATIONS DENIED
2
$225,585
21
$146,691
119
$141,978
22
$50,672
7
$65,106
5
$45,232
APPLICATIONS WITHDRAWN
0
$0
17
$134,175
75
$152,461
6
$109,270
1
$260,420
0
$0
FILES CLOSED FOR INCOMPLETENESS
0
$0
10
$253,683
30
$146,202
0
$0
1
$280,980
0
$0
Aggregated Statistics For Year 2006 (Based on 2 partial tracts)
A) FHA, FSA/RHS & VA Home Purchase Loans
B) Conventional Home Purchase Loans
C) Refinancings
D) Home Improvement Loans
F) Non-occupant Loans on < 5 Family Dwellings (A B C & D)
G) Loans On Manufactured Home Dwelling (A B C & D)
Number
Average Value
Number
Average Value
Number
Average Value
Number
Average Value
Number
Average Value
Number
Average Value
LOANS ORIGINATED
24
$167,760
215
$118,938
241
$129,884
26
$46,830
40
$100,228
16
$58,966
APPLICATIONS APPROVED, NOT ACCEPTED
2
$153,625
30
$113,763
39
$123,651
9
$67,009
2
$115,935
6
$78,240
APPLICATIONS DENIED
2
$134,780
39
$124,353
147
$132,278
30
$44,317
3
$233,390
9
$67,263
APPLICATIONS WITHDRAWN
0
$0
25
$113,489
83
$144,495
7
$100,677
5
$167,674
1
$82,240
FILES CLOSED FOR INCOMPLETENESS
0
$0
8
$132,066
37
$143,053
0
$0
1
$79,950
0
$0
Aggregated Statistics For Year 2005 (Based on 2 partial tracts)
A) FHA, FSA/RHS & VA Home Purchase Loans
B) Conventional Home Purchase Loans
C) Refinancings
D) Home Improvement Loans
E) Loans on Dwellings For 5+ Families
F) Non-occupant Loans on < 5 Family Dwellings (A B C & D)
G) Loans On Manufactured Home Dwelling (A B C & D)
Number
Average Value
Number
Average Value
Number
Average Value
Number
Average Value
Number
Average Value
Number
Average Value
Number
Average Value
LOANS ORIGINATED
25
$143,415
264
$112,688
282
$121,442
27
$50,468
1
$399,770
66
$109,790
19
$70,335
APPLICATIONS APPROVED, NOT ACCEPTED
3
$138,587
30
$122,101
47
$126,347
9
$69,928
0
$0
7
$95,129
2
$74,245
APPLICATIONS DENIED
7
$124,337
46
$102,500
151
$125,960
32
$41,083
0
$0
6
$91,757
9
$84,903
APPLICATIONS WITHDRAWN
1
$198,740
31
$89,239
97
$133,096
11
$127,926
0
$0
7
$106,877
1
$57,110
FILES CLOSED FOR INCOMPLETENESS
1
$247,860
7
$93,823
23
$143,917
1
$43,400
0
$0
2
$79,955
0
$0
Aggregated Statistics For Year 2004 (Based on 2 partial tracts)
A) FHA, FSA/RHS & VA Home Purchase Loans
B) Conventional Home Purchase Loans
C) Refinancings
D) Home Improvement Loans
E) Loans on Dwellings For 5+ Families
F) Non-occupant Loans on < 5 Family Dwellings (A B C & D)
G) Loans On Manufactured Home Dwelling (A B C & D)
Number
Average Value
Number
Average Value
Number
Average Value
Number
Average Value
Number
Average Value
Number
Average Value
Number
Average Value
LOANS ORIGINATED
27
$134,060
201
$111,646
257
$120,993
30
$46,944
1
$319,820
47
$91,619
24
$54,255
APPLICATIONS APPROVED, NOT ACCEPTED
1
$118,790
21
$106,061
43
$114,937
5
$24,444
0
$0
6
$96,325
3
$31,600
APPLICATIONS DENIED
8
$121,930
30
$108,090
143
$121,385
22
$48,751
0
$0
6
$95,183
9
$74,497
APPLICATIONS WITHDRAWN
1
$123,360
14
$144,325
74
$121,089
6
$62,250
0
$0
9
$147,598
6
$65,295
FILES CLOSED FOR INCOMPLETENESS
1
$157,620
6
$112,507
41
$146,480
0
$0
0
$0
2
$99,370
0
$0
Aggregated Statistics For Year 2003 (Based on 2 partial tracts)
A) FHA, FSA/RHS & VA Home Purchase Loans
B) Conventional Home Purchase Loans
C) Refinancings
D) Home Improvement Loans
E) Loans on Dwellings For 5+ Families
F) Non-occupant Loans on < 5 Family Dwellings (A B C & D)
Number
Average Value
Number
Average Value
Number
Average Value
Number
Average Value
Number
Average Value
Number
Average Value
LOANS ORIGINATED
41
$123,525
162
$106,218
537
$106,848
21
$23,497
1
$573,380
35
$74,210
APPLICATIONS APPROVED, NOT ACCEPTED
2
$105,080
18
$101,338
54
$112,612
6
$13,135
0
$0
5
$40,890
APPLICATIONS DENIED
3
$194,553
30
$81,248
175
$109,566
23
$28,357
0
$0
10
$67,047
APPLICATIONS WITHDRAWN
1
$163,330
13
$93,045
83
$118,445
5
$32,896
0
$0
0
$0
FILES CLOSED FOR INCOMPLETENESS
1
$138,210
3
$76,147
16
$111,436
1
$22,840
0
$0
0
$0
Aggregated Statistics For Year 2002 (Based on 2 partial tracts)
A) FHA, FSA/RHS & VA Home Purchase Loans
B) Conventional Home Purchase Loans
C) Refinancings
D) Home Improvement Loans
E) Loans on Dwellings For 5+ Families
F) Non-occupant Loans on < 5 Family Dwellings (A B C & D)
Number
Average Value
Number
Average Value
Number
Average Value
Number
Average Value
Number
Average Value
Number
Average Value
LOANS ORIGINATED
21
$109,379
163
$105,110
356
$101,916
17
$38,029
1
$174,760
39
$74,799
APPLICATIONS APPROVED, NOT ACCEPTED
0
$0
14
$140,327
48
$93,018
1
$28,550
0
$0
1
$143,920
APPLICATIONS DENIED
5
$143,460
13
$78,197
99
$91,007
18
$16,308
0
$0
5
$80,640
APPLICATIONS WITHDRAWN
3
$144,297
15
$92,137
48
$103,250
1
$22,840
0
$0
3
$49,877
FILES CLOSED FOR INCOMPLETENESS
1
$90,230
6
$126,403
26
$112,638
1
$8,000
0
$0
1
$57,110
Aggregated Statistics For Year 2001 (Based on 2 partial tracts)
A) FHA, FSA/RHS & VA Home Purchase Loans
B) Conventional Home Purchase Loans
C) Refinancings
D) Home Improvement Loans
F) Non-occupant Loans on < 5 Family Dwellings (A B C & D)
Number
Average Value
Number
Average Value
Number
Average Value
Number
Average Value
Number
Average Value
LOANS ORIGINATED
54
$101,212
137
$95,436
281
$93,575
25
$21,793
29
$69,004
APPLICATIONS APPROVED, NOT ACCEPTED
0
$0
18
$97,658
33
$73,101
3
$53,303
5
$68,988
APPLICATIONS DENIED
2
$150,770
30
$81,172
109
$85,812
27
$29,232
8
$70,816
APPLICATIONS WITHDRAWN
3
$141,253
15
$121,149
59
$89,421
2
$22,845
6
$67,770
FILES CLOSED FOR INCOMPLETENESS
1
$111,940
5
$99,142
23
$97,286
1
$34,270
1
$102,800
Aggregated Statistics For Year 2000 (Based on 2 partial tracts)
A) FHA, FSA/RHS & VA Home Purchase Loans
B) Conventional Home Purchase Loans
C) Refinancings
D) Home Improvement Loans
F) Non-occupant Loans on < 5 Family Dwellings (A B C & D)
Number
Average Value
Number
Average Value
Number
Average Value
Number
Average Value
Number
Average Value
LOANS ORIGINATED
40
$105,596
131
$89,275
107
$84,779
31
$22,365
18
$61,171
APPLICATIONS APPROVED, NOT ACCEPTED
0
$0
7
$96,271
25
$80,091
11
$24,402
0
$0
APPLICATIONS DENIED
5
$85,664
19
$74,003
88
$67,026
24
$28,936
2
$53,110
APPLICATIONS WITHDRAWN
2
$122,215
7
$78,649
37
$76,991
5
$35,180
2
$95,375
FILES CLOSED FOR INCOMPLETENESS
0
$0
2
$167,330
22
$92,466
0
$0
1
$105,080
Aggregated Statistics For Year 1999 (Based on 1 partial tract)
A) FHA, FSA/RHS & VA Home Purchase Loans
B) Conventional Home Purchase Loans
C) Refinancings
D) Home Improvement Loans
E) Loans on Dwellings For 5+ Families
F) Non-occupant Loans on < 5 Family Dwellings (A B C & D)
Detailed PMIC statistics for the following Tracts:8840.01
2002 - 2018 National Fire Incident Reporting System (NFIRS) incidents
Based on the data from the years 2002 - 2018 the average number of fire incidents per year is 37. The highest number of fires - 74 took place in 2011, and the least - 16 in 2016. The data has an increasing trend.
When looking into fire subcategories, the most incidents belonged to: Structure Fires (46.1%), and Outside Fires (30.2%).
Fire incident types reported to NFIRS in Zip Code 60408
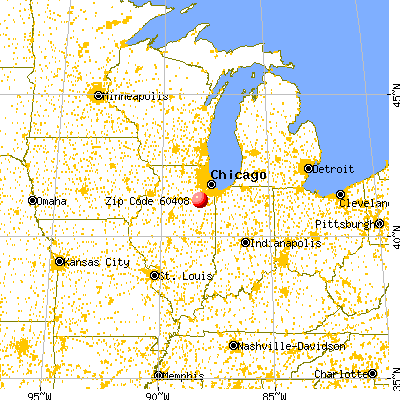


 Nearest zip codes: 60407, 60416, 60474, 60935, 60481, 60424.


 Based on the data from the years 2002 - 2018 the average number of fire incidents per year is 37. The highest number of fires - 74 took place in 2011, and the least - 16 in 2016. The data has an increasing trend.
 When looking into fire subcategories, the most incidents belonged to: Structure Fires (46.1%), and Outside Fires (30.2%).