Estimated zip code population in 2022: 666 Zip code population in 2010: 760 Zip code population in 2000: 717
Houses and condos: 311 Renter-occupied apartments: 70
% of renters here:
23%
State:
33%
March 2022 cost of living index in zip code 60479: 93.5 (less than average, U.S. average is 100)
Land area: 40.8 sq. mi. Water area: 0.1 sq. mi.
Population density: 16 people per square mile
(very low).
OSM Map
General Map
Google Map
MSN Map
OSM Map
General Map
Google Map
MSN Map
OSM Map
General Map
Google Map
MSN Map
OSM Map
General Map
Google Map
MSN Map
Please wait while loading the map...
Real estate property taxes paid for housing units in 2022:
This zip code:
2.0% ($3,965)
Illinois:
2.0% ($4,912)
Median real estate property taxes paid for housing units with mortgages in 2022: $4,537 (1.9%) Median real estate property taxes paid for housing units with no mortgage in 2022: $3,274 (2.7%)
Business Search- 14 Million verified businesses
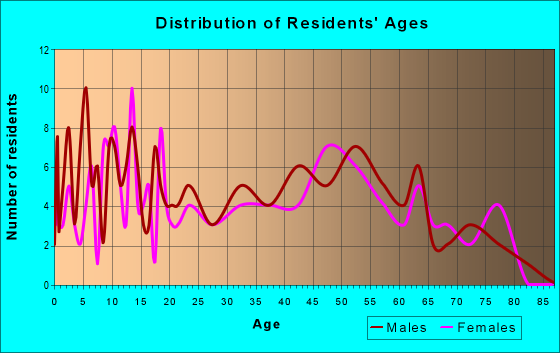
Males: 336
(50.5%)
Females: 330
(49.5%)
For population 25 years and over in 60479:
High school or higher: 95.9%
Bachelor's degree or higher: 21.5%
Graduate or professional degree: 2.4%
Unemployed: 2.3%
Mean travel time to work (commute): 27.9 minutes
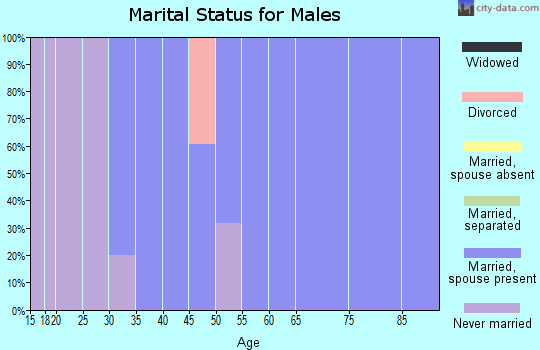
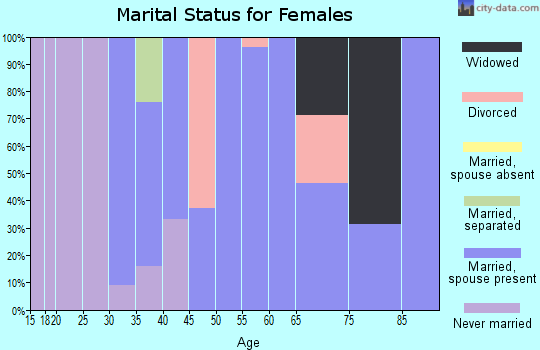
For population 15 years and over in 60479:
Never married: 30.8%
Now married: 54.1%
Separated: 2.7%
Widowed: 1.8%
Divorced: 10.6%
Zip code 60479 compared to state average:
Unemployed percentage below state average.
Black race population percentage significantly below state average.
Hispanic race population percentage below state average.
Median age above state average.
Foreign-born population percentage significantly below state average.
Length of stay since moving in significantly above state average.
Percentage of population with a bachelor's degree or higher below state average.
Averages for the 2020 tax year for zip code 60479, filed in 2021:
Average Adjusted Gross Income (AGI) in 2020: $77,151 (Individual Income Tax Returns)
Here:
$77,151
State:
$82,626
Salary/wage: $62,569 (reported on 82.9% of returns)
Here:
$62,569
State:
$66,640
(% of AGI for various income ranges: 924.4% for AGIs below $25k, 3830.0% for AGIs $25k-50k, 6066.7% for AGIs $50k-75k, 8985.0% for AGIs $75k-100k, 17377.1% for AGIs $100k-200k)
Taxable interest for individuals: $642 (reported on 34.3% of returns)
This zip code:
$642
Illinois:
$2,376
(% of AGI for various income ranges: 4.4% for AGIs below $25k, 46.7% for AGIs $50k-75k, 84.3% for AGIs $100k-200k)
Ordinary dividends: $2,512 (reported on 22.9% of returns)
Here:
$2,512
State:
$9,061
(% of AGI for various income ranges: 140.0% for AGIs $25k-50k, 207.1% for AGIs $100k-200k)
Net capital gain/loss in AGI: +$4,612 (reported on 22.9% of returns)
Here:
+$4,612
State:
+$31,684
(% of AGI for various income ranges: 6.7% for AGIs below $25k, 518.6% for AGIs $100k-200k)
Profit/loss from business: +$6,700 (reported on 11.4% of returns)
Here:
+$6,700
State:
+$12,175
(% of AGI for various income ranges: 1340.0% for AGIs $75k-100k)
Taxable individual retirement arrangement distribution: $16,700 (reported on 8.6% of returns)
60479:
$16,700
Illinois:
$21,613
(% of AGI for various income ranges: 1252.5% for AGIs $25k-50k)
Earned income credit: $2,025 (reported on 11.4% of returns)
Here:
$2,025
State:
$2,311
(% of AGI for various income ranges: 90.0% for AGIs below $25k)
Percentage of individuals using paid preparers for their 2020 taxes: 94.3%
Here:
94%
State:
93%
(% for various income ranges: 100.0% for AGIs below $25k, 83.3% for AGIs $25k-50k, 100.0% for AGIs $50k-75k, 100.0% for AGIs $75k-100k, 90.9% for AGIs $100k-200k)
Averages for the 2012 tax year for zip code 60479, filed in 2013:
Average Adjusted Gross Income (AGI) in 2012: $66,155 (Individual Income Tax Returns)
Here:
$66,155
State:
$68,058
Salary/wage: $54,835 (reported on 78.8% of returns)
Here:
$54,835
State:
$55,396
(% of AGI for various income ranges: 73.0% for AGIs below $25k, 65.6% for AGIs $25k-50k, 66.2% for AGIs $50k-75k, 73.9% for AGIs $75k-100k, 61.4% for AGIs $100k-200k)
Taxable interest for individuals: $775 (reported on 48.5% of returns)
This zip code:
$775
Illinois:
$1,969
(% of AGI for various income ranges: 0.4% for AGIs below $25k, 1.6% for AGIs $25k-50k, 0.3% for AGIs $75k-100k, 0.5% for AGIs $100k-200k)
Ordinary dividends: $1,210 (reported on 30.3% of returns)
Here:
$1,210
State:
$7,786
(% of AGI for various income ranges: 1.8% for AGIs $25k-50k, 1.5% for AGIs $50k-75k, 0.4% for AGIs $100k-200k)
Net capital gain/loss in AGI: +$333 (reported on 18.2% of returns)
Here:
+$333
State:
+$22,183
Profit/loss from business: +$8,875 (reported on 12.1% of returns)
Here:
+$8,875
State:
+$12,903
Taxable individual retirement arrangement distribution: $7,000 (reported on 9.1% of returns)
60479:
$7,000
Illinois:
$17,929
Total itemized deductions: $20,323 (20% of AGI, reported on 39.4% of returns)
Here:
$20,323
State:
$26,433
Here:
19.6% of AGI
State:
19.2% of AGI
(% of AGI for various income ranges: 29.8% for AGIs $25k-50k, 13.8% for AGIs $75k-100k, 11.2% for AGIs $100k-200k)
Charity contributions: $2,920 (reported on 30.3% of returns)
Here:
$2,920
State:
$4,525
(% of AGI for various income ranges: 1.2% for AGIs $25k-50k, 1.7% for AGIs $75k-100k, 1.6% for AGIs $100k-200k)
Taxes paid: $8,538 (reported on 39.4% of returns)
60479:
$8,538
State:
$11,968
(% of AGI for various income ranges: 8.3% for AGIs $25k-50k, 5.9% for AGIs $75k-100k, 5.5% for AGIs $100k-200k)
Earned income credit: $2,150 (reported on 12.1% of returns)
Here:
$2,150
State:
$2,349
(% of AGI for various income ranges: 6.5% for AGIs below $25k)
Percentage of individuals using paid preparers for their 2012 taxes: 66.7%
Here:
67%
State:
57%
(% for various income ranges: 63.6% for AGIs below $25k, 57.1% for AGIs $25k-50k, 66.7% for AGIs $50k-75k, 75.0% for AGIs $75k-100k, 75.0% for AGIs $100k-200k)
Averages for the 2004 tax year for zip code 60479, filed in 2005:
Average Adjusted Gross Income (AGI) in 2004: $45,626 (Individual Income Tax Returns)
Here:
$45,626
State:
$54,625
Salary/wage: $42,444 (reported on 82.1% of returns)
Here:
$42,444
State:
$46,811
(% of AGI for various income ranges: 133.3% for AGIs below $10k, 68.5% for AGIs $10k-25k, 65.3% for AGIs $25k-50k, 82.3% for AGIs $50k-75k, 78.8% for AGIs $75k-100k, 74.2% for AGIs over 100k)
Taxable interest for individuals: $1,088 (reported on 59.0% of returns)
This zip code:
$1,088
Illinois:
$2,101
(% of AGI for various income ranges: 5.8% for AGIs below $10k, 2.9% for AGIs $10k-25k, 1.7% for AGIs $25k-50k, 2.6% for AGIs $50k-75k, 0.5% for AGIs $75k-100k, 0.2% for AGIs over 100k)
Taxable dividends: $609 (reported on 26.4% of returns)
Here:
$609
State:
$4,306
(% of AGI for various income ranges: 1.1% for AGIs $10k-25k, 0.8% for AGIs $25k-50k, 0.2% for AGIs $50k-75k, 0.3% for AGIs $75k-100k, 0.1% for AGIs over 100k)
Net capital gain/loss: +$317 (reported on 18.2% of returns)
Here:
+$317
State:
+$17,321
(% of AGI for various income ranges: -0.8% for AGIs $10k-25k, 0.1% for AGIs $25k-50k, -0.3% for AGIs $50k-75k, 1.0% for AGIs $75k-100k)
Profit/loss from business: +$816 (reported on 11.6% of returns)
Here:
+$816
State:
+$11,771
Profit/loss from farming: +$6,800 (reported on 9.1% of returns)
Here:
+$6,800
State:
+$2,327
Total itemized deductions: $17,387 (24% of AGI, reported on 37.7% of returns)
Here:
$17,387
State:
$20,239
Here:
23.8% of AGI
State:
19.5% of AGI
(% of AGI for various income ranges: 14.4% for AGIs $10k-25k, 12.7% for AGIs $25k-50k, 11.6% for AGIs $50k-75k, 16.7% for AGIs $75k-100k, 16.8% for AGIs over 100k)
Charity contributions deductions: $2,648 (3% of AGI, reported on 31.9% of returns)
Here:
$2,648
State:
$3,719
Here:
3.4% of AGI
State:
3.4% of AGI
(% of AGI for various income ranges: 1.6% for AGIs $25k-50k, 0.9% for AGIs $50k-75k, 2.7% for AGIs $75k-100k, 2.8% for AGIs over 100k)
Total tax: $5,371 (reported on 82.7% of returns)
60479:
$5,371
State:
$9,882
(% of AGI for various income ranges: 5.3% for AGIs below $10k, 5.1% for AGIs $10k-25k, 7.5% for AGIs $25k-50k, 8.6% for AGIs $50k-75k, 10.7% for AGIs $75k-100k, 13.0% for AGIs over 100k)
Earned income credit: $1,556 (reported on 5.5% of returns)
Here:
$1,556
State:
$1,788
Percentage of individuals using paid preparers for their 2004 taxes: 74.8%
Here:
75%
State:
61%
(% for various income ranges: 57.8% for AGIs below $10k, 75.4% for AGIs $10k-25k, 85.3% for AGIs $25k-50k, 79.4% for AGIs $50k-75k, 76.7% for AGIs $75k-100k, 73.3% for AGIs over 100k)
Household received Food Stamps/SNAP in the past 12 months: 21 Household did not receive Food Stamps/SNAP in the past 12 months: 283
Women who had a birth in the past 12 months: 4 (4 now married, 0 unmarried) Women who did not have a birth in the past 12 months: 177 (57 now married, 120 unmarried)
Housing units in zip code 60479 with a mortgage: 149 (1 second mortgage, 1 both second mortgage and home equity loan) Houses without a mortgage: 6
Median monthly owner costs for units with a mortgage: $1,936 Median monthly owner costs for units without a mortgage: $718
Residents with income below the poverty level in 2022:
This zip code:
12.3%
Whole state:
11.9%
Residents with income below 50% of the poverty level in 2022:
This zip code:
11.1%
Whole state:
5.7%
Median number of rooms in houses and condos:
Here:
6.5
State:
6.4
Median number of rooms in apartments:
Here:
5.7
State:
4.1
Notable locations in this zip code not listed on our city pages
Size of family households: 123 2-persons, 24 3-persons, 36 4-persons, 13 5-persons, 11 6-persons
Size of nonfamily households: 93 1-person, 5 2-persons
66 married couples with children.
34 single-parent households (34 women).
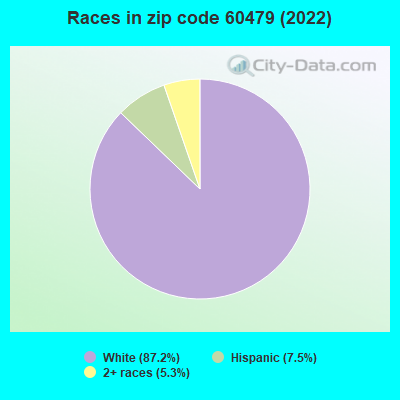
91.7% of residents of 60479 zip code speak English at home.
7.5% of residents speak Spanish at home (84% very well, 16% well).
Foreign born population: 25 (3.8%) (76.2% of them are naturalized citizens)
This zip code:
3.8%
Whole state:
14.4%
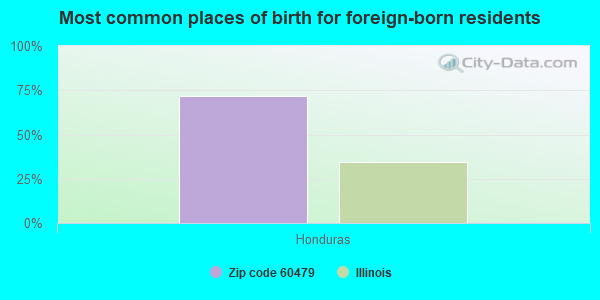
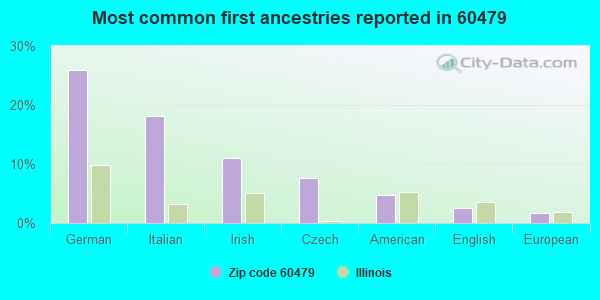
72%Honduras
26%German
18%Italian
11%Irish
8%Czech
5%American
2%English
2%European
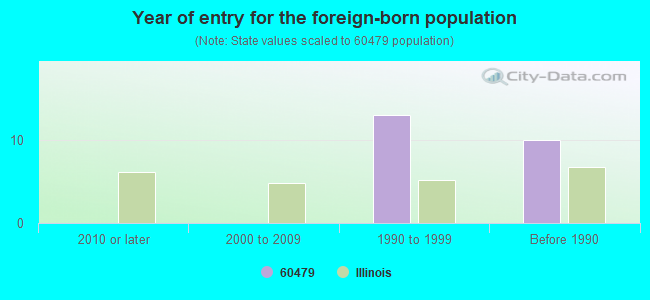
Year of entry for the foreign-born population
02010 or later
02000 to 2009
131990 to 1999
10Before 1990
Facilities with environmental interests located in this zip code:
MAZON FARMERS ELEVATOR CO (STATE ST in VERONA, IL)
STATE MASTER (Illinois EPA Project) - AIR PROGRAM AIR MINOR (AIRS/AFS) CRITERIA AND HAZARDOUS AIR POLLUTANT INVENTORY (Inventory of air pollution sources) Business SIC classification: GRAIN AND FIELD BEANS
GRACE, JOHN F (7440 W GRAND RIDGE RD in VERONA, IL)
STATE MASTER (Illinois EPA Project) - HAZARDOUS WASTE PROGRAM COMPLIANCE ACTIVITY (Tracking inspections of insecticide, fungicide, and rodenticide, and toxic substances) Conditionally Exempt Small Quantity Generators, less than 100 kg/month of hazardous waste (Resource Conservation and Recovery Act (tracking hazardous waste)) - notification Organizations: GRACE JOHN (CONTACT/OWNER)
Alternative names: GRACE JOHN
MAZON FARMERS ELEVATOR CO (MAIN ST in VERONA, IL)
STATE MASTER (Illinois EPA Project) - AIR PROGRAM AIR MINOR (AIRS/AFS) Business SIC classification: PETROLEUM BULK STATIONS AND TERMINALS Alternative names: MAXON FARMERS ELEVAT
MAZON-VERONA SCHOOL (VIENNA & DIVISION STS in VERONA, IL)
STATE MASTER (Illinois EPA Project) - AIR PROGRAM AIR MINOR (AIRS/AFS) Business SIC classification: ELEMENTARY AND SECONDARY SCHOOLS Alternative names: MAZON VERONA SCHOOL DIST 2
HIERZ SCRAP SERVICES (VERONA RD AND A.T. AND SF. RAI in VERONA, IL)
AIR MINOR (AIRS/AFS) CRITERIA AND HAZARDOUS AIR POLLUTANT INVENTORY (Inventory of air pollution sources) Business SIC classification: NONCLASSIFIABLE ESTABLISHMENTS Alternative names: JOHN HIERZ
LEAKE TRUCKING?H. (DIVISION ST-3 MI S OF RT 70 W. in VERONA, IL)
National Pollutant Discharge Elimination System NON-MAJOR (Tracking pollutant discharge elimination systems) - permit Alternative names: LEAKE, H. TRUCKING
Housing units lacking complete plumbing facilities: 0.8% Housing units lacking complete kitchen facilities: 5.8%
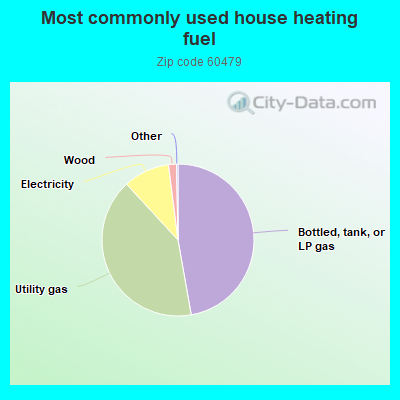
47.4%Bottled, tank, or LP gas
41.1%Utility gas
9.9%Electricity
1.7%Wood
Population in 1990: 769.
Place of birth for U.S.-born residents:
This state: 542
Northeast: 8
Midwest: 34
South: 32
West: 21
69% of the 60479 zip code residents lived in the same house 5 years ago. Out of people who lived in different houses, 45% lived in this county. Out of people who lived in different counties, 50% lived in Illinois.
98% of the 60479 zip code residents lived in the same house 1 year ago. Out of people who lived in different houses, 14% moved from different county within same state. Out of people who lived in different houses, 86% moved from different state.
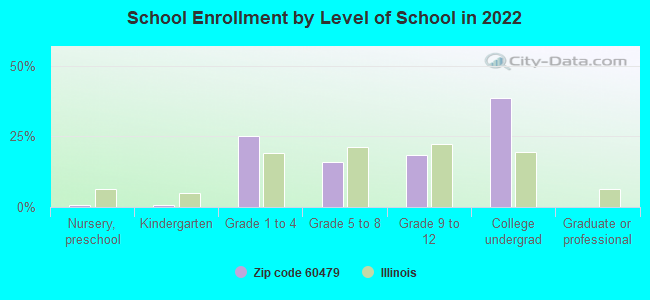
Private vs. public school enrollment:
Students in private schools in grades 1 to 8 (elementary and middle school): 8
Here:
16.4%
Illinois:
13.3%
Students in private schools in grades 9 to 12 (high school): 1
Here:
8.9%
Illinois:
9.9%
Students in private undergraduate colleges:
Here:
0.0%
Illinois:
27.4%
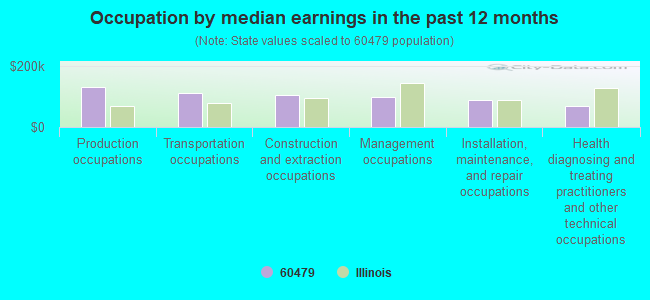
Occupation by median earnings in the past 12 months ($)
132,583Production occupations
113,686Transportation occupations
105,220Construction and extraction occupations
98,373Management occupations
88,263Installation, maintenance, and repair occupations
68,982Health diagnosing and treating practitioners and other technical occupations
Top industries in this zip code by the number of employees in 2005:
Wholesale Trade: Recyclable Material Merchant Wholesalers (10-19 employees: 1 establishment)
Construction: Highway, Street, and Bridge Construction (5-9: 1, 1-4: 1)
Construction: New Single-Family Housing Construction (except Operative Builders) (1-4: 1)
Construction: Painting and Wall Covering Contractors (1-4: 1)
Professional, Scientific, and Technical Services: Other Accounting Services (1-4: 1)
Accommodation and Food Services: Full-Service Restaurants (1-4: 1)
Fatal accident statistics in 2011:
Fatal accident count: 1
Vehicles involved in fatal accidents: 1
Fatal accidents caused by drunken drivers: 1
Fatalities: 1
Persons involved in fatal accidents: 1
Pedestrians involved in fatal accidents: 0
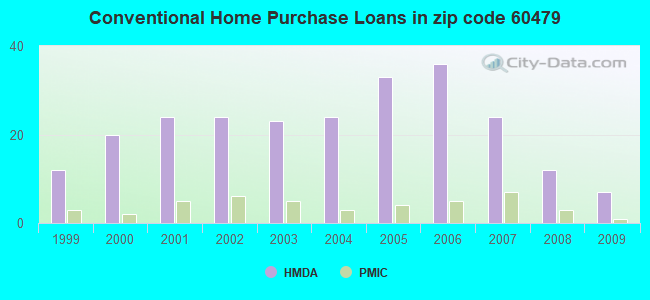
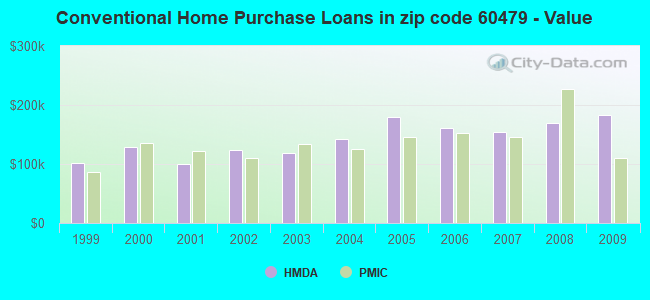
Home Mortgage Disclosure Act Aggregated Statistics For Year 2009 (Based on 4 partial tracts)
A) FHA, FSA/RHS & VA Home Purchase Loans
B) Conventional Home Purchase Loans
C) Refinancings
D) Home Improvement Loans
E) Loans on Dwellings For 5+ Families
F) Non-occupant Loans on < 5 Family Dwellings (A B C & D)
Number
Average Value
Number
Average Value
Number
Average Value
Number
Average Value
Number
Average Value
Number
Average Value
LOANS ORIGINATED
6
$150,627
7
$182,246
65
$162,850
3
$74,230
1
$125,290
4
$117,265
APPLICATIONS APPROVED, NOT ACCEPTED
1
$90,130
0
$0
3
$130,410
1
$20,740
0
$0
0
$0
APPLICATIONS DENIED
0
$0
1
$129,470
11
$186,415
0
$0
0
$0
1
$186,430
APPLICATIONS WITHDRAWN
1
$149,980
1
$172,890
6
$169,858
1
$76,710
0
$0
0
$0
FILES CLOSED FOR INCOMPLETENESS
1
$107,770
0
$0
2
$189,800
1
$58,320
0
$0
0
$0
Aggregated Statistics For Year 2008 (Based on 4 partial tracts)
A) FHA, FSA/RHS & VA Home Purchase Loans
B) Conventional Home Purchase Loans
C) Refinancings
D) Home Improvement Loans
F) Non-occupant Loans on < 5 Family Dwellings (A B C & D)
Number
Average Value
Number
Average Value
Number
Average Value
Number
Average Value
Number
Average Value
LOANS ORIGINATED
5
$148,520
12
$169,399
31
$163,646
3
$120,947
5
$130,636
APPLICATIONS APPROVED, NOT ACCEPTED
0
$0
1
$68,390
6
$188,050
0
$0
0
$0
APPLICATIONS DENIED
0
$0
1
$202,360
13
$189,025
4
$156,432
1
$209,860
APPLICATIONS WITHDRAWN
1
$130,600
0
$0
6
$227,687
0
$0
0
$0
FILES CLOSED FOR INCOMPLETENESS
0
$0
1
$75,760
2
$212,700
0
$0
0
$0
Aggregated Statistics For Year 2007 (Based on 4 partial tracts)
A) FHA, FSA/RHS & VA Home Purchase Loans
B) Conventional Home Purchase Loans
C) Refinancings
D) Home Improvement Loans
F) Non-occupant Loans on < 5 Family Dwellings (A B C & D)
Number
Average Value
Number
Average Value
Number
Average Value
Number
Average Value
Number
Average Value
LOANS ORIGINATED
4
$151,968
24
$154,739
38
$142,547
6
$33,735
4
$103,975
APPLICATIONS APPROVED, NOT ACCEPTED
0
$0
1
$204,000
5
$163,314
2
$47,525
0
$0
APPLICATIONS DENIED
0
$0
5
$155,728
14
$149,989
4
$44,950
1
$117,420
APPLICATIONS WITHDRAWN
0
$0
3
$162,857
9
$157,467
1
$64,420
0
$0
FILES CLOSED FOR INCOMPLETENESS
0
$0
1
$200,400
2
$114,240
0
$0
0
$0
Aggregated Statistics For Year 2006 (Based on 4 partial tracts)
A) FHA, FSA/RHS & VA Home Purchase Loans
B) Conventional Home Purchase Loans
C) Refinancings
D) Home Improvement Loans
F) Non-occupant Loans on < 5 Family Dwellings (A B C & D)
Number
Average Value
Number
Average Value
Number
Average Value
Number
Average Value
Number
Average Value
LOANS ORIGINATED
4
$143,405
36
$161,365
38
$132,887
7
$29,061
7
$103,996
APPLICATIONS APPROVED, NOT ACCEPTED
0
$0
4
$189,950
4
$118,670
1
$25,440
0
$0
APPLICATIONS DENIED
0
$0
11
$114,870
17
$138,101
2
$42,240
1
$101,250
APPLICATIONS WITHDRAWN
0
$0
4
$115,965
10
$156,841
0
$0
1
$96,050
FILES CLOSED FOR INCOMPLETENESS
0
$0
1
$191,140
4
$158,595
0
$0
0
$0
Aggregated Statistics For Year 2005 (Based on 4 partial tracts)
A) FHA, FSA/RHS & VA Home Purchase Loans
B) Conventional Home Purchase Loans
C) Refinancings
D) Home Improvement Loans
F) Non-occupant Loans on < 5 Family Dwellings (A B C & D)
Number
Average Value
Number
Average Value
Number
Average Value
Number
Average Value
Number
Average Value
LOANS ORIGINATED
4
$114,100
33
$179,588
47
$139,068
5
$62,356
5
$118,298
APPLICATIONS APPROVED, NOT ACCEPTED
0
$0
4
$186,692
6
$140,208
1
$20,400
1
$217,590
APPLICATIONS DENIED
0
$0
5
$103,878
25
$156,282
3
$42,500
0
$0
APPLICATIONS WITHDRAWN
0
$0
4
$126,422
15
$149,567
1
$44,080
0
$0
FILES CLOSED FOR INCOMPLETENESS
0
$0
3
$116,880
5
$159,262
0
$0
0
$0
Aggregated Statistics For Year 2004 (Based on 4 partial tracts)
A) FHA, FSA/RHS & VA Home Purchase Loans
B) Conventional Home Purchase Loans
C) Refinancings
D) Home Improvement Loans
F) Non-occupant Loans on < 5 Family Dwellings (A B C & D)
Number
Average Value
Number
Average Value
Number
Average Value
Number
Average Value
Number
Average Value
LOANS ORIGINATED
4
$135,670
24
$142,975
40
$134,951
7
$63,020
4
$114,318
APPLICATIONS APPROVED, NOT ACCEPTED
0
$0
2
$172,815
5
$108,078
0
$0
0
$0
APPLICATIONS DENIED
1
$82,020
4
$100,035
25
$131,483
3
$39,213
1
$23,930
APPLICATIONS WITHDRAWN
0
$0
3
$78,953
18
$122,512
1
$13,700
0
$0
FILES CLOSED FOR INCOMPLETENESS
0
$0
2
$152,960
6
$145,762
0
$0
0
$0
Aggregated Statistics For Year 2003 (Based on 4 partial tracts)
A) FHA, FSA/RHS & VA Home Purchase Loans
B) Conventional Home Purchase Loans
C) Refinancings
D) Home Improvement Loans
F) Non-occupant Loans on < 5 Family Dwellings (A B C & D)
Number
Average Value
Number
Average Value
Number
Average Value
Number
Average Value
Number
Average Value
LOANS ORIGINATED
4
$154,755
23
$119,417
118
$125,418
3
$19,610
7
$88,367
APPLICATIONS APPROVED, NOT ACCEPTED
0
$0
2
$154,825
7
$163,437
2
$43,415
0
$0
APPLICATIONS DENIED
0
$0
2
$113,895
24
$141,830
1
$22,200
1
$121,460
APPLICATIONS WITHDRAWN
0
$0
3
$129,260
17
$131,537
0
$0
0
$0
FILES CLOSED FOR INCOMPLETENESS
0
$0
0
$0
1
$138,300
0
$0
0
$0
Aggregated Statistics For Year 2002 (Based on 4 partial tracts)
A) FHA, FSA/RHS & VA Home Purchase Loans
B) Conventional Home Purchase Loans
C) Refinancings
D) Home Improvement Loans
F) Non-occupant Loans on < 5 Family Dwellings (A B C & D)
Number
Average Value
Number
Average Value
Number
Average Value
Number
Average Value
Number
Average Value
LOANS ORIGINATED
6
$110,167
24
$123,402
84
$122,925
6
$24,303
3
$76,807
APPLICATIONS APPROVED, NOT ACCEPTED
0
$0
1
$423,940
7
$121,356
1
$13,610
0
$0
APPLICATIONS DENIED
0
$0
2
$75,995
18
$95,752
4
$19,180
1
$50,410
APPLICATIONS WITHDRAWN
0
$0
2
$130,230
12
$130,620
0
$0
0
$0
FILES CLOSED FOR INCOMPLETENESS
0
$0
0
$0
1
$175,890
0
$0
0
$0
Aggregated Statistics For Year 2001 (Based on 4 partial tracts)
A) FHA, FSA/RHS & VA Home Purchase Loans
B) Conventional Home Purchase Loans
C) Refinancings
D) Home Improvement Loans
F) Non-occupant Loans on < 5 Family Dwellings (A B C & D)
Number
Average Value
Number
Average Value
Number
Average Value
Number
Average Value
Number
Average Value
LOANS ORIGINATED
6
$111,505
24
$100,627
51
$110,268
8
$17,904
4
$69,872
APPLICATIONS APPROVED, NOT ACCEPTED
0
$0
2
$121,050
5
$104,114
0
$0
0
$0
APPLICATIONS DENIED
1
$67,850
5
$91,728
12
$101,658
2
$18,200
1
$13,910
APPLICATIONS WITHDRAWN
0
$0
2
$90,575
9
$297,458
1
$29,360
0
$0
FILES CLOSED FOR INCOMPLETENESS
0
$0
0
$0
2
$115,875
0
$0
0
$0
Aggregated Statistics For Year 2000 (Based on 4 partial tracts)
A) FHA, FSA/RHS & VA Home Purchase Loans
B) Conventional Home Purchase Loans
C) Refinancings
D) Home Improvement Loans
F) Non-occupant Loans on < 5 Family Dwellings (A B C & D)
Number
Average Value
Number
Average Value
Number
Average Value
Number
Average Value
Number
Average Value
LOANS ORIGINATED
4
$106,722
20
$128,430
12
$104,460
8
$26,640
2
$124,055
APPLICATIONS APPROVED, NOT ACCEPTED
0
$0
1
$39,530
1
$39,500
1
$19,570
0
$0
APPLICATIONS DENIED
0
$0
6
$69,915
5
$85,596
2
$8,815
0
$0
APPLICATIONS WITHDRAWN
0
$0
1
$108,590
3
$86,713
0
$0
0
$0
FILES CLOSED FOR INCOMPLETENESS
0
$0
0
$0
1
$59,250
0
$0
0
$0
Aggregated Statistics For Year 1999 (Based on 2 partial tracts)
A) FHA, FSA/RHS & VA Home Purchase Loans
B) Conventional Home Purchase Loans
C) Refinancings
D) Home Improvement Loans
F) Non-occupant Loans on < 5 Family Dwellings (A B C & D)


 Nearest zip codes: 60437, 61360, 60444, 60470, 60450, 60420.